HAL Id: hal-00318317
https://hal.archives-ouvertes.fr/hal-00318317
Submitted on 4 Jun 2007
HAL is a multi-disciplinary open access
archive for the deposit and dissemination of
sci-entific research documents, whether they are
pub-lished or not. The documents may come from
teaching and research institutions in France or
abroad, or from public or private research centers.
L’archive ouverte pluridisciplinaire HAL, est
destinée au dépôt et à la diffusion de documents
scientifiques de niveau recherche, publiés ou non,
émanant des établissements d’enseignement et de
recherche français ou étrangers, des laboratoires
publics ou privés.
P. Satyamurty, M. da Silva Teixeira, C. Klug Padilha. Warm and Dry Spells (WDS) in Austral
Winter over Central South America. Annales Geophysicae, European Geosciences Union, 2007, 25
(5), pp.1049-1069. �hal-00318317�
www.ann-geophys.net/25/1049/2007/ © European Geosciences Union 2007
Annales
Geophysicae
Warm and Dry Spells (WDS) in Austral Winter over Central South
America
P. Satyamurty, M. da Silva Teixeira, and C. Klug Padilha
Centro de Previs˜ao de Tempo e Estudos Clim´aticos (CPTEC), Instituto Nacional de Pesquisas Espaciais (INPE), Av. Astronautas, No. 1758, S˜ao Jos´e dos Campos, SP, CEP: 12.245-970, Brazil
Received: 22 December 2006 – Revised: 11 April 2007 – Accepted: 7 May 2007 – Published: 4 June 2007
Abstract. The horizontal and vertical structure of unusually
warm and dry spells (WDS) over the central parts of South America during the winter and post-winter months (JJAS) are studied. During WDS the mean temperature and humidity anomalies over central Brazil are about +4.1◦C and −13.2%, respectively. The mean duration of WDS is 11 days and their mean frequency is less than one per year during the months of JJAS. Apparently, WDS have no preference for the phase of ENSO. Widespread and persistent subsidence in the mid-dle troposphere is observed in tropical Brazil during WDS, which renders the lower tropospheric air warm and dry. The negative anomalies of the specific humidity are observed to be associated with the subsidence regions. A strong, slow moving ridge in the eastern South Pacific and a low-pressure center in northern Argentina are important surface charac-teristics during the WDS. A more detailed investigation of two specific WDS events, a strong event (August–September 1999) and a moderate one (June 2002), shows a blocking-like situation in the 500-hPa geopotential and surface pres-sure fields in the Pacific. The South Atlantic subtropical high somewhat approaches the continent. Strong northerlies over the central and eastern parts of Brazil are also observed in the lower troposphere. During WDS the regional circulation acquires summertime characteristics, except for the absence of precipitation, and the circulation in the meridional plane is in the opposite sense from the Hadley circulation. A frontal system, supported by a 500-hPa trough, advances into central Brazil, causing the dissipation of the anomalous situation.
Keywords. Hydrology (Drought) – Atmospheric
composi-tion and structure (Biosphere-atmosphere interaccomposi-tions; Ther-mosphere – composition and chemistry)
Correspondence to: P. Satyamurty
(saty@cptec.inpe.br)
1 Introduction
In the central parts of Brazil and the adjoining countries in South America the winter and post-winter months (June through September, JJAS) present warm and dry spells (WDS) of one or two weeks in duration and are locally called “veranicos”, which means literally little summers (Satya-murty et al., 1998). The atmospheric humidity in this region reaches its minimum in winter (DNMET, 1992) and when the temperature rises anomalously above the climatological mean during warm spells the relative humidity drops to lev-els below 40%. Although the meteorologists in Brazil know the phenomenon, there have been very few systematic stud-ies of the WDS and their environmental impacts (Assad et al., 1993).
The WDSs are part of the intraseasonal variability in the atmospheric conditions over South America. An understand-ing of the physical and dynamical characteristics of these phenomena is a first step to improve medium-range weather forecasts in the region. A second motivation for the present study is the general discomfort experienced by the popula-tion and the rise of vegetapopula-tion fires in central Brazil, reported widely in the media, during the WDSs.
The objectives of the present study are (1) to describe the synoptic scale and regional scale meteorological conditions associated with the WDSs in the central parts of South Amer-ica, with special attention to the central parts of Brazil, and (2) to obtain a climatology of those events and some insights into the possible mechanisms of their formation and dissipa-tion. The importance of the present study arises from the fact that the WDSs may influence human comfort (Braga et al., 2000) and vegetation fires in the region.
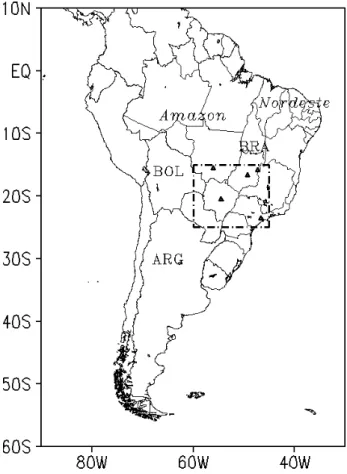
Fig. 1. Locator map. BRA: Brazil, ARG: Argentina, BOL:
Bo-livia. The Amazon (Amazon) and Northeast Brazil (Nordeste) are indicated. The rectangle is the target area. Deltas mark the 5 ma-jor cities where the surface temperature observations are compared with the NCEP/NCAR data.
2 Data and methodology
2.1 Identification of WDS
The National Centers for Environmental Prediction (NCEP)/National Center for Atmospheric Research (NCAR) reanalysis grid point data sets with 2.5◦ latitude×2.5◦ lon-gitude resolution for 00:00 UTC for the period 1961–2003 are used in this study. In order to identify the WDSs that affect the central parts of Brazil, a target area bounded by 13.75◦S, 26.25◦S and 43.75◦W, 61.25◦W is considered and is shown in Fig. 1. The target area has 35 horizontal grid points and is big enough to represent central Brazil and it contains many state capitals away from the coast, such as Brasilia, Sao Paulo, Goiania, Cuiaba and Campo Grande, and where nearly 30% of Brazil’s population lives.
The area-averaged 00:00 UTC surface temperature (more precisely 1000 hPa temperature) over the target area, i.e. av-eraged over the 35 grid points, is designated here as T. The corresponding monthly climatological value averaged over the target area is designated as Tc and is a function of the
(a)
(b)
Fig. 2. Frequency distributions of the mean temperature anomalies
over the target area (a) 4-day averaged anomaly and (b) weekly averaged anomaly. SD is standard deviation. Q75, Q80, Q85, Q90 are the percentile values at 75%, 80%, 85%, and 90% level. (◦C).
month of the year. For a given month Tc is obtained by av-eraging the 00:00 UTC surface temperature over the same 40 calendar months in the period 1961 through 2000. The anomaly T′ is given by T−Tc. T′ is a function of day only (not a function of grid point) and is the daily 00:00 UTC
Table 1. Characteristics of Warm and Dry Spells (WDS) in the period 1961–2003. BEGIN: beginning date. DUR: duration in days. hT′i,
hr′i, hq′i: episode-mean anomalies averaged over the target area of temperature, relative humidity and specific humidity, respectively, at 1000 hPa. SI: severity index. EN, LN, N indicate ENSO phases, El Ni˜no, La Ni˜na and normal years, respectively. RANK is the order of the event in terms of SI. WDSs used in case studies are shaded.
CASE BEGIN DUR (days) hT′i(◦C) hr′i(%) hq′i(g/kg) SI ENSO RANK
1 17 Aug 1961 19 3.8 −13.6 −1.0 8.1 N 2 2 10 Sep 1961 14 4.4 −10.1 0.1 5.1 N 8 3 2 Sep 1962 8 4.6 −22.1 −2.8 4.4 N 12 4 11 July 1963 12 4.4 −20.5 −1.7 6.2 EN 4 5 20 Aug 1963 21 4.9 −18.3 −1.7 11.5 EN 1 6 22 Sep 1963 9 4.1 −18.8 −2.3 4.3 EN 13 7 25 Aug 1964 9 3.7 −11.3 −0.5 3.1 LN 23 8 25 Aug 1965 12 3.5 −16.1 −1.7 5.2 EN 6 9 9 Sep 1966 8 4.2 −10.6 −0.1 2.7 N 28 10 12 Aug 1967 12 4.1 −12.0 −0.3 4.6 N 10 11 30 Aug 1967 11 3.9 −18.7 −2.1 5.2 N 7 12 12 Aug 1969 9 3.6 −13.8 −1.0 3.5 EN 18 13 10 Sep 1969 11 4.8 −18.8 −2.0 5.8 EN 5 14 23 Sep 1969 8 4.8 −16.7 −0.9 3.5 EN 19 15 25 Sep 1970 9 3.9 −12.5 −0.5 3.0 LN 25 16 21 July 1971 10 3.4 −16.4 −1.3 4.0 LN 15 17 3 June 1972 12 3.8 −9.0 1.1 3.4 EN 20 18 25 Aug 1974 8 3.8 −6.2 0.9 1.9 LN 32 19 24 July 1976 8 3.3 −6.6 0.9 1.8 EN 33 20 12 June 1984 15 3.4 −8.8 0.6 4.2 LN 14 21 7 July 1987 13 4.7 −4.0 2.3 3.3 EN 21 22 24 Aug 1988 9 3.9 −15.6 −1.4 3.9 LN 17 23 21 Sep 1988 8 5.0 −13.2 0.1 3.2 LN 22 24 26 June 1993 11 4.8 −12.3 0.8 4.0 EN 16 25 9 Aug 1995 8 4.4 −8.6 0.6 2.5 LN 29 26 26 Aug 1995 9 4.5 −17.5 −1.5 4.4 LN 11 27 19 June 1997 9 4.2 −5.9 1.9 2.3 EN 30 28 2 Sep 1997 10 4.7 −19.3 −1.8 5.0 EN 9 29 27 Aug 1999 14 4.0 −17.3 −1.7 6.7 LN 3 30 8 June 2000 9 2.9 −9.6 0.0 2.3 LN 31 31 21 Aug 2000 8 4.4 −12.2 −0.5 3.0 LN 24 32 2 June 2002 10 4.0 −11.2 0.5 2.9 EN 26 33 12 Aug 2002 9 3.3 −9.4 −0.3 2.8 EN 27 MEAN 11 4.1 −13.2 −0.5 4.2
area-mean temperature anomaly over the target area. There are 4880 values of T′ over the 40 seasons of June through September (JJAS) in the period 1961–2000. We are inter-ested in identifying anomalous warm spells that persist for several days. Thus, from the values of T′, 4-day and 7-day running average temperature anomalies over the target area, T′
4and T′7, respectively, are obtained.
In the case of 7-day running means (T′7)we have consid-ered the data from 29 May through 3 October over the 40 years to have 4880 values, and for T′4 the daily data from 30 May through 2 Oct are considered. The frequency dis-tributions of T′4and T′7are constructed and their respective standard deviations, σ (T′4)and σ (T′7), and percentiles are
ob-tained. The frequency distributions are shown in Fig. 2. The standard deviations of T′4and T′7are 2.43◦C and 2.05◦C, re-spectively, which correspond to approximately the 85th per-centiles of the respective distributions. The threshold values of T′4and T′7for the identification of WDS are based on these statistics. The exact procedure for the identification of the warm spells is given below.
In JJAS (austral winter and post-winter season) T′ series, the daily temperature anomalies averaged over the target area given in Fig. 1, are examined. All the periods of 7 consecu-tive days or longer over which T′is greater than 2.0◦C (ap-proximately one σ (T′7))are identified. All these periods are candidates for warm spells. If, within such a period, there
Fig. 3. Area mean temperature anomaly (◦C) for the period 29 May–16 June 2002. Mean is obtained over 35 grid points in the target area shown in Fig. 1.
are 4 consecutive days with T′≥2.5◦C (approximately one
σ(T′4)), the period is designated as a warm spell. This means that during a warm spell there is at least one period of 4 con-secutive days on which the area-mean temperature anomaly is greater than or equal to 2.5◦C. When an episode is iden-tified at the beginning of June, the last week of May is also examined to obtain the full duration of the episode. Simi-larly when an episode is identified at the end of the month of September the first week of October is also examined to include the full duration of the episode. The warm spell du-ration in days (n) is the number of consecutive days in which T′≥2.0◦C.
The above criterion is based solely on temperature anomaly. For all such episodes the corresponding mean rela-tive humidity anomaly and the specific humidity anomaly at the 1000-hPa level, r′and q′, averaged over the target area, are calculated for all the days of the warm spells. From the daily values of T′, r′, and q′the episode averages (mean of the variable over the n days), hT′i, hr′iand hq′i, are calculated and are used to characterize the warm spells. For the purpose of determining the climatology we used 40-year data from 1961 through 2000. However, the warm spells are identified in the 43-year period 1961–2003.
Table 1 shows all the warm spells identified in the period 1961 through 2003 in the months of June through Septem-ber. We note that, although the criterion for the identifica-tion of warm spells is based on temperature anomalies alone, the episode-mean relative humidity anomalies averaged over the target area are negative in all of the 33 cases identified. Hence, we designate these episodes as Warm and Dry Spells (WDSs).
An example is necessary for an understanding of the crite-ria used for the identification of the WDSs. The temperature anomaly, T′, in the period 29 May through 16 June 2002 is shown in Fig. 3. According to the criteria given above in
(a) (b)
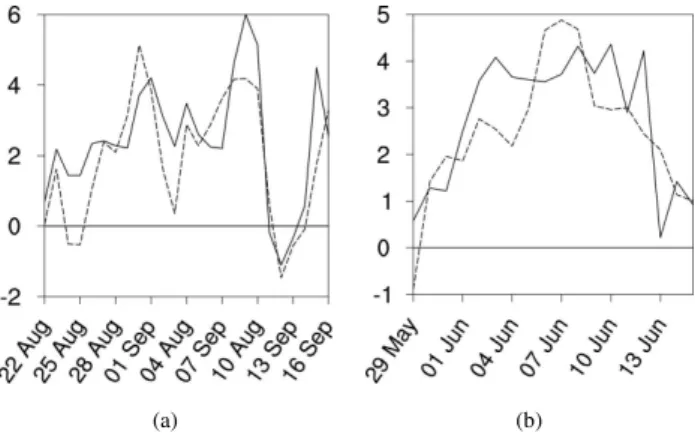
Fig. 4. Evolution of temperature anomaly for (a) 20 August through
16 September 1999, and (b) 20 May through 21 June 2002 (see Table 1). Continuous line: obtained from surface observations in the target area. Broken line: obtained from NCEP reanalysis values in the grid boxes around the surface stations. WDS cases 29 and 32 (Table 1) are contained in the periods shown in panels (a) and (b), respectively.
this section, the period 2 June through 11 June is a warm spell and, from the r′values given in Table 1 (Case 32), we identify it as a WDS. This spell persists for 10 days and the daily mean temperature anomaly is higher than 2.5◦C on 9 consecutive days, the episode mean temperature anomaly is 4.0◦C, and the episode-mean relative humidity is 11% less than normal.
We have checked the suitability of the data sets used in this study by comparing the average temperature anomalies obtained from the NCEP data with those obtained from the synoptic station data from the state capitals mentioned in the first paragraph of this section. We have used the NCEP data in the grid boxes containing the stations for the calculation of the NCEP-temperature anomaly. The synoptic observa-tions are used to obtain the station-temperature anomaly with respect to the 1961–1990 climatological values (DNMET, 1992). Both are presented in Fig. 4 for two cases of WDS (cases 29 and 32 in Table 1). It can be seen that the evo-lution of the temperature anomaly obtained from the NCEP data agrees very well with that obtained from observations. 2.2 Severity of WDS
A measure for the severity of the WDS is necessary to per-mit comparisons among episodes. A nondimensional index for measuring the severity of the WDS is designed for this purpose, taking into account the duration, the episode mean temperature anomaly and the episode mean relative humidity anomaly, and is given by:
SI = (1/Tc)6T′−(1/rc)6r′, (1)
where Tcand rcare mean climatological values of tempera-ture (◦C) and relative humidity (%) over the target area for
the month of the episode. The summations in Eq. (1) are over the n days (duration) of the WDS. If a WDS has a few days in one month and a few in the next or previous month, a weighted average of the climatological temperatures, Tc, of the two months is used in Eq. (1). The index is simply the sum of the normalized positive anomalies of temperature in ◦C and normalized negative anomalies of relative humidity in percentage points. It is easy to see from Eq. (1) that SI is higher for longer WDS episodes.
Based on the SI values the episodes can be categorized into two classes, strong and moderate WDS, each one con-taining approximately 50% of the events. The strong events have SI≥3.9 and the moderate ones have SI<3.9. The WDS shown in Fig. 3 is a moderate event.
2.3 Compositing
Episode mean fields of surface temperature, surface pressure, 500-hPa geopotential, 850-hPa humidity, 850-hPa winds, 250-hPa winds, 500-hPa vertical velocity and their anoma-lies are obtained over South America and adjoining seas by averaging 00:00 UTC daily fields over the duration of the WDS in consideration. Composites of meteorological fields of the WDSs and the anomalies are obtained by averaging the episode-mean fields over the 17 strong WDS cases. These fields serve to represent the average characteristics of those WDSs. It should be remembered, at the time of examining the composites, that the individual WDS are all not identical and, therefore, the averaging process will reduce the intensity of the composite anomaly fields.
2.4 Diagnostics
The thermal advection in the lower troposphere (850 hPa and 700 hPa) is calculated over South America for a period covering all the days of the WDS and a few days imme-diately before and after the episode, using the expression
−[u(∂θ/∂x)+v(∂θ/∂y)], where u, v, θ are the zonal and meridional wind components and potential temperature, re-spectively. Similarly, the adiabatic heating and cooling of the lower troposphere due to vertical motion is calculated, us-ing the expression −ω(∂θ/∂p), where ω is vertical velocity. These fields will enable us to compare the effects of adiabatic heating due to vertical motion with the effects of horizontal thermal advection.
The horizontal and vertical advections of humidity in the lower troposphere are calculated using the expressions –[u(∂q/∂x)+v(∂q/∂y)] and −ω∂q/∂p, respectively. These calculations will enable us to appreciate the effects of sub-sidence on drying the lower troposphere compared to the ef-fects of horizontal advection of water vapor flux.
3 General characteristics of WDS
3.1 Duration and intensity
Table 1 shows that, on the average, the frequency of the WDSs in the months of JJAS is about 0.8 cases per year (33 cases in 43 years). The average duration of the WDSs is 11 days and the mean temperature and the humidity anoma-lies during the episodes are found to be 4.1◦C and −13.2%, respectively. The mean specific humidity anomaly is small (−0.5 g kg−1). In some WDSs the average relative humidity anomaly is as low as −20%.
According to Table 1, there are nine cases with SI values greater than or equal to 5.0. The August–September 1963 event (Case 5) is the severest WDS with a duration of 21 days and the episode-mean temperature anomaly over the target area is +4.9◦C and the humidity anomaly is −18.3%. The weakest WDS is registered in July 1976 during which the average temperature anomaly is 3.3◦C. Its duration is just 8 days. The relative humidity is only 6.6% lower than nor-mal. Actually the specific humidity anomaly is positive in this case. Its SI value is 1.8. In 22 cases the specific humid-ity anomaly is also negative, suggesting the effects of subsi-dence and horizontal advection of dry air. In the remaining eleven cases the specific humidity anomaly over the target area is positive, however, the relative humidity anomaly is negative.
Some interannual variability in the frequency of occur-rence and the severity of the WDS can be seen in Table 1. The years 1963 and 1969 present three episodes each. Eleven of the 43 years do not present any case. The decadal distri-bution of the events shows large variability. Fourteen out of 33 events are identified in the 1960s and the rest of the events are distributed over the three recent decades.
ENSO phases are indicated in the last column of the ta-ble. There are 15 WDSs in the El Ni˜no years, 12 in the La Ni˜na years and 6 in the neutral years. The distribution and intensity of WDS do not show any definite relation with the ENSO phase. This suggests that WDS is more a result of re-gional scale and synoptic scale perturbations. These aspects are presented in Sect. 4.
3.2 Composite fields
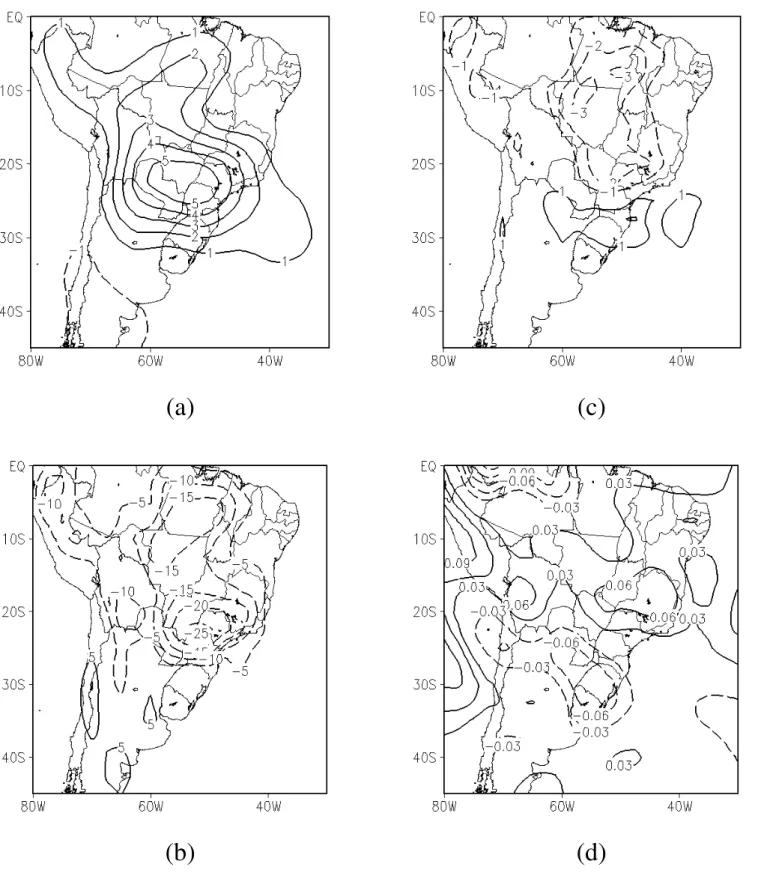
Composite fields of a phenomenon offer a coherent picture of the average characteristics of that phenomenon. The com-posites of the fields of some important meteorological vari-ables for the strong WDS cases are presented here. Figure 5 shows the fields of temperature anomaly, relative humidity anomaly and the specific humidity anomaly at the 1000-hPa level and the 500-hPa vertical velocity (ω). We note that the region of positive temperature anomaly in the composite field (mean of the 17 strong WDSs) occupies a large area in central South America over Paraguay, western and southern Brazil, northern Argentina and Bolivia (Fig. 5a). In the center of
(a)
(c)
(b)
(d)
Fig. 5. Composite mean (a) surface temperature anomaly (◦C), (b) specific humidity anomaly (g/kg), (c) relative humidity anomaly (%), and
(a)
(b)
(c)
(d)
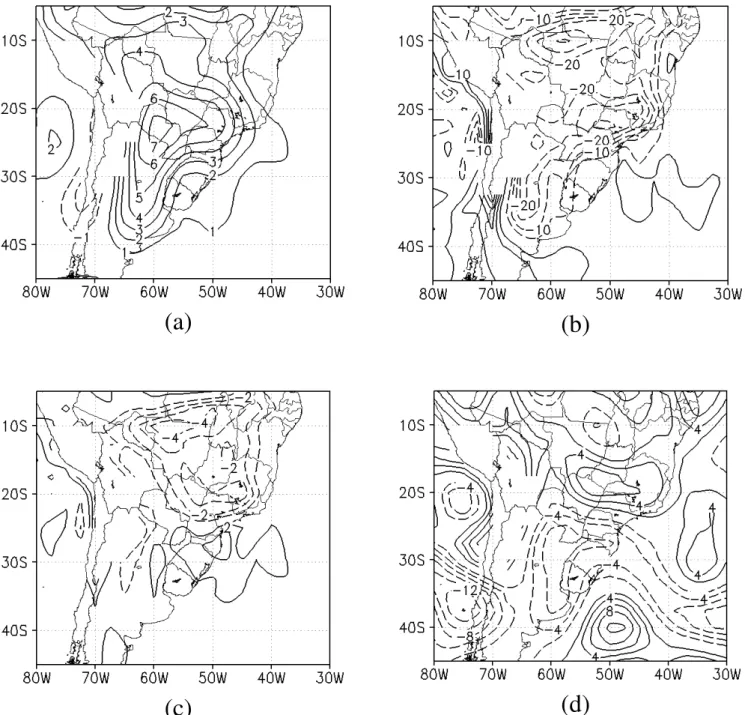
Fig. 6. Composite mean (a) surface pressure anomaly (hPa), (b) 500-hPa geopotential anomaly (m), (c) 850-hPa wind anomaly, and (d)
250-hPa wind anomaly for 17 strong WDSs. Dark lines in panels (c) and (d) are isotachs (m s−1)and light lines are streamlines.
this region the magnitude of the anomaly is greater than 5◦C. The specific humidity anomalies (Fig. 5c) are negative with values ranging from −1 g/kg to −3 g/kg. The highest val-ues of negative specific humidity anomalies are observed in central Brazil, north of the temperature anomaly maximum. The relative humidity anomalies (Fig. 5b) range from −10% to −25% over south-central Brazil. Higher temperatures and lower specific humidity values indicate that the subsidence of upper tropospheric air into the lower troposphere may also be playing an important role in warming and drying. To check this the 500-hPa ω is shown in Fig. 5d. There is widespread subsidence (positive values of ω) over tropical South
Amer-ica north of 20◦S and ascending motion over northern Ar-gentina and Uruguay. It is interesting to note that subsidence in the tropics and ascending motion to the south suggest cir-culation contrary to the Hadley circir-culation in the vertical plane.
The composites of the anomalies of sea-level pressure, 500-hPa geopotential, the 850-hPa wind and 250-hPa wind fields are given in Fig. 6. We note, firstly, a low pressure anomaly at sea level (Fig. 6a) and a high pressure anomaly at the 500-hPa level (Fig. 6b) over the south-central parts of Brazil. This is characteristic of a warmer-than-normal lower troposphere. The surface low pressure anomaly region is a
(a)
(b)
(c)
(d)
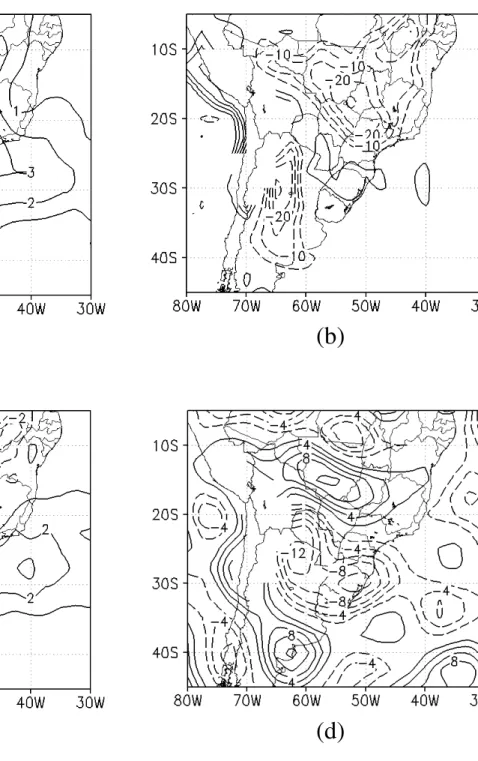
Fig. 7. Episode-mean anomaly fields for Case 29 (27 August through 10 September 1999) of (a) temperature (◦C), (b) relative humidity (%), and (c) specific humidity (g kg−1)at 1000 hPa (surface), and (d) vertical velocity (Pa s−1)at 500 hPa, over South America at 00:00 UTC. Broken lines indicate negative values.
thermal low and the ridge or the high pressure region in the middle troposphere is a consequence of the hydrostatic bal-ance. Actually, the whole field (not anomaly) of sea-level pressure (not presented) shows a closed low pressure center of 1008 hPa over Paraguay.
The 850-hPa wind anomaly (Fig. 6c) shows a northwest-erly component of more than 3 ms−1 over Paraguay and western Brazil. The whole field (not presented) shows a north-northwesterly wind maximum over Paraguay. These
lower tropospheric northerlies confirm the circulation char-acteristics in the vertical plane mentioned above. The 250-hPa wind anomaly (Fig. 6d) shows an anomalous anticy-clonic circulation over the central parts of South Amer-ica. The jetstream to the south of the circulation center is strengthened during the strong WDS episodes.
The lower pressure at the surface, ridge in the mid-dle troposphere, anomalously strong northwesterlies in the lower troposphere and anticyclonic circulation in the upper
troposphere are characteristics similar to summer circulation over South America, especially during the periods of acti-vated South Atlantic Convergence Zone (SACZ) (Figueroa, 1997; Satyamurty et al., 1998), except that during SACZ events the upper level anticyclone is somewhat to the north-west of the anticyclonic anomaly shown in Fig. 6d, i.e. dur-ing the strong WDSs the atmospheric circulation acquires summer season characteristics in austral winter. There is of course one difference: there is no rainfall (or there is little rainfall) associated with WDS, whereas precipitation is gen-erally heavy in the SACZ episodes.
4 Horizontal and vertical structure, and the evolution of WDS
The structure and evolution of WDS are presented for two cases: August–September 1999 (Case 29) and June 2002 (Case 32) WDS episodes. The episode mean characteristics over South America are shown first. These characteristics are different from the composite characteristics described in Sect. 3 in terms of the intensity of the anomalies and the po-sition of the center of the WDS. Later, the evolution of the structure of the atmospheric flow during the WDS episodes is described. The reasons for choosing these two cases are that their intensities are distinct (see Table 1), one strong and the other moderate, and they happened during distinct phases of ENSO.
4.1 August–September 1999 WDS
The episode-mean anomaly fields of 1000-hPa temperature, relative humidity, specific humidity and 500-hPa vertical mo-tion, ¯T, ¯r, ¯qand ¯ω, respectively, over South America for the Aug-Sep 1999 WDS (Case 29 in Table 1) are shown in Fig. 7. The positive temperature anomaly and negative relative hu-midity anomaly centers at about 24◦S, 59◦W occupy large areas in Brazil and adjoining countries, mainly Argentina, Paraguay and Bolivia (Figs. 7a and b). The 14-day mean temperature is 7◦C higher than normal and the relative hu-midity is 25% lower than the climatology in the centers of the respective fields. The horizontal extent of the area af-fected by the WDS is very large. The WDS is a continental size phenomenon. Figure 7 shows the full intensity of a sin-gle episode while Fig. 5 shows the average of 17 episodes.
The specific humidity anomaly (Fig. 7c) is negative north of 25◦S, with a magnitude of ∼2 g kg−1 in the subtropical region and ∼4 g kg−1 in the tropical region over the east-ern Amazon Basin in Brazil. This indicates that, during this WDS, the relative humidity anomaly is strongly affected by lower water vapor content in the air (Fig. 7c), as well as by the higher temperature (Fig. 7a).
The mean vertical velocity field at 500 hPa (Fig. 7d) shows that the vertical motion is largely subsidence over the sub-tropical Brazil. Subsidence in the middle troposphere causes
the air to become warmer by adiabatic compression and drier by downward advection of upper tropospheric air into the lower troposphere. Strong rising motion is found south of 22◦S in northeastern Argentina and southern Brazil. In these regions the thermal advection should have an important role for the appearance of positive temperature anomalies during the WDS.
In order to obtain an idea of the depth of the warm and dry air mass during the WDS, episode-mean fields of tem-perature, relative humidity and specific humidity anomalies are also calculated at 850 hPa and 700 hPa. Figure 8 shows the fields at 850 hPa for this WDS case. The centers of the positive temperature anomaly and the negative relative hu-midity anomaly occupy large areas over the South American continent north of 40◦S. The anomaly centers are somewhat weaker at this level and are shifted to the east compared to the surface anomalies. The negative anomalies of specific hu-midity (Fig. 8c) are of the order of 1 g kg−1in the subtropics
and tropics over the continent. These anomalies in the three fields persist up to the 700-hPa level (figure not shown) but with reduced intensity. On the whole, the observations show that the warm and dry air mass responsible for the WDS is fairly deep, occupying the whole lower troposphere.
A sequence of the fields of 500-hPa geopotential height and its anomaly for the period 24 August through 9 Septem-ber 1999 at intervals of two to five days is shown in Fig. 9. The sequence starts with a positive geopotential anomaly over Argentina on 24 August (Fig. 9a, two days before the beginning of WDS) and ends with a large negative anomaly on 9 September (Fig. 9f) towards the end of the WDS. Over the South Pacific Ocean the conditions observed are: (1) geopotential anomalies of opposite signs, on the average, north of 40◦S and south of 45◦S, (2) a strong ridge around 120◦W and a strong trough downstream in the period 24–28 August, considered the development stage of the WDS, (3) a blocking-like situation near 90◦W, with a low center around 45◦S and a ridge to the south, in the period 31 August– 3 September, (4) a strong ridge at 100◦W flanked by deep troughs on 7 September moving to 90◦W on 9 September. A highly amplified trough formation over Argentina, Paraguay and southern Brazil on 9 September indicates cooler air in the lower troposphere which slowly moves northeastward, caus-ing the temperatures to cool down over the central parts of the continent in the subsequent days.
The sequence described resembles somewhat a dipole omega block (Lejenas, 1984) in the first half of the WDS. The negative anomalies to the north and the positive anoma-lies to the south of 45◦S (Fig. 9d) reduce the south-to-north pressure gradient in the eastern South Pacific. This, in turn, reduces the strength of the westerly current in the Pacific. This causes the weather systems over South America to ad-vance slowly. Moreover, the dry air mass over the continent does not permit the weather systems to penetrate northward. The short wave low-pressure center over Chile at 32◦S on 24 August moves to 40◦S, 65◦W in the Atlantic on 26 August.
(a)
(b)
(c)
Fig. 8. Episode-mean anomaly fields for Case 29 (27 August through 10 September 1999) of (a) temperature (◦C), (b) relative humidity (%), and (c) specific humidity (g kg−1)at 850 hPa. Broken lines indicate negative values.
However, the low center in the Pacific at 90◦W, 47◦S on 31 August stays unmoved till 3 September (Fig. 9d). Only on 7 September does it become a trough and starts moving eastward on to the continent. On 9 September the trough intensifies over the continent (Fig. 9f). The intensification and movement of this trough has implications regarding the movement of a frontal system at the surface, which we will see in the surface pressure fields given in Fig. 10.
The sequence of sea-level pressure also shows the same characteristics seen in the middle troposphere in the eastern
South Pacific, namely, largely negative anomalies north of 45◦S and positive anomalies to the south, with situations re-sembling a blocking. From 26 August through 3 September (Figs. 10b–d) a high-pressure center around 60◦S and a low-pressure center to its north are shown around 100◦W. From 26 through 31 August the South Atlantic subtropical high somewhat approaches the continent, and a low-pressure cen-ter deepens in northern Argentina on 31 August. As a result, a strong west-to-east pressure gradient builds which permits strong northerlies over central and southern Brazil, which, in
(a)
(b)
(c)
(d)
(e)
(f)
Fig. 9. 500-hPa geopotential height (m) and its anomaly for (a) 24, (b) 26, (c) 31 August, (d) 3, (e) 7, (f) 9 September 1999 at 00:00 UTC.
Darker lines are geopotential and lighter lines are anomalies. Broken lines indicate negative anomalies.
(a)
(b)
(c)
(d)
(e)
(f)
Fig. 10. Same as in Fig. 8 except for the mean sea-level pressure (hPa).
turn, permits strong thermal advection. The near north-south orientation of the isobars in Brazil continues up to 7 Septem-ber. The winds at 850 hPa on 31 August, 3 September and 7 September, shown in Fig. 11, give us an idea of the persis-tence of the northerly flow in the lower troposphere.
A low-pressure center in the Atlantic off the Argentina coast intensifies on 7 September (not shown), as a conse-quence of the warm advection at the surface and is helped by the approaching middle tropospheric trough described in the last paragraph. A surface frontal boundary, connecting
Fig. 11. 850-hPa flow field for (a) 31 August, (b) 3, (c) 7 September 1999 at 00:00 UTC.
(a)
(b)
(c)
Fig. 12. 200-hPa flow field for (a) 31 August, (b) 3, (c) 7 September 1999 at 00:00 UTC. Darker lines are streamlines and lighter lines are
isotachs, drawn at intervals of 20 m s−1starting from 30 m s−1.
the low center with the low-pressure area over northern Ar-gentina can be drawn. To the west of the low-pressure center strong, cold advection occurs over Argentina on 8 September (figure not shown). This cold advection area over Argentina and the warm advection area over Brazil define the frontal boundary, which moves into central Brazil on 9 September (Fig. 10f). The progression of this frontal system into central Brazil is responsible for the dissipation of the WDS.
Figure 12 shows the 200-hPa flow field on the same days as in Fig. 11. One striking feature is the anticyclonic circu-lation north of 20◦S over the Amazon region and a trough downstream. This is a situation similar to the Bolivian High and the Northeast Cyclone observed during summer (Satya-murty et al., 1998), i.e. the upper tropospheric circulation in midwinter acquires summer season characteristics during the WDS. The anticyclonic vorticity north of the jetstreak over the central parts of Brazil (both shear vorticity and curvature vorticity are anticyclonic) is an indication of the anomalous warm conditions in the lower troposphere.
4.2 June 2002 WDS
Figure 13 shows the episode-mean (2–11 June 2002) anoma-lies of temperature, relative humidity, specific humidity and vertical motion for the WDS. The warm anomalies are seen mainly over Brazil centered at 20◦S, 52◦W. Except for the
northern Amazon region and the eastern coast of Northeast Brazil, the whole country is under a warm spell. The max-imum episode-mean warm anomaly is 5◦C. Compared to Case 29 the core of this WDS is shifted northward and is less intense in terms of the temperature anomaly. This case is classified as a moderate event for two reasons. One is its shorter duration compared with Case 29 and the other is that the positive temperature anomaly core is only approximately 5◦C. The relative humidity anomalies (Fig. 13b) of the order of 20% over Brazil occupy tropical and subtropical regions north of 25◦S. By examining Fig. 13c we find that, although the air was more humid than normal in southern and north-western Brazil, the anomalies over Brazil east of 60◦W and north of 20◦S are negative with magnitudes of the order of 2 g kg−1. (The negative anomalies in both humidity parame-ters over western Argentina are probably due to the incursion of a cold (polar) air mass.) Similar temperature and humid-ity characteristics are observed at 850- and 700-hPa levels (figures not shown). The vertical motion in the middle tropo-sphere (Fig. 13d) shows subsidence between 10◦S and 20◦S of the order of 8 Pa s−1. However, strong ascending motion dominates south of 20◦S over northern Argentina and south-ern Brazil. These fields indicate that, in the 10◦S–20◦S lat-itude belt, the subsidence plays an important role in raising the temperatures and drying the atmosphere in the lower tro-posphere.
(a)
(b)
(c)
(d)
Fig. 13. Same as in Fig. 5 except for Case 32 (2–11 June 2002).
The sequence of the 500-hPa geopotential and its anomaly from 29 May through 12 June 2002 (not shown) shows a strong ridge propagating slowly from 130◦W to 110◦W in the Pacific in 8 days from 29 May to 5 June. From 5 to 8 June a strong trough has formed north of 47◦S and, along with the ridge to the south, the geopotential field resembles an inverted omega blocking configuration. On 12 June the ridge moves to 90◦W. The short wave trough off Chile at 30◦S remains stationary in the eastern South Pacific till it
crosses the Andes on 10 June and moves on to the continent and later on to the Atlantic Ocean. The northward incursion of the frontal boundary associated with this trough has con-tributed for the dissipation of the WDS after 12 June.
The sea-level-pressure and its anomaly sequences (not shown) also show some blocking-like characteristics in the Pacific. In this case, a surface front remains stationary over Uruguay, Paraguay and northern Argentina from 2 through 7 June. During this period the temperatures over Brazil rise
(a)
(b)
Fig. 14. Evolution of target-area average horizontal thermal
advec-tion (full lines) and adiabatic heating (broken lines) (K day−1)at 700-hPa for (a) Case 29 and (b) Case 32.
and remain high. Between 12 and 15 June another frontal boundary moves northeastward, with the penetration of a high-pressure cell over Argentina. This progression of the frontal boundary into the subtropics of Brazil is responsible for the dissipation of the WDS, as is mentioned in the last paragraph.
The 200-hPa streamlines (not shown) show the formation of an anticyclonic circulation center over the Amazon region around 10◦S with a trough downstream over the coast of northeast Brazil. Once again the situation resembles summer circulation over the region. The anticyclone and the ridge at 200 hPa over the central parts of Brazil indicate a warm lower troposphere. Towards the end of WDS the anticyclonic cen-ter moves eastward on to northeast Brazil.
The differences are mainly seen in the intensity of the ther-mal another-maly and the horizontal extension of the warm and dry airmass. Case 32 is weaker than Case 29 and the differ-ence in intensities of the two events is well indicated by SI (Table 1). The qualitative similarity of all major character-istics of the two events described above suggests that these phenomena are not significantly influenced by the ENSO phase.
5 Diagnostics for the temperature and humidity anoma-lies and changes
Besides the diabatic heating due to the liberation of latent heat, if any, and the short- and long-wave radiation, there are basically two mechanisms by which the temperature can change from a near normal situation (prior to WDS) to a WDS situation. They are the horizontal thermal advection and adiabatic heating due to vertical motion. Similarly, in the case of the changes in specific humidity, the mechanisms are the horizontal and vertical advections of humidity, besides precipitation, if any, and evaporation. The horizontal and ver-tical advections of temperature and humidity are calculated at 850- and 700-hPa and are considered to be representative of the role played by the lower tropospheric winds and vertical motions in the changes in temperature and humidity associ-ated with WDS. The results of these calculations for the two cases of WDS presented in Sect. 4 are discussed here.
The mean fields during the five days around the first day of the WDS episode are found to be useful for explaining the evolution from pre-WDS to WDS situations. This pe-riod may be considered as the development stage of the WDS (24–28 August 1999 in Case 29 and 31 May–4 June 2002 in Case 32). It should be mentioned that the calculations of hor-izontal and vertical thermal and humidity advections made using the 1000-hPa and 925-hPa data showed many “bulls-eye” patterns, perhaps due to the effect of steep Andean to-pography and smaller magnitudes of vertical motion, and are therefore not presented.
The evolution of the target-area averages of the horizontal thermal advection and adiabatic heating due to vertical mo-tion at 700 hPa during the two WDS are plotted in Fig. 14. While both terms are generally positive on most of the days of the events and prior to the events, it is very clear from the figure that the role of subsidence was more expressive
(a)
(b)
Fig. 15. Episode-mean fields of adiabatic heating due to vertical motions (K day−1)at 700 hPa. (a) Case 29, and (b) Case 32.
compared to the horizontal advection. The dominance of the effects of subsidence over the target area is more evi-dent in the beginning of the episodes or in the development stages, 23–26 August 1999 (Case 29) and 29 May–1 June 2002 (Case 32). The episode-mean adiabatic heating due to vertical motions at 700 hPa for the two cases is shown in Fig. 15. In both cases of WDS strong warming is observed over the subtropics of Brazil, of the order of 3 to 4 K day−1, once again showing the important role played by the regional scale subsidence in the maintenance of the WDS.
Five-day average fields of vertical advection of specific humidity, −ω(∂q/∂p), during the development stage of the WDS, at 850 and 700 hPa, for Cases 29 and 32, are shown in Fig. 16. North of 30◦S the vertical advection is mostly negative, of the order of 1 g kg−1 day−1 in Case 29 and
2 g kg−1day−1in Case 32, at both levels. These results show
that the regional scale subsidence has played an important role in the drying of the lower tropospheric air during the de-velopment stage of the WDS. The wetting effect in southern Paraguay and northeastern Argentina in Case 32 was due to rising motion associated with frontal systems, which did not propagate into Brazil. Figure 17 shows the horizontal advec-tion of specific humidity in the development stage. The effect is also mostly drying over the continent.
The episode-mean fields of vertical and horizontal advec-tions of water vapor in the lower troposphere (at 850 and 700 hPa) are, respectively, shown in Figs. 18 and 19, for both cases. In general, the effects of advections by vertical motions and horizontal motions are drying in both cases of WDS. However, in the central parts of Brazil the drying due to vertical advection (i.e. due to subsidence) is larger than that due to horizontal advections.
Figure 20 shows the composite fields of horizontal and vertical advections of temperature at the 850 hPa level for the 17 strong WDSs. Once again, it can be seen that both the processes contribute to the rise of temperature in the central parts of Brazil and adjoining regions in Paraguay, Uruguay and Argentina. The importance of vertical advection, i.e. subsidence of upper tropospheric air, is of the same order or stronger than the horizontal advection.
6 Summary and conclusions
In this study, for the first time, the warm and dry episodes in the central parts of South America in the winter and post-winter months are described qualitatively and quantitatively. Although the target area considered in this study is smaller
(a)
(b)
(c)
(d)
Fig. 16. Five-day mean fields of vertical advection of humidity (g kg−1day−1)in the development stage of the WDS: (a) 700 hPa, Case 29,
(a)
(b)
(c)
(d)
(a)
(b)
(c)
(d)
Fig. 18. Episode-mean fields vertical advection of humidity (g kg−1day−1): (a) 700 hPa, Case 29, (b) 700 hPa, Case 32, (c) 850 hPa, Case 29, and (d) 850 hPa, Case 32.
(a)
(b)
(c)
(d)
(a)
(b)
Fig. 20. Composite fields of (a) horizontal thermal advection and (b) vertical thermal advection, at 850 hPa for the 17 strongest WDSs. Units
are in◦C day−1.
than the subtropical and tropical regions of South America the temperature and relative humidity anomalies averaged over the target area can be regarded as representative of the generalized dry and warm conditions over the central parts of the continent.
The warm and dry spells (WDSs) have life periods of one to two weeks and during this period the mean surface tem-perature over a wide area can be several degrees (up to 7◦C) warmer and the relative humidity up to 20% drier. The spe-cific humidity anomaly at 1000 hPa can reach −3.0 g kg−1in central Brazil in some cases of strong WDSs.
The frequency of occurrence of WDS (of the strength con-sidered in this study) is found to be about 0.8 per year during the months of JJAS and the mean duration is about 11 days. There is a large interannual variability in the occurrence of WDS. Some years presented 3 events and some years did not present any event. The number of cases of WDSs during the La Ni˜na years (12 out of 33) is less than the number during El Ni˜no years (15). The neutral years presented only 10 cases. One reason for this is that the numbers of La Ni˜na years and neutral years since 1961, as counted from the list given by NOAA (http://www.cpc.noaa.gov/products/), are less than the number of the El N˜no years. This shows that there is no apparent relation between the occurrence of WDS and
the phase of the ENSO phenomenon. This indicates that the WDS are a manifestation of the regional and synoptic scale perturbations.
A severity index of these events (SI) is defined as the sum of the area-averaged normalized positive temperature anomaly and negative relative humidity anomaly over the tar-get area shown in Fig. 1. The composites of the 17 strong WDSs in terms of SI (≥3.9) showed many interesting at-mospheric flow features that can be considered as the sig-nature of such events. The 1000-hPa temperature anomaly field presents a large positive area of several◦C over the cen-tral parts of South America, showing that the phenomenon is nearly of continental proportions. The negative relative hu-midity anomalies likewise cover a large area in central South America. A low-pressure area at the surface and a ridge at the 500-hPa level over the central parts of South America are in conformity with the temperature distribution. Large scale subsidence north of 20◦S and ascending motion south of 20◦S in the middle troposphere, along with the poleward component of winds in the lower troposphere over Bolivia, central-western Brazil and Paraguay, show that the Hadley circulation during the WDSs is either weakened or even re-versed. On the whole, the regional circulation during the WDSs in austral winter acquires summertime characteristics.
The two cases of WDS presented in Sects. 4 and 5 show many interesting synoptic- and regional-scale characteristics associated with the episodes. The midtropospheric circula-tion in the eastern South Pacific Ocean shows a slow mov-ing strong ridge south of 45◦S and a relative low-pressure area to its north, resembling a blocking-like situation. The surface pressure also shows similar features. The South At-lantic subtropical high is seen to be located closer to the con-tinent during and before the episodes. In the development stage (the five-day period around the first day of the WDS), a low-pressure area at the surface east of the Andes, with an associated frontal boundary over Uruguay, develops. This low pressure area in the central parts of the continent and the shift of the Atlantic subtropical high towards the conti-nent strengthen northerly winds over the eastern half of South America. These winds provide warm advection. The frontal boundary moves slowly, during the WDSs, over the Atlantic Ocean without affecting the central parts of Brazil.
The warm and dry air mass associated with the WDS is fairly deep, occupying the lower troposphere from the sur-face up to 700 hPa. During the episode and, especially, in the development stage of the WDS, widespread subsidence in the middle and lower troposphere is observed over tropi-cal and subtropitropi-cal Brazil north of 22◦S, which causes dry-ing and warmdry-ing of the lower tropospheric air. The drydry-ing values are of the order of 1 g kg−1day−1 and the adiabatic warming is 2–4◦C day−1over the central parts of Brazil in the development stage. The causes of the subsidence are not investigated in this study. A study of the east-west and north-south (Walker type and Hadley type) circulations in the verti-cal plane over the global tropiverti-cal and subtropiverti-cal belts during and before the WDS episodes is necessary in order to under-stand the reasons for the subsidence.
The effects of subsidence on the warming and drying of the lower tropospheric air over the central parts of Brazil (over the target area) are more pronounced than the effects of horizontal advections, especially in the development stage of the WDS. The study of both the humidity parameters, spe-cific humidity (q) and relative humidity (r), is necessary for understanding the WDS, because the water stress on the veg-etation depends mostly on r and the drying effect of the sub-sidence is seen in the q field.
Towards the end of the WDS a mid-tropospheric trough intensification and movement over the continent supports the formation of a new cold frontal boundary. This front pene-trates into central Brazil, bringing cold advection in its wake, causing the dissipation of the anomalous situation.
Table 1 provides information for future verification of the impacts of WDS on socioeconomic problems, such as atmo-spheric pollution, human discomfort, respiratory ailments, scarcity of water resources and scarcity of hydroelectric en-ergy in the central parts of the continent. Such studies are beyond the scope of the present investigation.
Acknowledgements. The authors wish to thank the anonymous
re-viewers for their valuable comments and suggestions.
Topical Editor F. D’Andrea thanks two referees for their help in evaluating this paper.
References
Assad, E. D., Sano, E. E., Matsumoto, R., Castro, L. H., and Silva, F. A. M.: Veranicos na regi˜ao dos Cerrados Brasileiros: Freq¨uˆencia e probabilidade de ocorrˆencia (Little summers in the Brazilian Cerrado region: Frequency and probability of occur-rence.), Pesquisa Agropecu´aria Brasileira, 28, 993–1003, 1993. Braga, A. L. F., Conceic¸˜ao, G. M. S., and Pereira, L. A. A.: Air
pol-lution and pediatric respiratory hospital admissions in S˜ao Paulo, J. Environ. Med., 1, 95–102, 2000.
DNMET: Normais Climatol´ogicas (1961–1990), (Climatological Normals, 1961–1990.) Servic¸o de produc¸˜ao de Informac¸˜ao – SPI/EMBRAPA, Bras´ılia, available from Instituto Nacional de Meteorologia, Bras´ılia, DF, Brazil, 84 pp, 1992.
Figueroa, S. N.: Estudo dos sistemas de circulac¸˜ao de ver˜ao sobre Am´erica do Sul e suas simulac¸˜oes com modelos num´ericos, PhD Thesis, INPE, S˜ao Jos´e dos Campos, Brazil, 181 pp, 1997. Lejenas, H.: Characteristics of Southern Hemisphere blocking as
determined from long time series of observational data, Quart. J. Roy. Meteorol. Soc., 110, 967–979, 1984.
Satyamurty, P., Nobre, C. A., and Silva Dias, P. L.: South America: Tropics, in: Meteorology of the Southern Hemisphere, American Meteorological Society, 119–139, 1998.