Experimental Evidence from Kenya
The MIT Faculty has made this article openly available.
Please share
how this access benefits you. Your story matters.
Citation
Duflo, Esther, Pascaline Dupas, and Michael Kremer. “ Education,
HIV, and Early Fertility: Experimental Evidence from Kenya † .”
American Economic Review 105, no. 9 (September 2015): 2757–
2797. ©2016 American Economic Association.
As Published
http://dx.doi.org/10.1257/aer.20121607
Publisher
American Economic Association (AEA)
Version
Final published version
Citable link
http://hdl.handle.net/1721.1/104032
Terms of Use
Article is made available in accordance with the publisher's
policy and may be subject to US copyright law. Please refer to the
publisher's site for terms of use.
2757
Education, HIV, and Early Fertility:
Experimental Evidence from Kenya
†By Esther Duflo, Pascaline Dupas, and Michael Kremer*
A seven-year randomized evaluation suggests education subsidies reduce adolescent girls’ dropout, pregnancy, and marriage but not
sexually transmitted infection (STI). The government’s HIV curricu-lum, which stresses abstinence until marriage, does not reduce
preg-nancy or STI. Both programs combined reduce STI more, but cut
dropout and pregnancy less, than education subsidies alone. These
results are inconsistent with a model of schooling and sexual behav-ior in which both pregnancy and STI are determined by one factor
(unprotected sex), but consistent with a two-factor model in which
choices between committed and casual relationships also affect these outcomes. (JEL I12, I18, I21, J13, J16, O15)
Early fertility and sexually transmitted infections (STIs), chief among them HIV, are arguably the two biggest health risks facing teenage girls in sub-Saharan Africa.1
Since unprotected sex can lead to both early pregnancy and STIs, a natural assump-tion is that any policy that reduces unprotected sex will be effective at fighting both. However, policies which affect the choice between having a committed relation-ship with a single partner and having multiple casual partners may differentially affect teen pregnancy and STIs. Pregnancy may be relatively more likely in commit-ted relationships while STIs may be relatively more likely in casual relationships.
1 Pregnancy in adolescence is associated with greater risks for the mother as well as the child, including
prema-ture delivery (Trussell and Pebley 1984). While part of this association reflects the greater prevalence of teenage pregnancy among the socially and economically disadvantaged, there is a clear direct causal impact of biological immaturity (Fraser, Brockert, and Ward 1995).
* Duflo: Department of Economics, MIT, 50 Memorial Drive, Building E52, Room 252G, Cambridge, MA 02142 (e-mail: eduflo@mit.edu); Dupas: Department of Economics, Stanford University, 579 Serra Mall, Stanford, CA 94306 (e-mail: pdupas@stanford.edu); Kremer: Department of Economics, Harvard University, Littauer Center, 1805 Cambridge Street, Cambridge, MA 02138 (e-mail: mkremer@fas.harvard.edu). We are extremely grateful to Abhijit Banerjee for his essential inputs on the model, and to Prof. Samuel Sinei and Dr. Vandana Sharma for their medical expertise and invaluable support. We thank the Kenya Ministry of Education, the Kenya Institute of Education, ICS Africa, and IPA Kenya for their collaboration, and Carolyne Nekesa, Grace Makana, and their field team for their dedication and scrupulous care collecting the data. We thank two anonymous referees, Frank Schilbach, Rachael Meager, and numerous seminar participants for helpful comments; and to Abdulla Al-Sabah, Jeff Guo, Rachael Meager, Santiago Saavedra, and Zhaoning Wang for outstanding research assistance. We are also grateful to a long list of outstanding field research assistants. We list them in chronological order: Jessica Leino, Jessica Morgan, Owen Ozier, Ian Tomb, Paul Wang, Willa Friedman, Anuja Singh, Jinu Koola, Jessica Leight, Bastien Michel, Sara Hernandez, and Thomas Ginn. The funding for this study was provided by (in alphabetical order): the Hewlett Foundation, the MacArthur Foundation, the NIH, the Nike Foundation, the Partnership for Child Development, and the World Bank. We thank them, without implicating them, for making this study possible. We have no relevant or material financial interests that relate to the research described in this paper.
† Go to http://dx.doi.org/10.1257/aer.20121607 to visit the article page for additional materials and author
We argue that taking this distinction into account is essential to understanding the impact of different policies on teen pregnancy and STIs.
This paper provides evidence on how STI prevalence and teen pregnancy are affected by two leading policy instruments (and their interaction): education sub-sidies and HIV prevention education focused on abstinence until marriage. In con-junction with the Kenya Ministry of Education, the Kenya National AIDS Control Council, and the nonprofit ICS Africa, we conducted a large randomized evalua-tion involving 328 schools in Western Kenya to compare the effectiveness of two programs conducted stand-alone or jointly: (i) the Education Subsidy program, which subsidized the cost of education for upper primary school students by pro-viding two free school uniforms over the last three years of primary school; and (ii) the HIV Education program in which three teachers in each primary school received government-provided training to help them deliver Kenya’s national HIV/AIDS curriculum, which, like many other curricula in Africa and some US states, emphasizes abstinence until marriage as the way to prevent infection. We also estimate the impact of the HIV education program augmented with a small add-on component explicitly stressing condoms within the boundaries of the cur-riculum. We assess the short-, medium-, and long-term impacts of these two pro-grams, implemented alone or jointly, on sexual behavior, fertility, and infection with HIV and another STI, Herpes simplex virus type 2 (HSV2), using a panel dataset that covers a cohort of around 9,500 girls and 9,800 boys over 7 years. For both HIV and HSV2, a positive test result at a point in time reflects having ever been infected with the disease.
The study involved 328 schools in Kenya’s Western Province. All students enrolled in sixth grade in 2003 were sampled for the study and followed for 7 years, from age 13.5 to 20.5 on average. Follow-up rates were very high. After 7 years, 54 percent of the sample could be interviewed and almost all of them agreed to be tested for HIV and HSV2. A random subsample of 29 percent of the remainder was then selected for intensive tracking, and 81 percent of them could be found and sur-veyed, for an effective follow-up rate at endline of 91 percent. The resulting dataset is unique due to the combination of its size, the length of the panel, the successful tracking rate, the availability of biomarkers for HSV2 and HIV, and the randomized 2-by-2 design. HIV prevalence was extremely low in the sample, so we focus on HSV2 as our measure of exposure to STIs. Fertility is much less easily observable for boys, so we focus on girls for the fertility results.
We find a nuanced set of results:
(i) When implemented alone, the education subsidy program significantly reduced primary school dropouts for both boys and girls and delayed the onset of girls’ fertility. Specifically, the program reduced the dropout rate after 3 years from 19 percent to 16 percent for girls and from 13 percent to 10 percent for boys, and the girls’ teen pregnancy rate fell from 16 percent to 13 percent within that time period. This reduction came entirely through a reduction in the number of pregnancies within marriage, and there was no change in the out-of-wedlock pregnancy rate. By year 7, there was still a 7 percent gap in the childbearing rate between girls exposed to the edu-cation subsidy program and those in the control group (46 percent versus
49 percent). However, the education subsidy alone did not reduce the HSV2 infection rate among either girls or boys.
(ii) The HIV education program implemented alone did not significantly reduce teenage pregnancy, the risk of HSV2 infection, or schooling attainment among either boys or girls. For girls, the program led to more early preg-nancies within marriage and fewer early pregpreg-nancies outside of wedlock, however.
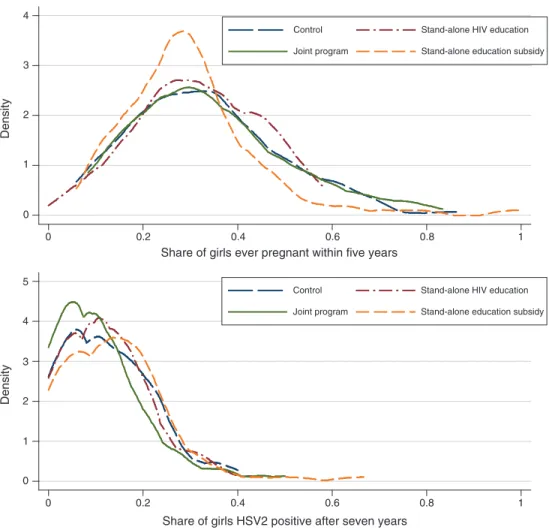
(iii) When the two programs were implemented jointly, fertility fell less than when the education subsidy was provided alone, but HSV2 infections fell more (and significantly). Girls who received the combined program were 20 percent less likely to be infected with HSV2 after 7 years (a drop from 11.8 percent to 9.5 percent). There was no significant impact on the HSV2 infection rate among boys.
(iv) Finally, the add-on component to the education program that specifically introduced a discussion on condoms led to greater knowledge of condoms but no change in reported use, and did not significantly change results (ii) and (iii) above.
The results for girls are surprising because the STI and teenage pregnancy results are not aligned. The only program that reduced STI prevalence (the joint program) is not the program that had the largest impact on pregnancy (the stand-alone educa-tion subsidy). The joint program had a smaller effect on girls’ teenage pregnancies than the stand-alone education subsidy, but a larger effect on HSV2 prevalence. We argue that this result is not compatible with a simple one-factor model in which the level of unprotected sex jointly determines both pregnancy and STI rates.
These results are, however, consistent with a richer model of sexual behavior with three features which are realistic in our context. First, teenage girls choose not only a level of unprotected sex, but also choose between “committed” partnerships (in which girls have a single partner whom they believe is also committed to them, and will marry them in the event of a pregnancy), and casual sex, in which there is no expectation of marriage. The costs of pregnancy are perceived to be lower in committed than in casual relationships. Second, schooling and pregnancy are incompatible. This is a reasonable feature since, in many settings, including ours, pregnant girls historically have been expelled from school and the practice contin-ues de facto if not de jure.2 This makes the opportunity cost of pregnancy higher
for girls who want to and are financially able to go to school than for girls who (or whose parents) have already chosen not to invest in schooling. The third feature is that girls perceive STI risk to be higher in casual than committed relationships, and the government’s HIV/AIDS education program focused on abstinence until mar-riage strengthens this perception. Since the cost of pregnancy and the risk of STIs
2 See Baird, McIntosh, and Özler (2011) for evidence that marriage/fertility and schooling are mutually
are lower in committed relationships, in the model girls have more unprotected sex in committed relationships than in casual relationships.
While we do not present a formal test of the model, we show that it generates a series of comparative statics consistent with the data. First, education subsidies lead girls to have less unprotected sex (to avoid pregnancy), conditional on choosing either committed or casual relationships, but can also lead some girls to switch to casual relationships, since committed relationships entail a higher risk of becoming pregnant and having to leave school. Thus, education subsidies reduce teenage preg-nancy, but they may not reduce STIs if casual relationships indeed carry greater STI risk and if unprotected sex is relatively inelastic to STI risk for a substantial fraction of girls. This seems plausible in our context, since just over one-third of sexually active unmarried 15–19-year-old girls in Kenya had ever used a male condom as of 2008/2009 (Kenya National Bureau of Statistics (KNBS) and ICF Macro 2010).
Second, when the perceived STI risk from casual relationships increases, as with the abstinence until marriage message of Kenya’s national HIV prevention curriculum, unprotected sex within casual relationships decreases. But a change in perceived STI risk from casual sex also causes some girls to shift from casual to committed relationships. Since unprotected sex is more frequent within committed relationships than casual ones, the overall effect on teenage pregnancies and STIs is ambiguous, but the share of teenage pregnancies that are out-of-wedlock unambig-uously decreases (and this is indeed the only significant impact we observe for the stand-alone HIV education program).
Finally, when both programs are implemented jointly, girls have greater incentive to avoid pregnancy so they can take advantage of cheaper education, but they also think that casual relationships carry higher STI risk. As a result, the joint program may have qualitatively different effects than would be suggested by a reduced-form analysis of the two programs considered individually. In particular, for appropriate parameter values, the joint program will reduce unprotected sex within each type of relationship, but without causing the switches between relationship types generated by either program in isolation. A joint program may thus reduce STI risk, even if neither program does so in isolation. However it will lead to a smaller drop in preg-nancy and a smaller increase in education than an education subsidy program alone. While the quantitative predictions depend on specific parameters, we show that the set of results we observe can indeed be obtained. This does not rule out other mul-tifactor models and we discuss alternative interpretations as we discuss the model. The main take-away, though, is that we are able to rule out a single-factor model.
The model suggests that certain institutions and features common in much of Africa may influence the results. In particular, results might differ if pregnant girls did not have to leave school, or if the elasticity of unprotected sex to perceived risk was higher, for example due to more widespread acceptance of condoms. HIV curricula in African schools typically emphasize abstinence until marriage, but one could imagine alternative programs designed to increase condom acceptability.
The paper contributes to three distinct strands of literature. First, we contribute to the literature on the link between education and fertility. In developing coun-tries, studies have generally found a strong causal relationship between increases in education and reduced fertility (see, for example, Breierova and Duflo 2004 in Indonesia; Osilii and Long 2008 in Nigeria; Ozier 2011 in Kenya; Keats 2014 in
Uganda; and Lavy and Zablotsky 2011 on Israeli-Arab women).3 Our finding that
girls at the margin of dropping out of school in Kenya are able to delay pregnancy when the cost of education is reduced suggests that, for that age group, fertility and schooling decisions are often jointly made. This is consistent with recent evidence from India presented in Jensen (2012), which finds that an increase in young wom-en’s perceived returns to education increased educational attainment and reduced marriage and fertility.
Second, we contribute to the literature on prevention of sexually transmitted infections among African girls. It is sometimes feared that involuntary sex is so common that education or incentive programs focusing on girls will have no impact on STIs. Yet, there are surprisingly few rigorous studies with objective biomarker outcome data on this issue (for a review, see McCoy, Kangwende, and Padian 2010). An important exception is in Malawi, in which monthly cash transfers to the fami-lies of out-of-school girls significantly reduced HIV infection rates after 18 months (Baird et al. 2012). Another exception is a community trial in rural Tanzania, which found that a comprehensive adolescent sexual health program (which combined in-school sexual health education with community-based condom promotion and distribution) significantly affected HIV knowledge and attitudes, but did not consis-tently reduce STIs (including HIV) in either the short- or the long-run (Ross et al. 2007; Doyle et al. 2010). With 20 communities, the study may have lacked power, however. Dupas (2011), in the same setting as ours, shows that informing girls that cross-generational relationships are particularly risky is more effective in reducing early pregnancies than Kenya’s official abstinence-until-marriage message curricu-lum, but does not have STI data.
Third, we contribute to the literature on the link between education and STI risk. Evidence from both developed countries (see Cutler and Lleras-Muney 2010, for a review) and developing countries (Thomas, Strauss, and Henriques 1991) sug-gest that greater educational attainment reduces unprotected sex. Existing evidence on the relationship between educational attainment and HIV status in sub-Saharan Africa is mixed, however.4 In the Kenyan context, we find that for girls at the margin
of dropping out of school, the increase in educational attainment brought about by the education subsidy was not sufficient, by itself, to reduce exposure to STIs—at least over the first seven years.
The remainder of the paper proceeds as follows. Section I provides some back-ground on the context and the study design. Section II describes the data. We
3 In developed countries the evidence is more mixed. Currie and Moretti (2003); Black, Devereux, and Salvanes
(2008); and Monstad, Propper, and Salvanes (2008) all find strong impacts, while McCrary and Royer (2011), using cutoff for age at school entry, does not. But as Conti et al. (forthcoming) shows, the difference may come from the fact that different studies estimate different parameters and for different subpopulations: McCrary and Royer (2011) exploits an extra year of education that takes place in early childhood, while the other studies, like ours, estimate the effect of being in school as a teenager or young woman.
4 Using nationally representative Demographic and Health Surveys Program (DHS) surveys, Fortson (2008)
finds evidence that education is positively correlated with HIV infection. De Walque (2007) finds that, in Uganda, the more educated were more likely to change their behavior in response to the national HIV risk information campaign than those with less education. Iorio and Santaeulália-Llopis (2011) uses DHS data from 18 countries to test whether the relationship between education and HIV status varies as the HIV epidemic progresses, and find evi-dence of nonstationarity, with the relationship being positive at both the early and very late stages of the epidemic, and negative at intermediate stages. Outside of the HIV literature, Jensen and Lleras-Muney (2012) finds that a randomized intervention that increased schooling among men in the Dominican Republic reduced risky behavior (such as heavy drinking and smoking), mainly by changing subjects’ resources and peers.
discuss the short- and medium-run results in Section III, and the long-run results in Section IV. Section V presents a model of sexual behavior and schooling decisions that can account for the findings. Section VI concludes.
I. Background: Context and Study Design
A. Background
Education.—Though Kenya abolished school fees in 2003, primary education still entails other expenditures. All children in Kenyan schools wear uniforms, and at around $6 (or 1.6 percent of per-capita gross domestic product) in 2003, uni-forms constitute by far the largest out-of-pocket cost of education in government primary schools. Historically, headmasters often sent children home telling them that they could only return when they had a uniform. With the introduction of free primary education, the Ministry of Education announced that this practice should not continue, but de facto, students face strong social pressure to wear a uniform and most do. The provision of free uniforms has been shown to reduce absenteeism in younger grades (Evans, Kremer, and Ngatia 2009).
Since grade repetition and late school entry are common, many students are 15 years old, 16 years old, or even older by the time they reach the end of primary school in eighth grade, and many pupils in upper grades are sexually active. While enrollment in the early grades of primary school is nearly universal, many students leave school before completing eighth grade, especially girls. In the comparison schools in our sample, about 30 percent of girls and 21 percent of boys who reach sixth grade drop out before completing eighth grade.
Sexual Norms.—Primary school children in Kenya are not supposed to be sexually active. Girls who become pregnant typically have to leave school. Conversely, once a girl leaves school, sex and marriage are expected. Traditional marriage involves a brideprice, but most couples in our sample “elope” without a brideprice payment and without a marriage ceremony. Indeed for teenage girls who are not in school there is little stigma to premarital sex and pregnancy that quickly leads to marriage, and marriage is potentially more attractive than staying at the parental home, where teenage girls bear a large share of household chores. Couples are considered married if they are living together, and we use that definition in this paper.
Some scholars argue that condoms are seen as something one uses with casual partners, not committed partners, and therefore part of the meaning of not using a condom is that one is in a trusted, committed relationship (Mash, Mash, and De Villiers 2010). Condom use within marriage remains limited, with only 1.8 percent of married women reporting using condoms in the latest nationally representative Kenya Demographic and Health Survey (KNBS and ICF Macro 2010). Condom use among sexually active unmarried women was 18 percent.
School-Based HIV Education.—The Kenyan government established a national HIV/AIDS curriculum for primary school with the assistance of UNICEF. Following the UNICEF-backed model, the planning process was based on exten-sive consultation within Kenyan civil society. Kenya is a religious society, and the
Catholic church, various protestant denominations, including very active evangelical groups, and Muslim organizations are the most organized and politically influential civil-society stakeholders on this issue. These religious groups favored prevention messages focusing on abstinence until marriage. The resulting curriculum teaches the biology of AIDS and HIV transmission, care for people living with AIDS, and prevention. The prevention component stresses abstinence until marriage, followed by faithfulness in marriage as the most effective way to prevent sexually trans-mitted infections, and teaches skills such as saying no and resisting peer pressure. The official textbook does not mention condoms or contraception. Condoms can be discussed in class at the teacher’s discretion or in response to questions, but the teachers’ handbook only mentions condoms as a prevention strategy for mar-ried individuals. This type of curriculum is far from unique to Kenya: the UNICEF model Kenya followed is a standard one, and the underlying strength of religious organizations is also common. Curricula stressing abstinence until marriage are the norm in many African countries, and in much of the United States as well.
In our detailed review of the teaching-learning material, we identified a single (narrow) window of opportunity to discuss condoms, however: the teachers’ hand-book proposes to organize a debate on whether condoms should be discussed in class. As discussed below we took advantage of this opportunity to explicitly control the degree to which condoms were mentioned in some schools.
B. Study Design
We study two programs implemented through a partnership between the non-gov-ernmental organization ICS Africa, the Kenyan Ministry of Education, the Kenya Institute of Education, and the Kenya National AIDS Control Council. The first program reduced the cost of education by providing free school uniforms. The sec-ond program trained teachers on how to deliver the national HIV/AIDS prevention curriculum to upper primary school students. We also evaluate a small add-on com-ponent to the government-run teacher training designed to foster the discussion of condoms, in order to check whether an explicit discussion of condoms in a curricu-lum otherwise focused on abstinence and fidelity could affect behavior.
Sample and Randomization.—The study took place in all 328 public
pri-mary schools in 7 divisions of 2 districts of Western Kenya: Butere-Mumias and Bungoma.5 None of these schools had participated in any prior
random-ized evaluation that we know of. All schools agreed to participate. Schools were stratified and assigned to one of four arms using a random number generator: (i) Control (82 schools); (ii) Stand-alone education subsidy program (83 schools); (iii) Stand-alone HIV education program (83 schools); (iv) Joint program (80 schools).6
5 We use the 2003 district names and boundaries, although redistricting has taken place since then.
6 Block randomization (stratification) was used. The following variables were used to create the strata:
admin-istrative zone, the quartile in which the school performance fell in the 2002 national examination, and whether the school’s gender ratio among upper primary pupils was above or below the median in 2002. Seventy-six of the 82 strata had exactly four schools in them, and in those strata schools were randomly assigned to experimental arms using a random number generator. In the three strata with three schools, the experimental arm that was dropped
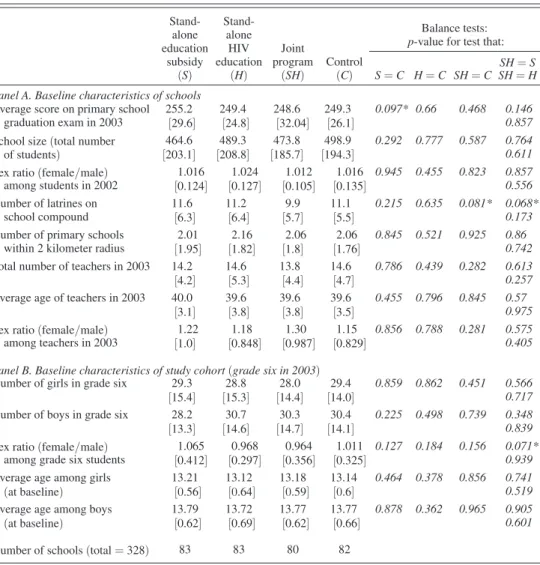
Table 1 presents school-level summary statistics by treatment group. Differences across treatment groups are small in magnitude, and only 4 of 65 p-values estimated are smaller than 0.10, suggesting that the randomization was effective at creating balance between the groups.
Education Subsidy.—Between February and July 2003, ICS distributed free school uniforms to boys and girls enrolled in sixth grade at the onset of the school year (January).7 In fall 2004, ICS distributed a second uniform to the same students,
if they were still enrolled in the same school (regardless of their grade). It was
was randomized. Likewise, in the three strata with five schools, the experimental arm that was included twice was randomized.
7 Baseline enrollment was collected from all schools before announcing the education subsidy program, and
only those on the original baseline enrollment list were eligible for free uniforms. Transfers across treatment groups were negligible.
Table 1—Baseline Characteristics, by Treatment Group Stand-alone education subsidy (S) Stand-alone HIV education (H) Joint program (SH) Control (C) Balance tests: p-value for test that:
SH= S S= C H = C SH = C SH = H Panel A. Baseline characteristics of schools
Average score on primary school 255.2 249.4 248.6 249.3 0.097* 0.66 0.468 0.146
graduation exam in 2003 [29.6] [24.8] [32.04] [26.1] 0.857
School size (total number 464.6 489.3 473.8 498.9 0.292 0.777 0.587 0.764
of students) [203.1] [208.8] [185.7] [194.3] 0.611
Sex ratio (female/male) 1.016 1.024 1.012 1.016 0.945 0.455 0.823 0.857
among students in 2002 [0.124] [0.127] [0.105] [0.135] 0.556
Number of latrines on 11.6 11.2 9.9 11.1 0.215 0.635 0.081* 0.068*
school compound [6.3] [6.4] [5.7] [5.5] 0.173
Number of primary schools 2.01 2.16 2.06 2.06 0.845 0.521 0.925 0.86
within 2 kilometer radius [1.95] [1.82] [1.8] [1.76] 0.742
Total number of teachers in 2003 14.2 14.6 13.8 14.6 0.786 0.439 0.282 0.613
[4.2] [5.3] [4.4] [4.7] 0.257
Average age of teachers in 2003 40.0 39.6 39.6 39.6 0.455 0.796 0.845 0.57
[3.1] [3.8] [3.8] [3.5] 0.975
Sex ratio (female/male) 1.22 1.18 1.30 1.15 0.856 0.788 0.281 0.575
among teachers in 2003 [1.0] [0.848] [0.987] [0.829] 0.405
Panel B. Baseline characteristics of study cohort(grade six in 2003)
Number of girls in grade six 29.3 28.8 28.0 29.4 0.859 0.862 0.451 0.566
[15.4] [15.3] [14.4] [14.0] 0.717
Number of boys in grade six 28.2 30.7 30.3 30.4 0.225 0.498 0.739 0.348
[13.3] [14.6] [14.7] [14.1] 0.839
Sex ratio (female/male) 1.065 0.968 0.964 1.011 0.127 0.184 0.156 0.071*
among grade six students [0.412] [0.297] [0.356] [0.325] 0.939
Average age among girls 13.21 13.12 13.18 13.14 0.464 0.378 0.856 0.741
(at baseline) [0.56] [0.64] [0.59] [0.6] 0.519
Average age among boys 13.79 13.72 13.77 13.77 0.878 0.362 0.965 0.905
(at baseline) [0.62] [0.69] [0.62] [0.66] 0.601
Number of schools (total = 328) 83 83 80 82
Notes: School averages. Standard deviations in brackets. p-values in italics. * Significant at the 10 percent level.
announced at the onset of the program that students still enrolled in the same school would be eligible for a second uniform after 18 months.8 The total education
sub-sidy, delivered over two years, amounted to just around $12 per student, or 2.5 per-cent of average annual household income in the study area at the time.9 Given these
magnitudes the income effect created by the education subsidy was likely negligi-ble, and we expect the subsidy to mostly affect the demand for education and fertil-ity through a price effect.
HIV Education.—In 2002 the Kenya government started a large-scale effort to train teachers on HIV education, based in part on data suggesting that in the absence of training, many teachers were uncomfortable teaching the official HIV/AIDS cur-riculum. In 2003, ICS Africa helped implement the national training program for 184 primary schools by providing logistical and financial support. The 184 schools selected for the HIV Education program were asked to send three upper primary teachers to participate in a five-day training program.10
The training sessions were conducted jointly by one facilitator from the AIDS Control Unit of the Ministry of Education (MoE), two facilitators from the Kenya Institute of Education (KIE), and one trained staff member from ICS Africa. Teacher training included basic facts on HIV/AIDS, a condom demonstration, information on voluntary counseling and testing, and HIV/AIDS education meth-odology. Because training was primarily done by MoE and KIE staff and was based on the officially approved curriculum, the content should be similar to that delivered in other parts of Kenya. At the same time, since the sessions were facilitated and observed by ICS Africa and members of the research team, we do know they were well run and teacher attendance was good. In addition to receiving training on how to deliver HIV information in the classroom, teachers were advised to set up health clubs to deliver HIV information outside of the classroom. A year after the training, 86 percent of the schools in the program had established health clubs.11
Since the curriculum leaves almost no space for teachers to provide informa-tion about condoms, we were interested in testing whether exploiting the existing window to the maximum extent possible would affect the impact of teacher train-ing on student knowledge and behavior. This is important for policy, since only an intervention taking place within the existing curriculum could be potentially scaled up (if effective) without major rethinking. From the perspective of understanding adolescent behavior, it was also important to try to generate exogenous variation in awareness of condoms (a potential way to protect oneself against both STI and pregnancy) without affecting access to condoms. Thus, during the school year 2005, two years after the implementation of the education subsidy and HIV education
8 It was not logistically feasible to find students who transferred schools and provide them with a uniform. 9 Duflo, Kremer, and Robinson (2011) estimates that households in the study area produce around $100 per
year on their farm (net of costs) and earn $31 monthly from other sources, bringing average annual income to just below $500.
10 Since schools have 14 teachers on average, the training program covered around 21 percent of teachers in
program schools. Schools were encouraged to send at least one female teacher to the training; headmasters were encouraged to attend themselves or to send their deputy. Compliance with the training was high, with 93 percent of training slots filled.
11 Other study area schools did not receive training during the time sample students were in school, and as far
teacher training, a random subset of schools that had participated in the teacher training were sampled for an additional intervention called “critical thinking” (CT). This add-on was targeted at students in seventh and eighth grades in 2005 (many of whom, given the high repetition rate, were in sixth grade in 2003, i.e., in our study cohort). Schools sampled for CT were encouraged to organize a debate on the motion, “School children should be taught how to use condoms,” a motion sug-gested in the official Facilitators’ Handbook (KIE 1999, p. 66). The debate was followed by an essay competition on the theme: “Discuss ways in which you can protect yourself from HIV infection now and at later ages in your life.”12 Both
debates and essay writing are established practices in Kenyan schools, and teachers agreed to organize these activities in 95 percent of sampled schools. At the time, none of these schools had previously organized a debate or essay competition on these specific topics, which suggests that these topics were most likely never dis-cussed in non-CT schools, and thus the CT encouragement appears to have created the intended exogenous gap in students exposure.
II. Data and Estimation Strategy
A. The Data
The sample consists of 19,289 students (9,487 girls and 9,802 boys) enrolled in sixth grade at the onset of the study (2003). Short- and medium-run data on school enrollment, attendance, marital status, and childbearing status was collected through regular school visits between 2003 and 2007. A rich array of longer-run data was collected through a follow-up survey with study participants in 2009–2010.
Short- and Medium-Run Outcomes: “Roll Call” Data.—Seven unannounced
school visits were conducted over five years. At each visit, the list of all those in our baseline sample was read aloud to upper-grade students present at the time of the visit, and for each name on the list, attendance was recorded, and for absent students, the following questions were asked: Is X still in school? If yes, in what grade? If no, does she still live in the area? Is she married? Does she have any children? If so, how many? How old is her first born? Is she currently pregnant? We use this roll call data to create dummy variables for “dropout,” “ever married,” “ever pregnant,” etc.
To check whether this roll call method generates accurate data on childbearing and marital outcomes, a random subsample of 1,420 girls were visited at home in 2006 for a quality control exercise. Girls reported as having started childbearing were oversampled. Information was collected from the subject in 44 percent of cases and in other cases it was collected from a relative, typically the mother. Table A1 in the online Appendix presents the rates of consistency between the roll call data and the data collected through the quality control exercise, as well as how these rates vary across treatment groups. Since there was up to a four-month gap between the roll call and the home visit data, the home visit data is itself not 100 percent
12 The essays were graded by staff members of ICS Africa. In each school, a school bag was given as a prize for
the best essays by a boy and by a girl in each of seventh and eighth grades. Prizes were handed out in public, and the best essay from across all CT schools was read aloud during each school’s prize-giving ceremony.
accurate, and therefore the consistency between the two would not be 100 percent even if the roll call data were perfect. Given this, the level of consistency appears high. Eighty-three percent of those who were reported as not having started child-bearing had indeed not started, and 79 percent of those who were reported as having started childbearing by their former schoolmates had indeed started childbearing. The longer the time between the roll call and the home visit, the lower the consis-tency rate, unsurprisingly. The consisconsis-tency level is greater when we look at the “ever had a child” outcome (rather than ever started childbearing, which includes current pregnancies). Overall, the roll call method appears to provide remarkably accurate information (if we take the information obtained through home visits as “true”). Importantly, the level of consistency between the two sources does not appear to vary across groups.
Long-Run Outcomes: The Long-Run Biomarkers Follow-Up Survey.—In 2009–
2010, on average seven years after the two programs had taken place, a long-run fol-low-up was conducted, including measurement of two biomarkers: HIV and herpes simplex virus type 2 (HSV2). Herpes is almost exclusively sexually transmitted and is a serious disease in its own right. What’s more, herpes can create lesions which can facilitate HIV transmission (Grosskurth et al. 1995; Corey et al. 2004). Oster (2005) estimates that high prevalence of STIs such as herpes is a major contribu-tor to the HIV/AIDS epidemic in sub-Saharan Africa. Herpes leads to the lifelong presence in the blood of antibodies against HSV2, thereby providing a permanent marker of having ever been infected with HSV2, and thus an objective proxy for relatively risky sexual behavior in the past (Obasi et al. 1999). HSV2 was selected as the primary biomarker because a preliminary study we conducted with a similarly aged cohort found HSV2 prevalence to be greater than 10 percent, but prevalence of other sexually transmitted infections was much lower (chlamydia, gonorrhea, trichomonas vaginalis, and HIV were all less than 5 percent).
The long-run follow-up survey was administered either at a local meeting loca-tion to which the respondent had been invited, or at the respondent’s home if she had not come to the meeting point. The survey included questions on sexual behav-ior, past and current sexual partners, marriage, and fertility, as well as educational attainment. One-half of the study participants had been preselected randomly to be offered voluntary counseling and HIV testing (VCT). VCT was done at the end of the survey by the surveyors, who were all government-certified VCT counselors. Finally, at the end of the follow-up survey, all respondents were directed to a mobile clinic for HSV2 testing. (Those surveyed at home were given a voucher for a free HSV2 test to be performed at the mobile clinic.)
Conditional on being successfully tracked for the follow-up survey, compliance with HSV2 testing was remarkably high, at 96 percent on average, and comparable across groups. Compliance with VCT was also very high: 87 percent of girls and 88 percent of boys surveyed agreed to receive VCT, and this was not differential across groups.
The long-run follow-up survey started in March 2009. By August 2010, 10,651 youths (55 percent of the study cohort) had been tracked. This is a rela-tively high rate given the challenges in locating members of a mobile population of school-leavers, many of whom had married outside their initial villages. Of these,
97.5 percent had been interviewed, 2 percent had been identified as dead, and less than 1 percent had refused to be interviewed or were deemed mentally unfit for the interview.13
In August 2010, 29 percent of the 8,638 respondents who had not been tracked yet were randomly sampled for intensive tracking.14 Between September 2010 and
March 2011, teams of field officers and lab technicians traveled to various locations in Kenya and Uganda to interview selected respondents at their current homes. Of those sampled for intensive tracking, 77.5 percent of girls and 84 percent of boys were successfully surveyed. This brings the effective tracking rate (in the terminol-ogy of Orr et al. 2003 and Baird et al. 2011) to 0.51 + 0.49 × 0.775 = 89 percent for girls, and 0.59 + 0.41 × 0.84 = 93 percent for boys.15
B. Attrition
Table A2 in the online Appendix shows attrition in the roll call data on school par-ticipation, marriage, and fertility after three and five years. There is no evidence of differential attrition for any outcome, except for dropout information after five years.
Table A3 shows attrition in the long-term (7-year) follow-up data. Survey rates during the first phase of tracking (the regular tracking, or RT, phase) were signifi-cantly higher in the treatment groups than in the control group, especially among girls (column 2). Column 3 presents estimates of the survey rates, showing that intensive tracking (IT) rates were insignificantly greater among those exposed to either program than among the control group, and significantly greater under the joint program than in the control group. All in all, the sample that could be followed up after seven years over-represents those that received the education subsidy only or the joint program (column 4). Incorporating sampling weights (column 5) does not solve this problem fully for girls in the joint program arm, since the intensive track-ing rate was higher in that arm.16 Finally, there is a 25–30 day difference between
the average survey date for the control group and the average survey date for the three treatment groups, but no difference across treatment groups (column 9). Given that the daily incidence of HSV2, pregnancy and other outcomes is very low, this difference, while significant statistically, is negligible in magnitude.
13 The follow-up rate was higher among boys (59 percent) than girls (51 percent), due to a combination of
fac-tors. First, because the society is patrilocal, boys were more likely to still live at home with their parents, and thus easier to find. Second, conditional on having moved to another location within the study area, boys were easier to find than girls. This is because girls are less likely to stay in touch with their parents or guardians once they have moved, especially if they have moved to marry.
14 We randomly sampled one-third of those still in their district of origin and one-fifth of those outside their
home district.
15 While not as successful as the 95 percent household recontact rate achieved in Indonesia by the Indonesian
Family Life Survey (IFLS3) (Thomas et al. 2012), our effective individual tracking rate of 91 percent after 7 years compares favorably with already highly successful panel data collection efforts conducted in the same area of Western Kenya with youths. Following up on 7,500 children sampled in 1998, Baird et al. (2011) achieved an effective tracking rate of 85 percent after 6 years, and 83 percent after 10 years. Following up on around 3,000 adolescent girls sampled in 2001, Friedman et al. (2011) achieved an effective tracking rate of 80 percent after 4 years. Another important panel dataset is the Cape Area Panel Study, a 5-wave longitudinal study with 4,800 urban youths from South Africa aged 11–22 in 2002. The recontact rate in that panel was 81 percent after 3 years (Lam, Ardington, and Leibbrandt 2011).
To test whether attrition in the long-run follow-up survey was differential in terms of underlying, unobserved characteristics, we check whether the treatment effects observed in the roll call data are changed when we estimate them on the follow-up subsample rather than the full sample. The idea is that, if attrition in the long-run follow-up biased the comparability of our groups in any way, then short-run treat-ment effects estimated using that subsample would differ from the “true” short-run treatment effects estimated on the full sample. We perform this analysis in Table A4 for one outcome (having ever started childbearing—results for other outcomes are similar and available upon request). We find that the estimates of the short- and medium-run treatment effects on childbearing measured through the roll call method are very much comparable when estimated on the full sample for which roll call data is available (columns 1 and 4—those are the “true” effects), or on the subsample for which long-run data could be collected after seven years (columns 2 and 5—again, these would be biased estimates of the true effects if attrition were differential). Not surprisingly since the estimates are virtually identical in the full sample and the sam-ple with attrition, the sampling weights correction, while decreasing precision, does not affect the estimates much (columns 3 and 6). All in all, the estimated short-run treatment effects using only the long-run follow-up sample are virtually identical to those using the full sample, even without using the sampling weights. This provides some confidence that differences in other long-run outcomes (in particular STI, the one variable for which we do not have roll call data) can be interpreted as causal treatment effects.
C. Estimation Strategy
The impact of the two stand-alone programs and the joint program can be eval-uated by comparing outcomes across groups in a simple regression framework. For each individual-level outcome, the estimation equation is
(1) Y is = α + β S s + γ H s + δS H s + X s′ μ + η Ag e i + ε is ,
where Y is is the outcome for student i enrolled in school s at baseline; S s is a dummy variable equal to 1 for schools in the stand-alone education subsidy arm; H s is a dummy variable equal to 1 for schools in the stand-alone HIV education arm; S H s is a dummy variable equal to 1 for schools in the joint program arm; X s is a vector of school-level controls (timing of the data collection, school size, and randomization stratum); and Ag e i is student i ’s age. Error terms are assumed to be independent across schools, but are allowed to be correlated across observations in the same school (i.e., the standard errors are clustered at the school level). We present results with sampling weights, which ensure that our final follow-up database is represen-tative of (almost) the entire initial study population, but as mentioned above results are very similar when the estimation is done without sampling weights.
In equation (1), β measures the effect of the stand-alone education subsidy; γ measures the effect of the stand-alone HIV education program; and δ measures the effect of the joint program.
In all tables that follow, we present estimates of equation (1) for a series of out-comes. In each table, panel A presents the estimates for girls and panel B presents
the estimates for boys. At the bottom of each panel, we show the mean of the depen-dent variable for the control group, and we present the p-values for tests of the hypotheses that the effect of the joint program is equal to that of either of the two stand-alone programs, or equal to the sum of the two stand-alone programs (i.e., we test for β = δ , γ = δ and γ = β + δ ). We report ordinary least squares (OLS) linear probability model regressions. The results are qualitatively unchanged with probit or logit specifications for binary outcomes (results available upon request). The results are unchanged when we add school-level controls (such as teacher-pupil ratio, school performance on national exams, whether the school is rural or semi-urban, etc.).
For brevity, we ignore the randomized critical thinking (CT) intervention among
H and SH schools in the main analysis (Tables 2, 3, and 4). We show the CT results in Table 5, using the following specification:
(2) Y is = α + β S s + γ HnoC T s + δSHnoC T s + δ ct HC T s
+ γ ct SHCT s + X s′ μ + η Ag e i + ε is ,
where HnoC T s is equal to 1 for the subset of stand-alone HIV education schools that were not selected for the add-on critical thinking intervention (CT) in 2005,
SHnoC T s is equal to 1 for the subset of joint program schools not selected for the CT
intervention, HC T s is equal to 1 for the subset of stand-alone HIV education schools randomly selected for the CT intervention, and SHC T s is equal to 1 for the subset of joint program schools randomly selected for the CT intervention.
III. Short- and Medium-Run Results: Roll Call Data
Tables 2A and 2B present estimated effects within 3–5 academic years after the onset of the study, obtained from the roll call data. We report the results first for girls, and then for boys. Note that fertility is much better observed for girls, which makes the results for girls more interesting. As discussed above, we pool the schools with and without the add-on CT intervention when estimating the impact of the HIV education program and the joint programs. We will break those down by CT treat-ment status in Section IVC.
A. Impact of the Stand-Alone Education Subsidy on Girls
The stand-alone education subsidy led some girls to remain in school (column 1 of Table 2A). While 18.8 percent of girls in control schools had dropped out after 3 years, those in the education subsidy program were 3.1 percentage points less likely to do so, a 16.5 percent decrease significant at the 5 percent level. Note that this is a surprisingly large effect for a small transfer that had presumably little or no income effect. Also note that “marginal” girls were not less likely to regularly attend school: the program did not affect attendance conditional on enrollment (column 2).
The stand-alone education subsidy also substantially reduced teenage pregnancy. After 3 years, 16 percent of girls in the control group had ever been pregnant. This
share was 2.7 percentage points (17 percent) lower in schools with the stand-alone subsidy (column 4 of Table 2A). After 5 years, there was still a gap of 4.4 percentage points in the likelihood of having ever been pregnant between the stand-alone sub-sidy group and the control group (column 3 of Table 2B). This gap is larger in absolute terms than after three years, but corresponds to a smaller treatment effect in percentage terms, since the childbearing rate in the control group rose from 16 per-cent in year 3 to 33 perper-cent in year 5 for the control group. Nonetheless, it suggests that fertility among girls in the subsidy group did not catch up as soon as the subsidy ended. Indeed, we can reject not only the hypothesis that demand for fertility was simply bottled up during the program years when girls were in school and released afterward, but also the hypothesis that the hazard rate of starting childbearing was
Table 2A—Short- and Medium-Run Impacts: Roll Call Data Impacts after three years Dropped out
of primary school
Attendance rate (while
enrolled) marriedEver
Ever pregnanta Ever pregnant but never married Ever married but never pregnant (1) (2) (3) (4) (5) (6) Panel A. Girls Stand-alone education −0.031 −0.002 −0.026 −0.027 −0.004 −0.002 subsidy (S) (0.012)** (0.006) (0.010)** (0.011)** (0.006) (0.003) Stand-alone HIV 0.003 −0.008 0.011 −0.007 −0.014 0.005 education (H) (0.011) (0.006) (0.009) (0.011) (0.006)** (0.003)* Joint program (SH) −0.016 0.000 0.000 −0.011 −0.013 −0.001 (0.012) (0.006) (0.009) (0.010) (0.006)** (0.003) Observations 9,116 8,232 9,107 9,072 9,072 9,072
Mean of dep. var. (control) 0.188 0.939 0.128 0.160 0.046 0.011
p-value (test: S = SH) 0.240 0.716 0.011** 0.145 0.09* 0.809 p-value (test: H = SH) 0.102 0.204 0.235 0.742 0.866 0.058* p-value (test: S = H) 0.005*** 0.328 0*** 0.084* 0.092* 0.021** p-value (test: SH = S + H) 0.474 0.237 0.278 0.133 0.539 0.311 Panel B. Boys Stand-alone education −0.024 −0.001 −0.008 −0.002 0.001 −0.004 subsidy (S) (0.011)** (0.008) (0.004)* (0.003) (0.001) (0.003) Stand-alone HIV 0.010 −0.021 0.000 −0.002 0.000 0.001 education (H) (0.010) (0.008)*** (0.005) (0.002) (0.001) (0.004) Joint program (SH) −0.015 0.000 −0.010 −0.006 0.000 −0.004 (0.010) (0.008) (0.004)** (0.002)** (0.001) (0.003) Observations 9,461 8,985 9,393 9,433 9,382 9,382
Mean of dep. var. (control) 0.127 0.908 0.022 0.011 0.002 0.012
p-value (test: S = SH) 0.357 0.853 0.601 0.206 0.119 0.834
p-value (test: H = SH) 0.014** 0.005*** 0.004*** 0.093* 0.421 0.042** p-value (test: S = H) 0.001*** 0.011** 0.04** 0.756 0.403 0.097*
p-value (test: SH = S + H) 0.983 0.038** 0.720 0.664 0.162 0.663
Notes: Data collected through five school visits conducted at regular intervals over three academic years (2003, 2004, 2005). Estimates obtained through OLS regressions that include controls for year of birth, the timing of the roll call visits, school size, and randomization strata dummies. Standard errors clustered at the school level.
a For boys, “ever pregnant” is equal to 1 if the respondent ever had a child or a pregnant partner.
*** Significant at the 1 percent level. ** Significant at the 5 percent level. * Significant at the 10 percent level. Source: Roll call data (see Section IIA for details).
the same in the stand-alone education subsidy group and the comparison group after year 3, when girls who did not repeat grades would have left school.17 This suggests
that at least part of the effect of education on fertility goes beyond what Black, Devereux, and Salvanes (2004) refers to as the “incarceration effect” of schooling on teen fertility.
Column 5 of Table 2A shows that the stand-alone education subsidy did not decrease unwed (i.e., single-parenthood, given our definition of marriage) preg-nancy, suggesting that it exclusively reduced within-marriage pregnancy. Column 6 shows that the incidence of marriage with no child did not increase. Together these results suggest that the pregnancies averted were primarily among girls who, had it not been for the education subsidy, would have dropped out of school and settled in
17 Among girls who had not yet started childbearing by year 3, 15.7 percent got pregnant between years 3 and
5 in the comparison group. This proportion was 2.5 percentage points lower (the difference being significant at the 5 percent level) in the stand-alone education subsidy group.
Table 2B—Short- and Medium-Run Impacts: Roll Call Data Impacts after five years Dropped out of primary school Ever married Ever pregnant Ever pregnant but never married Ever married but never pregnant (1) (2) (3) (4) (5) Panel A. Girls
Stand-alone education subsidy (S) −0.053 −0.030 −0.044 −0.009 0.005 (0.017)*** (0.015)** (0.017)*** (0.007) (0.004)
Stand-alone HIV education (H) −0.015 0.022 0.001 −0.014 0.009
(0.015) (0.014) (0.015) (0.007)** (0.004)**
Joint program (SH) −0.023 0.004 −0.011 −0.002 0.011
(0.016) (0.015) (0.016) (0.007) (0.004)***
Observations 8,865 8,391 8,302 8,302 8,302
Mean of dep. var. (control) 0.300 0.265 0.329 0.080 0.012
p-value (test: S = SH) 0.102 0.034** 0.056* 0.320 0.215
p-value (test: H = SH) 0.590 0.250 0.458 0.091* 0.757
p-value (test: S = H) 0.024** 0.001*** 0.006*** 0.468 0.393
p-value (test: SH = S + H) 0.061* 0.597 0.165 0.039** 0.496
Panel B. Boys
Stand-alone education subsidy (S) −0.039 −0.006 0.005 0.000 −0.010
(0.016)** (0.008) (0.005) (0.002) (0.004)**
Stand-alone HIV education (H) 0.010 0.006 0.004 −0.002 0.001
(0.014) (0.008) (0.005) (0.002) (0.005)
Joint program (SH) −0.011 −0.003 0.000 −0.002 −0.003
(0.015) (0.008) (0.005) (0.002) (0.005)
Observations 9,261 8,577 8,897 8,558 8,558
Mean of dep. var. (control) 0.211 0.059 0.032 0.006 0.029
p-value (test: S = SH) 0.071* 0.733 0.458 0.547 0.098*
p-value (test: H = SH) 0.128 0.248 0.567 0.913 0.492
p-value (test: S = H) 0.001*** 0.153 0.872 0.459 0.02**
p-value (test: SH = S + H) 0.382 0.751 0.321 0.856 0.316
a committed relationship. Indeed, girls in the subsidy program were 2.6 percentage points (20 percent) less likely to be married (column 3).
Overall, the reduction in the number of girls who started childbearing was almost as large as the reduction in the number who dropped out of school. It would seem tempting to use columns 1 and 4 of Table 2A (or columns 1 and 3 of Table 2B) as, respectively, the first stage and the reduced form of an instrumental variable strategy of the effect of education on early fertility. However, this would not be legitimate: this instrumental strategy would be valid only under the assumption that the educa-tion subsidy had no direct effect on the pregnancy status of girls. Under the model we develop in Section V, this identification restriction will not hold because sexual activity and the propensity to drop out are jointly determined. The model implies that reducing the cost of education will induce some girls to reduce unprotected sex-ual activity to avoid becoming pregnant and to stay in school longer, invalidating the use of the education subsidy as an instrument for education. But it remains that for each girl who stayed in school thanks to the program, there was one early pregnancy averted. This is a large effect and suggests that investing in ways to keep girls in school could have large returns in terms of preventing early fertility.18
B. Impact of the Stand-Alone HIV Education Program on Girls
Several pieces of evidence suggest that the teacher training affected teacher behavior in the classroom. Focus group discussions (not shown) confirmed that the training increased the likelihood that teachers talked about HIV in class. In par-ticular, students in schools where teachers had been trained were 50 percent more likely to report that at least one teacher had mentioned HIV/AIDS in the previous week.19 A self-administered survey, distributed among students enrolled in seventh
and eighth grades in 2005, suggests the HIV education program increased the like-lihood that students report that teachers mentioned HIV in class and moderately increased students’ knowledge about HIV (see Table A5 in the online Appendix).
While the HIV education program changed the content of education, it did not affect educational attainment. Coefficient estimates of the impact of the stand-alone HIV education program on schooling attainment are very small in magnitudes and insignificant (column 1, row 2, of Tables 2A and 2B). The teenage pregnancy rate
18 Respondents may have underreported pregnancies which ended through abortion. To the extent that the
edu-cation subsidy increased the cost of pregnancy, it could have increased the incidence of abortion. We did not directly ask about abortions during the roll call data collection at school, though students did report some abortions or mis-carriages. It is quite possible that students did not know of abortions that girls had. The long-run follow-up survey directly asked respondents: “Have you ever had a pregnancy that miscarried, was aborted, or ended in a stillbirth?,” and if they said yes, we asked how many of those they had; 2.088 percent said yes, and of those, 90 percent had only one such pregnancy. Below, we include those pregnancies in the “ever pregnant” dummy variable based on the long-run follow-up data presented in Table 3. So conceptually, the long-long-run follow-up data is measured correctly and the similarity we will find between Tables 2A/2B and 3 results is reassuring. That said, it is possible that abortions are underreported in our data, to the extent abortion is illegal in Kenya. For the same reason, they also are likely rare, especially among adolescents. One indirect way to look at it is via death, as illegal abortions are extremely dangerous. The death rate we observe at the seven-year follow-up is shown in column 1 of Table A2. It is lower, not higher, among girls (1.3 percent) than boys (1.6 percent). In fact the relative female death rate in our sample is lower than the relative average female death rate in sub-Saharan Africa for age group 15–19 (Anderson and Ray 2010, Table 2). We also find no differential death rates across treatment arms.
19 Focus group discussions were held with students enrolled in sixth and seventh grades in early 2004, about one
year after teachers had been trained. The focus group discussions were conducted separately with five boys and five girls randomly chosen among students present in class during an unannounced visit.
also did not fall significantly in response to the stand-alone HIV education program. The point estimate of program impact on pregnancy is close to zero after three years, and almost exactly zero after five years (column 4 of Table 2A and column 3 of Table 2B). We can reject equality with the effects of the stand-alone education subsidy on pregnancy and on dropout at a level below 10 percent in all cases.
Although the HIV education program did not reduce overall teen fertility, it changed the type of pregnancies (in or out of wedlock). Unwed pregnancy is 1.4 per-centage points lower among teenage girls exposed to the HIV education curriculum (column 5 of Table 2A and column 4 of Table 2B). This corresponds to a drop of 30 percent over the first 3 years and 18 percent over the first 5 years.20 The point
estimates for the effect on marriage are positive but insignificant (column 3 of Table 2A and column 2 of Table 2B), but the likelihood of marriage without pregnancy was significantly increased by the HIV education program, however: such early, non-shotgun marriages are rare (only 1.2 percent of girls had engaged in such a marriage after 5 years), but almost doubled in the stand-alone HIV education group (+0.9 percent, column 5 of Table 2B).
Taken together, these results suggest that the stand-alone HIV education program may have switched unprotected sexual activity from outside- to within-marriage. Consistent with this, the HIV education program also increased the likelihood that students mention faithfulness as a means to prevent HIV, consistent with the idea that it moved pupils toward committed relationships (column 9 of Table A5).
C. Impact of the Joint Program on Girls
Arguably the most surprising result in the roll call data is that the HIV educa-tion program, which is ineffective on its own, seems to reduce the impact of the education subsidy, both on schooling and on fertility. Indeed, the effect of the joint program on dropout is only one-half that of the stand-alone subsidy, and not signif-icant at conventional levels (the t-statistic for the effect on education is 1.33 after 3 years (column 1 of Table 2A) and 1.5 after 5 years (column 1 of Table 2B)). After three years, we cannot reject the hypothesis that the effect of the joint program is the sum of the effects of the two stand-alone programs, but after five years, we can reject additivity (the effect of the joint program is lower than the sum of the two stand-alone programs).
When it comes to pregnancy risk, the estimated effect of the joint program is less than one-half that of the stand-alone education subsidy. Again, that effect is not significant after three years (column 4 of Table 2A). Two years later, the effect of the joint program on pregnancy had diminished even further compared to that of the stand-alone education subsidy (column 3 of Table 2B).
20 It is unclear what the consequences will be, either for mothers or for their children, of the decline in
unwed/single-parenthood teen births in the stand-alone HIV education group. There is a strong negative association between being raised by a single mother and outcomes in the United States (Harper and McLanahan 2004; Ellis et al. 2003), but it is unclear how much of this effect is causal. In any case the impact could potentially be different in a rural African setting, in which care within the extended family setting (in particular by grandparents) is com-mon, especially if the mother is a teenager. Case and Ardington (2006) and Evans and Miguel (2007) find negative effects of paternal orphanhood on children in a similar setting, but being born to a single mom may be different from becoming a paternal orphan after birth.
Finally, the point estimate suggests that girls who received the joint program were exactly as likely to be married as girls who received neither program (column 3 of Table 2A). For pregnancy and marriage, we can reject the null hypothesis that the effects are the same for the joint program and for the stand-alone education subsidy. We cannot reject the null hypothesis that the joint program has the same effect as the stand-alone HIV education program, however.
D. Impacts on Boys
The impacts of the programs on boys’ education are similar to those observed for girls: the stand-alone education subsidy program reduced the dropout rate after 3 years by 2.4 percentage points, corresponding to a 19 percent reduction compared to the control group. After 5 years, the dropout rate was still 3.9 percentage points lower. The point estimate of the impact of the joint program on educational attain-ment is somewhat smaller (1.5 percentage points after 3 years, with a t-stat of 1.5). There is also a small but significant drop in marriage within 3 years (similar across the stand-alone education program and the joint program) and even a reduction in observed paternity after 3 years, significant only for the joint program (0.6 percent-age point, out of a mean of 1.1 percentpercent-age points). The stand-alone HIV education program had no impact whatsoever except for a negligible impact (in terms of mag-nitude) on attendance while enrolled.
The effects on boys could be direct program effects or the equilibrium con-sequences of changed incentives for their female classmates. We favor the first explanation for two reasons. First, because we see similar impacts of the stand-alone education subsidy and joint program on education, marriage, and fer-tility, which suggests a simple direct causal link from the desire to stay in school to reduction in early marriage and acknowledged paternity (our understanding is that only those children who are supported by their father show up in boys’ reports of paternity). Second, the effect on marriage and fertility for boys appear too big to be an equilibrium consequence of the changed incentives for the girls in their class. Teenage girls typically marry men who are about six years older on average, not their classmates. Our follow-up data suggests that in the comparison group, only 4 percent of the 12.8 percent of girls who had married by year 3 (so overall 0.5 percent of girls) had married a boy their age or up to 1 year older. Even under the extremely conservative assumptions that (i) these are all within-school mar-riages (which is itself unlikely since marriage among even distant relatives is not culturally allowed and students in a given school are often related to each other), and (ii) this proportion falls to zero in the stand-alone education subsidy group, the general equilibrium (GE) effect would explain only about one-half of the fall in marriage we observe among boys.
IV. Long-Run Effects: The Biomarkers and Survey Data
A. Education, Marriage, and Fertility
The estimations of equation (1) on the long-run outcomes measured through the follow-up survey are presented in Tables 3 and 4.