Edgeworth cycles revisited
The MIT Faculty has made this article openly available. Please share
how this access benefits you. Your story matters.
Citation Doyle, Joseph, Erich Muehlegger, and Krislert Samphantharak. “Edgeworth Cycles Revisited.” Energy Economics 32.3 (2010) : 651-660.
As Published http://dx.doi.org/10.1016/j.eneco.2009.09.001
Publisher Elsevier B.V.
Version Author's final manuscript
Citable link http://hdl.handle.net/1721.1/64740
Terms of Use Creative Commons Attribution-Noncommercial-Share Alike 3.0
EDGEWORTH CYCLES REVISITED*
Joseph Doyle1 Erich Muehlegger2 Krislert Samphantharak3
August 2009
(under revision for resubmission to Energy Economics) Abstract
Some gasoline markets exhibit remarkable price cycles, where price spikes are followed by a series of small price declines: a pattern consistent with a model of Edgeworth cycles described by Maskin and Tirole. We extend the model and empirically test its
predictions with a new dataset of daily station-level prices in 115 US cities. Consistent with the theory, and often in contrast with previous empirical work, we find the least and most concentrated markets are much less likely to exhibit cycling behavior both within and across cities; areas with more independent convenience-store gas stations are also more likely to cycle.
* We would like to thank Justine Hastings, Michael Noel, Matthew Lewis, Tavneet Suri, and participants at
the American Economics Association Annual Meetings and the International Industrial Organization Conference for helpful comments and discussions.
1 MIT Sloan School of Management, 50 Memorial Drive, E52-447, Cambridge MA 02142. Email:
2John F. Kennedy School of Government, Harvard University, Mailbox 25, 79 JFK Street, Cambridge, MA 02138. Email: [email protected]
3 Graduate School of International Relations and Pacific Studies, University of California at San Diego,
I. Introduction
Tremendous variation exists in the pricing strategies chosen by different
businesses and how market prices dynamically evolve in different industries. Although a long literature in industrial organization identifies different equilibrium pricing strategies, in many cases the models do not make clear predictions as to why firms might choose one set of strategies in one competitive environment and choose a different set of strategies in another competitive environment.
Retail gasoline markets provide a setting to study how the competitive environment can affect these strategies. Gasoline prices are unique in that they are particularly visible to both competitors and consumers. Further, competitors are often found within close proximity of one another. In this setting, it seems plausible that firms compete on price in a dynamic Bertrand game. This is evident in a remarkable pattern in prices over time when price spikes are followed by slow reductions until the next spike: a pattern consistent with an “Edgeworth cycle”.
Maskin and Tirole (1988) first specified a dynamic Bertrand game in which firms played Edgeworth cycle strategies in equilibrium. The model considers two identical competitors that sequentially choose from a finite grid of prices. In the Edgeworth-cycle equilibria, if the opponent's price is greater than marginal cost, the firm selects the price that just undercuts her opponent's price. If the opponent was pricing at marginal cost, with some probability the firm relents, choosing a much higher price and allowing the cycle of undercutting to begin again. In such equilibrium, the market clearing price slowly falls to marginal cost until one firm stochastically relents, which results in a price spike.
This paper aims to shed light on why we see Edgeworth cycles arise in some local gasoline markets, but not in others. To examine this question, we adapt Maskin and Tirole (1988) to account for two sources of heterogeneity amongst retail stations. First, we allow for loyal consumers who, due to geographic differentiation, brand loyalty or unobservable preference, do not switch to competitors offering marginally lower prices. Second, we allow firms to earn profits from goods complementary to the primary good upon which firms compete, such as convenience store operations. By comparing how profits of cycling and non-cycling strategies vary with the two sources of heterogeneity, we generate testable predictions of where we would expect to see cycling behavior.
We test our predictions using daily, station-level prices for 115 US metropolitan areas, a larger dataset than in previous studies. We document that Edgeworth cycles are only found in a subset of US cities, and a subset of neighborhoods within these cities. Consistent with the theory, we find that greater market penetration by independent gasoline stations offering convenience store services is associated with cycling behavior. In addition, evidence suggests a non-monotonic relationship between cycling and market concentration: the least and most concentrated markets are less likely to cycle. It appears that cities and neighborhoods with intermediate levels of competition can support the type of pricing strategies that lead to Edgeworth cycles.
The remainder of the paper is organized as follows: section 2 offers an extension to the Maskin and Tirole model of Edgeworth cycles; section 3 describes the data; section 4 reports the empirical models and results; and section 5 concludes.
Maskin and Tirole (1988) first specified a dynamic Bertrand game in which firms played Edgeworth cycle strategies in equilibrium. Eckert (2003) introduces
heterogeneity in the market participants by considering the case in which one firm obtains greater than half of the market when both firms choose identical prices. Eckert shows that although cycle equilibria exist for all splits of the market, the speed of the cycles are negatively correlated to the degree of asymmetry between the market
participants.4 Noel (2008) further extends the theory by proving the existence of cycling equilibrium computationally for markets in which firms face unequal discount rates, asymmetric capacity constraints and in the case of a triopoly rather than the duopoly assumed in Maskin and Tirole.5 In contrast to these papers, which show the existence of Edgeworth equilibria under different markets, we examine how profits associated with cycling and non-cycling strategies vary with brand loyalty and convenience store
operation.6
Following Maskin and Tirole, we consider a dynamic game in which N firms sequentially choose from a discrete set of possible prices. We define pit as firm i's choice of price at time t, p-it as the vector of prices of firm i's competitors, and pt as the vector of all firm prices at time t. Firm i faces a marginal cost of ci. All consumers choosing to purchase from firm i, setting price pit, consume q(pit). We focus on Markov perfect
4 As one firm's share of demand when identical prices are chosen rises, the firm has a greater incentive to
match rather than undercut her competitor's prices. Consequently, and the length of the undercutting phase are negatively related to the asymmetry between the two participants.
5 Noel also considers an extension in which firms are differentiated along the Hotelling line and consumers
incur travel costs. In this case, undercutting leads to partial (rather than full) capture of the other firm’s demand – Noel finds that if differentiation is sufficiently great, Edgeworth cycles no longer exist in equilibrium.
6 For purposes of this paper, we focus on comparing the relative expected profits earned by firms playing
cycling and non-cycling strategies. We do not explicitly prove existence of cycling equilibria for the locally-proximate groups of stations observed in our data. To our knowledge, only Noel (2008) proves existence of cycling equilibria beyond a duopoly, focusing on the case of three symmetric firms. Proving the existence of cycling equilibrium more generally is a substantially more challenging theoretically exercise, which we reserve for later work.
equilibria to the game, given by a set of N reaction functions, {Ri(p-it)}. For each vector of opponent's prices, Ri(p-it) maximizes firm i's expected current and future profits assuming all firms continue to play their reaction functions. We specify firm i's profits in period t as
Πit = ( pit − ci)[αi+βi( pt)]q( pit)+γi[αi+βi( pt)] (1) In our model, we distinguish two types of consumers. We let αi denote the proportion of consumers “loyal” to firm i, who always purchase from firm i regardless of the price firm i chooses to set. βi(pt) denotes the proportion of consumers who will switch firms in response to the relative prices offered by the firms.7 We assume, without loss of generality, that all consumers are either loyal to a single firm or switch firms depending on the relative prices – that is, for all vectors pt, αi +βi( pt)
i
∑
= 1. Bydefinition, we assume that if firm i has the highest price of the N firms, βi(pt)=0.
Furthermore, we define β as the value of βi i(pt) when firm i has the lowest price of the N firms: the highest value βi(pt) can take. We let pi* denote the price that maximizes profits from loyal consumers.8
The first term in the profit function corresponds to sales of the primary good for which firm i sets price pit. The second term corresponds to additional profits accrued from the proportion of consumers who purchase from firm i through sales of secondary goods. We use γi to denote the marginal profit earned by selling the secondary good to
7 Although we do not further distinguish the preferences of consumers, consumers may have additional
preferences that cause them to act “loyally” in some situations and price shop in other situations. For example, a consumer with a strong preference for purchasing from station with strong brand presence may act as a loyal consumer in a location where only one branded firm is present. In a location with more than one branded station, the consumer may switch between branded stations in response to the prices each set.
8 Maskin and Tirole consider a duopoly in which α
i =0,γi =0, βi(pi,pj) is equal to either zero, one-half or one
depending on whether pi is greater than, equal to or less than pj. Eckert allows an asymmetric split of the
the proportion of consumers who choose to purchase from firm i. In the context of retail gasoline stations, the first term corresponds to purchases of gasoline, and the second term corresponds to purchases of other goods and services offered by an affiliated convenience store or service station. Implicitly, we assume that firms attract customers on the basis of the posted price of the primary good (gasoline), and in some cases, may accrue additional profits from the secondary good (c-store sales).
Following Maskin and Tirole, we use Vit(p-it) to denote firm i 's expected profits when it is about to choose prices and firms play Markov perfect equilibrium strategies {R1(p-1t), R2(p-2t),…, RN(p-Nt)} thereafter.9 For notational convenience, let V and
denote the expected profits from gasoline sold to loyal customers and to firm-switching customers when the firm i plays R
it α
( p−it)
Vitβ( p−it)
i(p-it). Let W and W denote the expected c-store or service station profits when the firm i plays R
it α( p −it) it β( p −it) i(p-it).
We begin by characterizing the relationship between parameters αi, βi, and γi, and the expected profits earned by firms playing cycling and non-cycling strategies. We prove that as the share of “loyal” customers increases, the expected profits from playing a constant price strategy rise more quickly than the expected profits from playing a cycling strategy. Furthermore, if αi is sufficiently high relative toβi, we prove that playing pi
*
strictly dominates all strategies exhibiting cycling behavior. Second, we show that as γi increases, the relative expected profits associated with cycling rise relative to non-cycling.10
9 Multiple Markov perfect equilibria (MPE) may exist - the value function depends on the particular MPE.
Proposition 1: Let {R1(p-1t), R2(p-2t),…, RN(p-Nt)} be a set of reaction functions exhibiting cycling behavior. As αi increases, the expected profits earned by firm i by playing strategy Ri(p-it) increase less quickly than the expected profits associated with always playing pi*.
Corollary 2: There exist values of αi and βi such that firm i would prefer to always play pi* rather than play Ri(p-it).
As the share of “loyal” customers rises, the profits associated with playing the constant price strategy, pi*, rise more quickly than the profits associated with playing any cycling strategy. Corollary 2 proves that if a firm has a sufficiently high proportion of loyal customers, choosing the optimal static price for the loyal customers will dominate any cycling strategy. Thus, if a dominant firm in a market enjoys a sufficiently great geographic or brand advantage over a smaller, independent rival, the larger firm may find that pricing to maximize profits from “loyal” customers strictly dominates any strategy involving cycling, and the smaller firm would then capture the majority of the firm-switching customers. Our finding, that a dominant firm with a substantial number of “loyal” customers may be reluctant to participate in cycles, is consistent with the computational finding in Noel (2008), that if differentiation is sufficiently high, prices cannot cycle in equilibrium.
Proposition 3: Let {R1(p-1t), R2(p-2t),…, RN(p-Nt)} be a set of reaction functions
a strategy exhibiting cycling behavior increase more quickly than the expected profits associated with playing pi*.
Firm willingness to play a cycling strategy rather than pi* depends on whether the profits gained by attracting firm-switching customers exceed the profits lost from
suboptimally pricing the primary good to loyal customers. As γi increases, the profits gained from selling both the primary and secondary goods to firm switching customers increase relative to the lost profits from setting a suboptimal price for the primary good.
Empirical Predictions
Adapting Maskin and Tirole to allow for firm heterogeneity provide several predictions about the characteristics of cycling and non-cycling firms.11 Proposition 1 suggests that potential benefits to cycling are less pronounced for firms enjoying geographic differentiation or brand loyalty. 12 Furthermore, proposition 3 suggests that the likelihood of cycling should also be correlated with the presence of retail stations with convenience stores. Based on our model predictions, we postulate that the geographic areas with independent stations and, especially independent stations with convenience stores, would be most likely to exhibit cycling behavior. We test these predictions at both the MSA and ZIP-code levels.
III. Data Description
11 Although, in this paper we focus on cycling behavior, the proposition holds for any alternative reaction
function chosen by firm i.
12 Noel (2007) intuits this relationship and finds evidence consistent with station density increasing the
The empirical analysis uses a dataset of daily gasoline prices across 115 metropolitan statistical areas (MSAs) in the Midwest and Northeast U.S. from April 1, 2000 to March 31, 2001.13 These data were collected at the station level by the Wright Express Financial Services Corporation, a leading provider of payment processing and financial services to commercial and government car, van and truck fleets in the United States. Their Oil Price Information Service (OPIS) provides pricing information to the industry and transportation companies.
In addition to the retail price, OPIS data include a measure of each station’s wholesale price. This is a rack price—the price at the terminal—from the nearest refinery that produces the regulatory formulation of gasoline used by the station. These regional prices also vary by brand of gasoline, and the data include these brand-specific wholesale prices. This wholesale price may differ from the internal transfer price paid by refiner-owned stations. It may also differ from the station’s actual wholesale price in that it does not include volume discounts or delivery charges.14
The OPIS data also include the street address of the station. US Census of Population data at the ZIP code level in 2000 were matched to the stations, including median household income, population, and commuting behavior. Race and educational attainment measures were also collected. In addition, the 2000 US Census ZIP Code Business Patterns database records the number of gasoline stations in each ZIP code.
13 Metropolitan areas include an urban core with a population of at least 50,000, as well as surrounding
counties tied economically through driving patterns—a definition well suited to studying gasoline markets. The data include stations in the Midwest, where there was a large price spike in the spring of 2000, as well as eastern states as a comparison, including Arkansas, Connecticut, Illinois, Indiana, Iowa, Kansas, Kentucky, Maryland, Massachusetts, Michigan, Minnesota, Missouri, Nebraska, New York, Ohio, Pennsylvania, Rhode Island, Tennessee, Virginia, West Virginia, Wisconsin and Washington, DC.
14 There is a literature that considers the relationship between refiners and retailers in gasoline markets,
including Shepard (1993), Slade (1998), and Taylor (2000). Volume discounts are common for branded gasoline at the wholesale level. Estimates with and without controls for wholesale price are discussed below.
One advantage of the OPIS data is that measurement error should be minimized, as the prices are recorded electronically from their clients’ charge cards.15 A cost of using credit card transactions is that they are only available for stations visited by a card holder, which results in missing data especially on weekends. Over 33,000 stations are found at least once over the year in our data, and theses stations provide a fairly accurate measure of brand coverage in a city. When comparing stations in the pricing survey and those in the Census Business Patterns data at the MSA level, then average number of stations is 262 and 274, respectively. At a smaller scale, the median ZIP code had three quarters of the stations surveyed.16
Edgeworth cycles are characterized by gradual downward price movements, as firms marginally undercut competitors’ prices, followed by a price spike. To empirically categorize geographic areas as cycling versus non-cycling, the median daily change in the retail price is considered, as in Lewis (2008). In particular, the daily change in retail price was calculated for each station with at least two consecutive days of data, and then the median of this daily price change at the MSA or ZIP code level was calculated. In cycling markets, we would expect the median price change to be negative, reflecting the greater number of days of falling prices as opposed to the sudden jump in price in the relenting phase. To ensure that the changes represent movements of a common set of stations, only stations that were present for at least 200 days over the year were included
15 Further information on the methodology is available in Doyle and Samphantharak (2008) and at
http://opisnet.com/methodology.asp
16 To explore the types of ZIP codes that have better coverage in the pricing sample, the ZIP code count of
the number of stations in the sample was regressed on the observable characteristics in Table 1. The main result is that more populous ZIP codes are associated with more station surveyed, controlling for the number of stations in the Census data.
in these calculations, although the results were similar when all of the information was used.
In practice, we found that OPIS data can characterize cycling behavior at the MSA and ZIP code levels, but they are not precise enough to characterize cycling at the station level. Furthermore, even in locations where cycling exists, it is difficult to
observe which station relents at the bottom of the cycle, as the change likely happens at a higher frequency than our daily data can capture. Rather than estimating cycling
behavior at the station-level, we aggregate up to the MSA and ZIP code levels. The two main measures of market structure are the fraction of stations that are independent and measures of the brand concentration in the market. Independent stations are not affiliated with a particular oil refiner, and they were identified in our sample by investigating the brand name. The Society of Independent Gasoline Marketers of
America (SIGMA) publishes its member list, which provides one measure of whether the brand was independent, and the remaining brands were investigated individually. We further categorized independents based on the proportion of their retail outlets with an attached convenience store, as reported in trade press, websites and regulatory filings. 17 Of the 45 independent brands observed in our data, twenty-six brands operate
convenience stores at more than half of their retail outlets.
In terms of the brands, one feature of gasoline markets is that some stations may be owned by the refiner, while others are franchises. Unfortunately, the data do not allow us to separate these two groups. Further, when we characterize brand shares, no quantity data are available at the daily level. Instead, the fraction of stations in our sample of a
17 Unfortunately, characteristics of the station, such as the number of pumps or whether there is a
particular brand is used in calculating the 3-brand concentration ratio and the brand HHI. Again, the station concentration of each brand appears fairly accurately measured, as the number of stations ever surveyed in each area is similar to Census measures.
IV. Empirical Models and Results A. Previous Empirical Evidence
Several papers empirically document Edgeworth cycles in city-level retail
gasoline price series. Eckert analyzes prices for 19 Canadian cities and finds that market penetration of independent gasoline retailers is negatively correlated with price rigidity, consistent with the results from his theoretical model. Noel (2007a) applies a Markov switching regression to estimate the length of the undercutting and relenting phases as well as the transition probabilities. Using ten years of weekly, city-level data for 19 Canadian cities, Noel finds that as independent retail station market share increases, more markets exhibit cycling behavior, a result that supports the predictions of Eckert's model. Lewis (2008) finds that prices fell more quickly in Edgeworth cycle markets than in non-cycling markets following the Hurricane Rita price spike. In addition, he finds a similar relationship between independent retailer penetration and price cycling as Noel (2007a), using city-level data for 83 US cities.
A second set of papers examine the characteristics of Edgeworth cycles using station-level data within particular markets. Noel (2007b) estimates cycle attributes using semi-daily data on 22 retail gasoline stations in Toronto, Canada and Atkinson (2008) examines hourly data for 27 retail gasoline stations in Guelph, Canada. Both Noel and Atkinson study the behavior of participants in price cycles and examine which firms in
each market are most likely to relent at the bottom of the cycle. They tend to find that larger firms are more likely to initiate the relenting phase, whereas smaller firms are more likely to undercut.
B. Edgeworth Cycles across US Cities
As mentioned, we calculate the median daily price change for each of our geographic areas following Lewis (2008). For ease of interpretation, we apply a cutoff below which an area is classified as exhibiting cycling behavior. As a first look, we ranked the MSAs in our sample by their median daily changes of average retail price. Figure 1 shows the average retail and wholesale price over time in 4 cities: the city with the smallest (i.e. largest negative) median change in retail price (Toledo, OH: median change equal to $-0.0124), a city near the median of the daily price change distribution (Detroit, MI: $-0.0014), and two cities city near the top of the ranking (Lincoln, NE, and Johnstown, PA). In the top 3 graphs, a large price spike in the spring of 2001 common to stations in the Midwest dominates the first few months of the series. This spike was partially due to a mandated reformulation and subsequent shortages (for more detail, see Doyle and Samphantharak, 2008). Later in the summer and the rest of the year, some of the cities in the Midwest reveal small decreases in price followed by sudden increases. For Toledo, Detroit, and Lincoln, the wholesale price movements are nearly identical, but the Toledo market has what appear to be Edgeworth cycles and the other two do not. Johnstown does not have the spike in April 2000, nor does it exhibit cycling behavior. It appears that the median price change measure reveals which cities tend to cycle. In particular, cities with a median price decline of -0.005 or more appear to exhibit cycling
behavior, and this cutoff will be used in the analysis to compare cycling and non-cycling cities.18
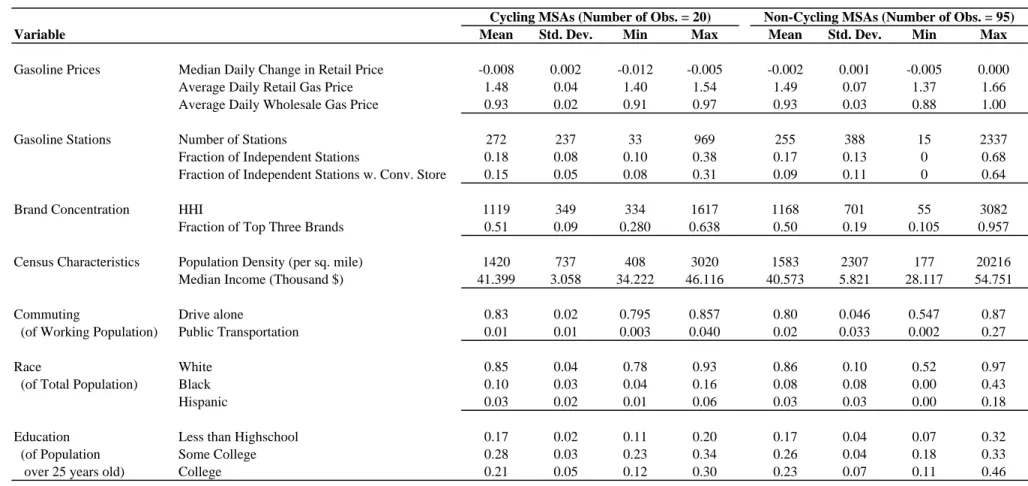
Table 1 compares the characteristics of the 20 cycling MSAs with the 95 non-cycling MSAs in our sample. The first row shows that this price change in the non-cycling MSAs is negative—a median decline of 0.8 cents per day—whereas non-cycling MSAs show median price change close to zero. The average retail and wholesale prices are similar across the two groups, with retail prices during this time period close to $1.50 per gallon. Much of the difference between retail and wholesale price is comprised of the state and federal taxes on gasoline.
In terms of the fraction independent and brand HHI, the cycling and non-cycling cities feature similar measures. This similarity masks a nonlinearity in the data that the most (and least) concentrated markets are less likely to feature cycling. The fraction of stations that are independent with convenience store operations does appear positively related to cycling in the raw means, with these types of stations making up 15% of cycling-city stations and only 9% of stations in non-cycling cities.
When US Census characteristics are considered, non-cycling MSAs include the largest cities and have higher average population density levels (1600 per square mile vs. 1400). Cycling cities also have more stations on average (271 vs. 255). The median household income is slightly higher in the average cycling city as well ($41,400 vs. $40,600).
Among the employed population, commuting patterns are similar across the two groups. Most workers drive to work alone, with slightly higher rates in cycling cities
18 Appendix Figures A1A and A1B show retail and wholesale prices over time for the cutoff city at -0.005
(83% vs. 80%). Meanwhile, the cities are similar in terms of racial composition. Among adults over the age of 25, the high school dropout rates are the same on average across the two groups. The percent with college education is higher in the non-cycling MSAs (23% vs. 21%). Overall, the cycling and cycling MSAs appear similar, with the non-cycling MSAs including the largest cities.
Cycling & Brand Concentration
In the model, the price elasticity of customers varies by firm, with some firms enjoying more brand loyalty or geographic advantage than others. One way that we characterize the potential for brand loyalty is by comparing independent stations with the refiner-affiliated brands such as Exxon or Citgo that invest more heavily in brand
identification. Further, the model suggests that in markets that are highly concentrated the top firms will have less incentive to enter the cycle, and in highly competitive
markets, the tacit collusion necessary to support cycling may break down. As a first look at these implications, Table 2 compares the cycling behavior across MSAs that vary by their fraction of stations that are independent or their brand concentration levels.
Panel A groups MSAs into quartiles based on the fraction of independent stations. The bottom quartile has 4% of stations that are independent on average, whereas the top quartile averages 35% of stations that are not affiliated with an oil refiner. The
relationship between the fraction independent and cycling behavior has a marked invese-U shape: 31% of cities in the middle two quartiles exhibiting cycling, whereas few cities in the bottom or top quartile are found to cycle. This result is in contrast with the
likelihood of cycling behavior (Noel, 2007a). A possible explanation is that the previous evidence compared 19 cities in Canada, which do not appear to have the amount of variation in the types of cities to find such a relationship.
Panel B shows that a greater proportion of stations that are independent does appear to be related to cycling when those independents are also convenience store operators. The bottom two quartiles of cities here do not exhibit cycling at all. For the top two quartiles of cities based on the fraction of independent stations with convenience store operations, 41% and 29% are found to cycle, respectively.
As the fraction of independent stations grows, this may represent a more
competitive market. To investigate the relationship between concentration and cycling directly, Figure 2 considers the 1-brand concentration ratio and the 3-brand concentration ratio. Local-linear regression estimates of the cycling indicator on these concentration measures are reported. As the largest brand gets larger, the likelihood of cycling in the city decreases. This is consistent with a reduced incentive by a dominant firm to engage in an Edgeworth cycle. The 3-brand concentration ratio shows a distinctive inverse-U shape with regard to cycling. It appears that cycling is much less likely in cities with either a high or low level of concentration.
Panel C of Table 2 further explores this relationship between concentration levels and cycling in terms of HHI measured using the share of stations in the area (similar results are found when the 3-brand concentration ratio is used instead). 14% of the markets in the least concentrated MSAs and 11% of the most concentrated MSAs can be categorized as cycling, compared to 31% in the 3rd quartile.19 These measures could be
19 Similarly, the 3 brand concentration ratio (not shown) increases from 0.27, 0.49, 0.57, and 0.70 from the
related to the fraction of independent stations to the extent that large independent brands are driving both measures. In practice, more independent stations are associated with less concentrated markets.20
These raw comparisons do not take into account differences between the MSAs. Table 1 showed that cycling and non-cycling MSAs are similar, but the relationship between cycling and concentration may be affected by the demand characteristics in the area. To test the relationship between cycling behavior and the fraction of independent stations or brand concentration, controlling for the demographic characteristics of the MSAs, the following model is estimated for MSA m:
Y
m=
γ
0+
γ
1I
m+
γ
2H
m+
γ
3X
m+
ε
m(2 )
where Ym is a measure of the cycling behavior of the MSA, either the cycling indicator or the median daily change in the retail price; Im measures the fraction of independent stations in the MSA; Hm is a vector of indicator variables equal to one if the MSA is in a particular quartile of the HHI distribution and zero otherwise; Xm is a vector of the MSA’s characteristics described in Table 1, including the demographic controls and the median change in the wholesale price. The model is estimated with OLS to compare conditional means, although the results for are similar when probit models are used to estimate the model when the dependent variable is the cycle indicator.
Panel A of Table 3 reports the results when the indicator for cycling is the dependent variable, and Panel B reports the results for the median change in daily prices—the measure used to define the cycling indicator. This measure allows all of the
20 Pair-wise correlations between the fraction of independent stations vs. HHI and between the fraction of
information in the daily change to be used in estimating the relationships, although the relationships are similar in both Tables.
Column (1) shows a lack of a linear relationship between the fraction of stations that are independent in a city and cycling behavior, whereas Column (2) shows that the greater the proportion of stations that are independent with significant convenience store operations increases, so does the likelihood of cycling. To consider the nonlinearity shown in Table 2, Column (3) reports estimates from a model that includes indicators for the quartiles of the fraction of stations that are independent. Here, the bottom quartile is less likely to cycle compared to the top quartile, although the difference is not statistically significant. As in Table 2, the middle two quartiles are where cycling behavior is found most likely to occur. Column (4) shows that across cities that vary by their fraction of stations that are independent with significant convenience store operations, the top two quartiles are much more likely to cycle.21
Column (5) shows that the areas most likely to cycle are those where the
concentration measure is in the 3rd quartile, confirming the unconditional results shown in Table 2. Columns (6) and (7) include both the fraction independent measures and the HHI quartile indicators, and both results are robust. In particular, the 3rd quartile in terms of brand HHI is associated with a 22-25 percentage-point higher likelihood of cycling compared to the most concentrated MSAs (s.e. = 0.11). With 17% of cities found to cycle, this is a large difference.
In terms of the control variables, the demographic characteristics of the cities are largely unrelated to cycling behavior (see Appendix). In particular, median daily changes
21 These results were robust to categorizing stations as independent if they were SIGMA members, as
in our wholesale price measure are unrelated to cycling behavior. The greater proportion of workers who drive to work alone is (weakly) positively related to cycling behavior.
These results suggest that cycling behavior is less likely to occur in the most competitive markets with the most independent stations—a situation when coordination may be infeasible. Further, in the most concentrated markets, it may not be in the interest of the dominant firms to enter the cycle. Rather, it is in the markets where the top 3 brands represent 50-60% of the market where we are seeing the cycling behavior most pronounced.
Although our model predicts that the most concentrated markets may be the least likely to cycle, the observed non-monotonicity is not a direct prediction. There are several factors which may help to explain to the non-monotonic relationship between city-level concentration and city-level price cycles. First, the non-monotonicity is consistent with the theoretical literature that finds that cycling equilibria are more difficult to support as the number of players increases (Noel 2008). With more
competitors, each player becomes less willing to be the firm which initiates a price jump, sacrificing its own profits until other players follow.
Second, the observed non-monotonicity may arise if concentration helps firms to coordinate the timing of jumps across the city. If prices at each street corner cycle with different frequencies, local price cycling may be difficult to detect in city-level prices. Although we typically observe that the price jumps occur on the same day in cycling cities, this coordination may be stronger in more concentrated markets where the major firms can act as price leaders. Finally, only a subset of brands (or particular pairs of competing brands) may be willing to engage in price cycles. As a result, we may be less
likely to see cycles at the city-level in unconcentrated markets where these firms have a smaller market share or are less likely to compete directly.
Consequently, the non-monotonicity we observe may arise from forces which operate in different directions. Our model predicts that large firms with substantial brand presence and potentially loyal customers are less likely to cycle than small market share independents – consequently, as concentration falls, we may tend to see more cycling behavior. On the other hand, there are a number of reasons why, as markets become highly unconcentrated we may also be less likely to observe cycling at the city-level. In the least concentrated cities, cycles may be more difficult to sustain or coordinate across more localized markets.
Price Effects
One question that arises is whether cycles result in lower or higher average prices. A complication is that cycling is related to the competitive nature of the market, which is predicted to affect prices as well. To consider the relationship between cycling and prices, controlling for market concentration, the following model is estimated for market
m:
Pm = γ0 + γ1Cm +γ2Im +γ3Hm +γ4Xm + εm (3)
where Pm is the average retail price in the city, Cm is a cycling indicator, Im and Hm are measures of the market structure as above, and Xm is a vector of controls including the average wholesale price in the market.
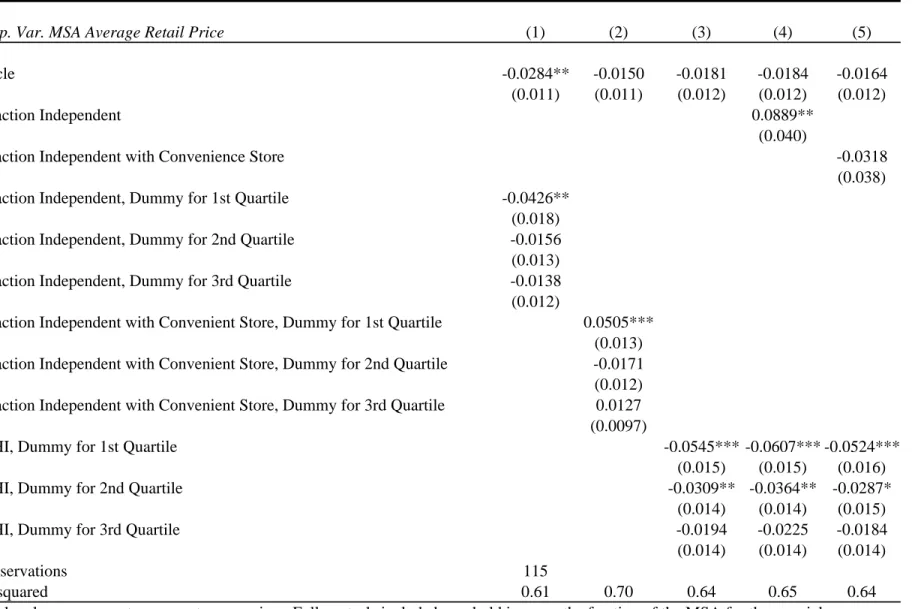
The results are reported in Table 4, and cycling is weakly related to lower prices. A cycling city is found to have lower prices by 1 to 2 cents per gallon on average
(s.e.=0.01). It appears that the cycling cities have cycles that spend roughly equal time above and below the price levels in non-cycling cities.
Controlling for cycling behavior, the fraction of independent stations is associated with higher prices in the area, whereas the fraction of independent stations with
convenient store operations is associated with lower prices. Meanwhile, HHI in the area is associated with higher prices: cities in top quartile in terms of brand concentration have prices that average approximately 5 cents per gallon. This result is robust to controls, with income level and wholesale price positively related to the retail price (see Appendix). With markups generally on the order of 5 cents per gallon in the Midwest (Brannon, 2003), such a difference appears economically significant. 22
C. Edgeworth Cycles Within Cities
Given that MSAs are defined by commuting patterns, it is not surprising that pricing pressure is likely transmitted across the MSA. However, the original Maskin and Tirole model evokes images of gasoline stations competing on a street corner, and we investigate whether cycling can be characterized at a smaller unit of analysis, namely, at the ZIP code level.
An advantage of investigating cycling behavior within cities is that we can control for fixed characteristics of MSAs that are difficult to control but may be related to both cycling behavior and market concentration, such as the regulatory environment. The fixed effects also control for regional factors, as cycling is found in the Midwest and not in the Northeast of the U.S. That said, store locations are chosen with future competition
22 Since there was a large gas price spike in the summer of 2000, we also perform a robustness check of this
result by dropping all of the observations before September 1, 2000, recalculating all of the variables from this smaller set of observations, and re-doing regressions in Table 4. The main conclusion does not change.
in mind, and convenience store operators, for example, may select areas within cities that are more prone to cycling behavior for reasons other than their pricing strategies.
To consider the source of Edgeworth cycles within and across cities, we compared 5,900 ZIP codes to describe the determinants of cycling at a smaller unit of analysis. To identify ZIP codes that cycle there are two data issues. First, the ZIP code data are more likely to suffer from missing data problems compared to measures of prices at the city level. The main results include all of the ZIP codes in the data, but results are similar when the data are restricted to ZIP codes with observations in at least 200 days out of the year. Second, it is useful for ease of interpretation to categorize ZIP codes as cycling or non-cycling, and we visually inspected the data to arrive at a median change in retail price cutoff of -0.002.23 Again, the results are similar when we use the median change in retail price itself rather than the dichotomous indicator for cycling, as well as when the cutoff remained -0.005.
The empirical models for ZIP code z in MSA m take the following form:
Yz = γ0 +γ1Wz +γ2Xz +δm ( z )+ εz (4 )
where Yz is an indicator for cycling behavior or average price in the ZIP code z and Wz is a characteristic of the ZIP code of interest from the theoretical model, such as the
presence of an independent station with a convenience store or the presence of dominant firm. In terms of ZIP code control variables, the median change in the wholesale price is included to control for input price dynamics. We also aim to separate the effect of having an independent or popular brand in the ZIP code from the number of gasoline stations by including 20 indicators for the number of stations. Further, ZIP code characteristics
23 The MSA analysis used a cutoff of -0.005. Appendix Figures A2A and A2B show the time series of
retail and wholesale prices for all ZIP codes that are categorized as cycling vs. those that are categorized as not cycling using the -0.002 cutoff.
taken from the US Census of Population in 2000 are included. Models are also reported with and without MSA fixed effects, δm(z). The models reported are estimated using OLS, although nearly identical results are found with probit models. For comparability with the earlier results and the dependence of pricing within a larger MSA market, the standard errors are clustered at the MSA level.
Table 5 reports the results for cycling behavior at the ZIP code level. The first two rows consider the presence of an independent station (either with or without major convenience store operations), with the excluded category ZIP codes with no independent stations. 38% of ZIP codes have an independent gasoline station, and 21% have a
convenience-store independent. Column (1) includes no control variables and the
presence of an independent gasoline station with significant convenience store operations is a large predictor of cycling in the ZIP code. Compared to a mean of 13%, the presence of at least one such station is associated with a 28 percentage point increase in the
likelihood of cycling (In the raw data, 38% of ZIP codes with a convenience-store independent are found to cycle compared to 6.5% of ZIP codes with no such station). The positive relationship survives the inclusion of detailed ZIP code controls, as well as MSA fixed effects (coefficient = 0.16, s.e. = 0.03). Meanwhile, the presence of an independent without convenience store operations is negatively related to cycling. In a model with MSA fixed effects, the estimates are identified from differences in the independent store locations within an MSA, and the estimated coefficient is -0.05 (s.e.=0.01).
When the sample is limited to the 20 cities, 43% of the stations in our cycling cities are in ZIP codes that are also found to cycle. Again independents are associated
with cycling only when they are a convenience-store operator as well. ZIP codes with such stations are 11 percentage points more likely to cycle.
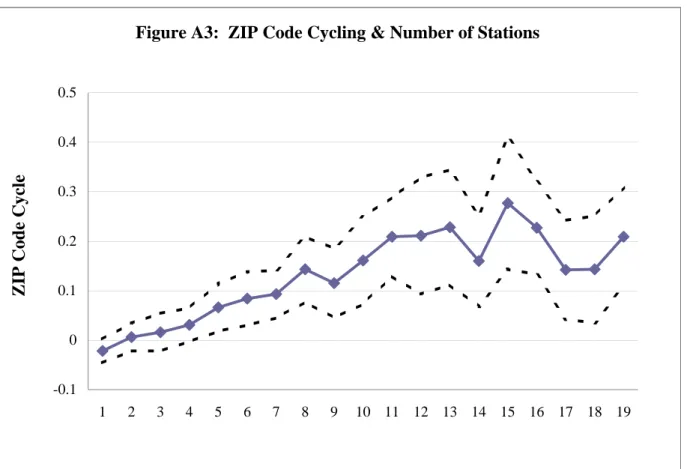
In terms of covariates, the median change in wholesale prices is negatively related to cycling, consistent with cycling being a retail market phenomenon (see Appendix). Figure A3 also shows that another measure of competition in the ZIP code, the number of stations, is positively associated with cycling. The relationship is relatively flat after 10 stations. One explanation for such a phenomenon is that as the number of stations grows, it is more likely that there will be intense competition at the (very) local level of a street corner. Taken together, it appears that convenience-store independents are associated with an increased likelihood that a city cycles.
The next two rows of Table 5 consider whether having only one “top brand” in the ZIP code reduces the likelihood of cycling compared to having two top brands. “Top brands” are defined as the two brands with the highest station shares in the city. If only one top player is in the ZIP code, it may have a higher fraction of loyal consumers who live or work nearby and they may eschew the costs of engaging in Bertrand-style price movements. Furthermore, if a subset of consumers has a preference for purchasing from a top brand, over a lesser known station, a lone top brand may enjoy some degree of brand loyalty. If more than one major brand is in the ZIP code, these consumers may switch between them depending on the prices which they set —reducing the loyalty to any given brand. The results show that having both of the top 2 brands is more predictive of cycling than having just one, consistent with the notion that it takes at least two to play the game. This result is robust to controls, including MSA fixed effects.24 These results
24 Other measures of brand overlap in a city were considered. Similar results are found when more than the
provide additional evidence that the observed cycles are indeed a product of competitive forces among large players, as opposed to some (unobserved) mechanical process that leads to price spikes.
The last set of results replicates the retail price results and is shown in Table 6.25 As in Table 4, cycling is associated with modest reductions in price (between 1 and 3 cents on average, compared to an average gas price at the time of $1.52). It appears that cycling results in prices that are more volatile, but are similar to non-cycling cities on average. Meanwhile, the presence of an independent gasoline station with a convenience store in the ZIP code is associated with somewhat lower prices (1-4 cents), whereas the evidence is mixed with regard to the presence of an independent without a convenience store, or the presence of one of the top two city brands.
D. Limitations
The MSA results are cross-sectional relationships with the usual caveats that areas with cycling behavior may simply differ compared to areas without cycling behavior. The observable characteristics look similar across the groups, however, with the
exception that the largest cities do not appear to cycle. Results are similar when cities of greater than 2 million populations are excluded. Also, the results are similar when MSA fixed effects are included to control for time-invariant characteristics of cities that might affect the competitive environment and cycling behavior. In the end, the goals of the
significantly less cycling behavior. Cycling by brand was also considered, although missing data limitations make this type of comparison less compelling.
25 The number of observations is slightly different in Table 6 compared to Table 5 due to missing data for
the change in wholesale price in the set of controls used in Table 5. Results are nearly identical when this variable is excluded and the same sample is used for both Tables.
empirical exercise are more descriptive in nature, although the findings appear reasonable given the results described in the Section 2.
Second, the data are limited by the frequency of missing observations, especially for weekends. Aggregate city level data should categorize cities that cycle versus those that do not. In addition, the results are similar when the sample is limited to stations that are frequently seen in the data. 26 It appears that our sample has sufficient coverage over the course of the year to characterize brand concentration.
Another limitation is the lack of quantity data results in measures of concentration at the station-share level rather than the usual market share for each brand. To the extent that station shares reflect some minimum quantity before a franchise is allowed to open, it seems likely that such station shares are sufficiently highly correlated with quantity shares to serve as a reliable proxy for HHI. In any event, the station shares provide slightly different measure of concentration, but one that reflects geographic coverage of the brands.
Last, the cycling behavior is found in the Midwest, largely in Ohio, Michigan, Indiana, and Illinois. The shape of the relationships described in the larger sample is robust to limiting the sample to stations only in the Midwest, and we find that the cities in the eastern U.S. provide a useful comparison group.27
V. Conclusion
26 The results are generally robust to limiting the sample to ZIP codes with at least 2, 4, and 6 gasoline
stations in our pricing sample. See Appendix Table A2.
27 In our sample, Midwest states are Indiana, Illinois, Iowa, Kansas, Michigan, Minnesota, Missouri,
Retail gasoline markets are unique in that the price for the product is broadcast for all to see, including competitors. This facilitates price competition, and a striking feature of these markets is that some exhibit what appear to be Edgeworth cycles. A refinement to the Maskin-Tirole model that allows firms to retain some customers even when they are underbid suggests that markets with dominant firms may not have the incentive to enter such a cycle. Further, a necessary condition for such tacit collusion is that the firms have some market power, and the least concentrated markets may not be able to support such cycles either.
The empirical results use a dataset of daily prices across 115 cities to describe the types of cities that exhibit cycling behavior. 17% of cities in our sample have price cycles. In contrast to evidence presented in prior work, our results suggest that cities with more independent stations are found less likely to cycle. When independent stations with significant convenience store operations are considered, however, a greater
proportion of such stations are related to cycling. This correlation with convenience-store independents and cycling behavior is found within cities as well: ZIP codes with such stores much more likely to have cycling. Given the complementary goods and the price salience of the gasoline price, the results are consistent to the prediction that these stations may have an incentive to engage in price reductions that can lead to the cycling behavior.
Further, the results suggest that the least and most concentrated cities are less likely to cycle. Meanwhile, cycling behavior is not found to result in higher or lower retail prices. These results are found controlling for city characteristics such as income levels, commuting patterns, changes in wholesale prices, as well as models that use
within-city variation in concentration and cycling behavior. It appears that a main characteristic that describes which cities exhibit Edgeworth cycles is the extent to which the market is concentrated.
References
Atkinson, B. “Retail Gasoline Price Cycles: Evidence from Guelph, Ontario Using Bi-Hourly, Station-Specific Retail Price Data,” working paper
Borenstein, S., C. Cameron and R. Gilbert. (1997) “Do Gasoline Prices Respond Asymmetrically to Crude Oil Price Changes?,” Quarterly Journal of Economics. 112, 306 – 339.
Brannon, I. (2003) “The Effects of Resale Price Maintenance Laws on Petrol Prices and Station Attrition: Empirical Evidence from Wisconsin.” Applied Economics. 35(3). Februrary 2003: 343-349.
Deltas, George, “Retail Gasoline Price Dynamics and Local Market Power.” Journal of
Industrial Economics. forthcoming.
Doyle, J. and K. Samphantharak. (2008) “$2.00 Gas! Studying the Effects of Gas Tax Moratorium Across State Borders.” Journal of Public Economics April.
Eckert, A. (2003). “Retail Price Cycles and the Presence of Small Firms,” International Journal of Industrial Organization, 21, 151-170.
Lewis, M. (2008). ``Temporary Wholesale Gasoline Price Spikes have Long Lasting Retail Effects: The Aftermath of Hurricane Rita," working paper.
Maskin, E. and J. Tirole (1988). “A Theory of Dynamic Oligopoly, II: Price Competition, Kinked Demand Curves, and Edgeworth Cycles,” Econometrica, 56, 571-599.
Noel, M. (2007a). “Edgeworth Price Cycles, Cost-based Pricing and Sticky Pricing in Retail Gasoline Markets,” Review of Economics and Statistics, 89, 324-334.
Noel, M. (2007b). “Edgeworth Price Cycles: Evidence from the Toronto Retail Gasoline Market,” Journal of Industrial Economics, 55, 69-92.
Noel, M. (2008). “Edgeworth Price Cycles and Focal Prices: Computational Dynamic Markov Equilibria,” Journal of Economics and Management Strategy, 17, 345-377. Shepard, A. (1993). “Contractual form, retail price, and asset characteristics in gasoline retailing,” Rand Journal of Economics 24(1), 58-77.
Slade, M. E. (1998). “Strategic Motives for Vertical Separation: Evidence from Retail Gasoline
Markets” Journal of Law, Economics, and Organization, 14(1), 84-113.
Taylor, B.A. (2000). “Retail Characteristics and Ownership Structure” Small Business
Appendix
Proposition 1 Proof: Let {R1(p-1t), R2(p-2t),…, RN(p-Nt)} be a set of reaction functions exhibiting cycling behavior and consider the derivative with respect to αi of firm i’s expected profits earned by playing Ri(p-it) and by playing pi*. Since pi* maximizes profits from the share of “loyal” customers, αi ,
i it it i i i i t i t p V p q c p E α α α δ α ∂ ∂ > ∂ ⎥ ⎦ ⎤ ⎢ ⎣ ⎡ − ∂ − ∞ =
∑
( ) ( *) ( ) 0 * . (2)Thus, a change in the share of loyal customers increases the profits associated with playing pi* more than the profits associated with playing Ri(p-it).
Corollary 2 Proof: Let Ri(p-it) be a reaction function exhibiting cycling behavior and consider a deviation from Ri(p-it) to a strategy in which the firm always plays pi*. Let
and denote the expected profits from loyal customers and firm-switchers when firm i plays R
) ( it it p
Vα − Vit (p−it)
β
i(p-it).28 Define as the constant price which provides the firm the same expected profits from loyal customers as the cycling equilibrium
i pˆ 29. By definition, pˆisolves ) ( ) ˆ ( ) ˆ ( 0 it it i i i t i t p V p q c p E − ∞ = = ⎥ ⎦ ⎤ ⎢ ⎣ ⎡
∑
δ − α α (3)A firm will prefer to play pi* to Ri(p-it) if and only if
) ( ) ( ) ( )] , ( )[ ( * * 0 * it it it it i it i i i i t i t p V p V p q p p c p E − − − ∞ = + ≥ ⎥ ⎦ ⎤ ⎢ ⎣ ⎡
∑
δ − α +β α β (4)28 For expositional purposes, we assume that γ
i=0 – we find an identical result allowing γi>0.
29 Note that is a function of both the vector of reaction functions as well as the vector of starting prices. i
Consider αi,βi∈(0,1) satisfying ) ˆ ( ) ˆ ( ) ˆ ( ) ˆ ( ) ( ) ( * * i i i i i i i i i i i p c q p p q c p p q c p − − − − = α β (5) Rearranging (4), we have ) ˆ ( ) ˆ ( ) ˆ ( ) ˆ ( ) ( ) ( 0 0 * 0 * i i i t i t i i i t i t i i i t i t p q c p p q c p p q c p α δ α δ β δ − =
∑
− +∑
−∑
∞ = ∞ = ∞ = (6) The left hand side of (6) is the expected profits earned from loyal consumers by a firm playing pi* in all periods. The first term on the right hand side is equal toand the second term in the right hand side is strictly greater than by definition of ) ( it it p Vα − ) ( it it p Vβ − i
β . Thus, values of αi, β satisfy condition (5) implying that firm i prefers to play pi i *
to Ri(p-it).
Proposition 3 Proof: Consider a firm choosing between Ri(p-it) and pi*. By definition, the derivative of profits associated with playing pi* and Ri(p-it) with respect to γi are respectively, ⎥ ⎦ ⎤ ⎢ ⎣ ⎡ +
∑
∞ =0 − *, )) ( ( t it i i i t p p E δ α β (7) i it it i it it p W p W γ γ β α ∂ ∂ + ∂ ∂ ( − ) ( − ) (8) Noting that ⎥ ⎦ ⎤ ⎢ ⎣ ⎡ = ∂ ∂∑
∞ = − 0 ) ( ) ( t i t i it it E p W δ α γ α, the difference in the derivative of profits is given by the relative proportion of firm switching consumers obtained by pi* and Ri(p-it). Since playing cycling strategy Ri(p-it) allows a firm to obtain a greater proportion of firm-switching customers than playing pi* , for which firm i receives βi(pi* , R-it(pi*)), an
increase in γi has a greater effect of firm profits when the firm plays a cycling strategy than when the firm plays a non-cycling strategy.
Figure 1A: Average Gasoline Prices in Toledo, OH
0 0.5 1 1.5 2 2.5 date 351803520635242352673529335319353433537035393354113542935447354653548335501Figure 1B Gasoline Price Movements Toledo, OH 0 0.5 1 1.5 2 2.5 date 351803520635242352673529335319353433537035393354113542935447354653548335501 Retail Average Wholesale Average
Detroit-Ann Arbor-Flint, MI 0 0.5 1 1.5 2 2.5 date 351803520635242352673529335319353433537035392354103542835447354653548335501 Retail Average Wholesale Average
Lincoln, NE 0 0.5 1 1.5 2 2.5 date 351803520635242352673529335319353433537035394354123543135449354673548535503 Retail Average Wholesale Average
Johnstown, PA 0 0.5 1 1.5 2 2.5 date 351803520635242352673529335319353433537035394354123543035448354663548435502 Retail Average Wholesale Average
Local linear regression estimates, with a pilot bandwidth of 0.05. Concentration ratios use the share of stations in a city that belong to a particular brand. N=115 MSAs.
Figure 2A: Likelihood of Cycling vs. 1 Brand Concentration Ratio
0 0.05 0.1 0.15 0.2 0.25 0.3 0.35 0 0.1 0.2 0.3 0.4 0.5 0.6
Figure 2B: Likelihood of Cycling vs. 3-Brand Concetration Ratio
0 0.05 0.1 0.15 0.2 0.25 0.3 0.35 0 0.2 0.4 0.6 0.8 1
Figure A1A: Retail & Wholesale Prices over Time Cutoff City with Median Change in Retail Price At the
Cutoff: -0.005 0 0.2 0.4 0.6 0.8 1 1.2 1.4 1.6 1.8 2 4/3/2000 7/5/2000 9/23/2000 12/8/2000 2/4/2001
Retail Price Wholesale Price
Figure A1B: Retail & Wholesale Prices over Time City with Median Change in Retail Price at An
Alternative Cutoff: -0.004 0 0.5 1 1.5 2 2.5 4/3/2000 7/5/2000 9/23/2000 12/8/2000 2/4/2001
Figures pooled data across all cycling cities, using ZIP codes with at least 200 days of data over the course of the year. Cycling indicator equals 1 if the median change in retail price in the ZIP code is less than -0.002.
Table A2A: ZIP Codes Categorized as Cycling in Cycling Cities 0 0.5 1 1.5 2 2.5 4/3/2000 7/5/2000 9/23/2000 12/7/2000 2/3/2001
Retail Price Wholesale Price
Table A2B: ZIP Codes Categorized as Not Cycling in Cycling Cities 0 0.5 1 1.5 2 2.5 4/3/2000 7/5/2000 9/23/2000 12/6/2000 2/2/2001 retail_average wholesale_average
Notes: Points represent coefficients from model reported in Table 5, Column (3): a
regression of zip code cycling with full controls and MSA fixed effects. Excluded category includes ZIP codes with 1 gasoline station. Dashed lines represent 95% confidence intervals.
Figure A3: ZIP Code Cycling & Number of Stations
-0.1 0 0.1 0.2 0.3 0.4 0.5 1 2 3 4 5 6 7 8 9 10 11 12 13 14 15 16 17 18 19 Z IP Cod e Cycle
Variable Mean Std. Dev. Min Max Mean Std. Dev. Min Max
Gasoline Prices Median Daily Change in Retail Price -0.008 0.002 -0.012 -0.005 -0.002 0.001 -0.005 0.000
Average Daily Retail Gas Price 1.48 0.04 1.40 1.54 1.49 0.07 1.37 1.66
Average Daily Wholesale Gas Price 0.93 0.02 0.91 0.97 0.93 0.03 0.88 1.00
Gasoline Stations Number of Stations 272 237 33 969 255 388 15 2337
Fraction of Independent Stations 0.18 0.08 0.10 0.38 0.17 0.13 0 0.68
Fraction of Independent Stations w. Conv. Store 0.15 0.05 0.08 0.31 0.09 0.11 0 0.64
Brand Concentration HHI 1119 349 334 1617 1168 701 55 3082
Fraction of Top Three Brands 0.51 0.09 0.280 0.638 0.50 0.19 0.105 0.957
Census Characteristics Population Density (per sq. mile) 1420 737 408 3020 1583 2307 177 20216 Median Income (Thousand $) 41.399 3.058 34.222 46.116 40.573 5.821 28.117 54.751
Commuting Drive alone 0.83 0.02 0.795 0.857 0.80 0.046 0.547 0.87
(of Working Population) Public Transportation 0.01 0.01 0.003 0.040 0.02 0.033 0.002 0.27
Race White 0.85 0.04 0.78 0.93 0.86 0.10 0.52 0.97
(of Total Population) Black 0.10 0.03 0.04 0.16 0.08 0.08 0.00 0.43
Hispanic 0.03 0.02 0.01 0.06 0.03 0.03 0.00 0.18
Education Less than Highschool 0.17 0.02 0.11 0.20 0.17 0.04 0.07 0.32
(of Population Some College 0.28 0.03 0.23 0.34 0.26 0.04 0.18 0.33
over 25 years old) College 0.21 0.05 0.12 0.30 0.23 0.07 0.11 0.46
Cycling MSAs (Number of Obs. = 20) Non-Cycling MSAs (Number of Obs. = 95)
Variable Obs Mean Std. Dev. Min Max
1st Quartile
Cycle 29 0 0 0 0
Median Difference in Daily Retail Prices 29 -0.002 0.001 -0.004 0.000
Fraction of Independent Stations 29 0.041 0.026 0.000 0.079
2nd Quartile
Cycle 29 0.310 0.471 0 1
Median Difference in Daily Retail Prices 29 -0.003 0.003 -0.010 0.000
Fraction of Independent Stations 29 0.119 0.020 0.079 0.152
3rd Quartile
Cycle 29 0.310 0.471 0 1
Median Difference in Daily Retail Prices 29 -0.004 0.004 -0.012 0.000
Fraction of Independent Stations 29 0.197 0.031 0.153 0.256
4th Quartile
Cycle 28 0.071 0.262 0 1
Median Difference in Daily Retail Prices 28 -0.002 0.002 -0.006 0.000
Fraction of Independent Stations 28 0.350 0.095 0.258 0.679
1st Quartile
Cycle 29 0 0 0 0
Median Difference in Daily Retail Prices 29 -0.001 0.001 -0.003 0.000
Fraction of Independent Stations w/ Conv. Store 29 0.002 0.004 0.000 0.012
2nd Quartile
Cycle 29 0 0 0 0
Median Difference in Daily Retail Prices 29 -0.002 0.001 -0.004 0.000
Fraction of Independent Stations w/ Conv. Store 29 0.042 0.019 0.013 0.081
3rd Quartile
Cycle 29 0.414 0.501 0 1
Median Difference in Daily Retail Prices 29 -0.004 0.003 -0.010 0.000
Fraction of Independent Stations w/ Conv. Store 29 0.114 0.021 0.082 0.146
4th Quartile
Cycle 28 0.286 0.460 0 1
Median Difference in Daily Retail Prices 28 -0.003 0.003 -0.012 0.000
Fraction of Independent Stations w/ Conv. Store 28 0.241 0.106 0.147 0.641
1st Quartile
Cycle 29 0.138 0.351 0 1
Median Difference in Daily Retail Prices 29 -0.002 0.002 -0.010 0.000
HHI 29 373 223 55 683
2nd Quartile
Cycle 29 0.138 0.351 0 1
Median Difference in Daily Retail Prices 29 -0.003 0.003 -0.009 0.000
HHI 29 964 125 684 1167
3rd Quartile
Cycle 29 0.310 0.471 0 1
Median Difference in Daily Retail Prices 29 -0.004 0.003 -0.012 0.000
HHI 29 1308 87 1170 1466
4th Quartile
Cycle 28 0.107 0.315 0 1
Median Difference in Daily Retail Prices 28 -0.002 0.003 -0.010 0.000
HHI 28 2022 471 1484 3082
Panel A: By Fraction of Independent Stations
Panel C: By HHI of Brands
Panel B: By Fraction of Independent Stations w/ Convenience Store Table 2: Mean of Cycle and Median Difference in Daily Retail Prices
(1) (2) (3) (4) (5) (6) (7)
Fraction Independent 0.0616 -0.0150
(0.29) (0.27)
Fraction Independent with Convenience Store 0.773* 0.724*
(0.39) (0.40)
Fraction Independent, Dummy for 1st Quartile -0.110 (0.088) Fraction Independent, Dummy for 2nd Quartile 0.216* (0.11) Fraction Independent, Dummy for 3rd Quartile 0.176*
(0.098)
Fraction Independent with Convenient Store, Dummy for 1st Quartile -0.323*** (0.098) Fraction Independent with Convenient Store, Dummy for 2nd Quartile -0.266***
(0.092) Fraction Independent with Convenient Store, Dummy for 3rd Quartile 0.0969 (0.13)
HHI, Dummy for 1st Quartile 0.122 0.123 0.0645
(0.11) (0.11) (0.11)
HHI, Dummy for 2nd Quartile 0.0767 0.0776 0.0232
(0.11) (0.11) (0.11)
HHI, Dummy for 3rd Quartile 0.253** 0.253** 0.218*
(0.11) (0.11) (0.11)
Observations 115
R-squared 0.18 0.21 0.28 0.35 0.23 0.23 0.25
Table 3: Competition and Cycling
Each column represents a separate regression. Full controls include household income, the fraction of the MSA for three racial categories, three educational-attainment categories, four commuting mode categories, median income, population size, and the median change in the wholesale price. Robust standard errors in parentheses, *** p<0.01, ** p<0.05, * p<0.10.
(1) (2) (3) (4) (5) (6) (7)
Fraction Independent 0.000892 0.00163
(0.0019) (0.0017)
Fraction Independent with Convenience Store -0.00711** -0.00672**
(0.0028) (0.0028)
Fraction Independent, Dummy for 1st Quartile -0.0000253 (0.00067) Fraction Independent, Dummy for 2nd Quartile -0.00156**
(0.00072) Fraction Independent, Dummy for 3rd Quartile -0.00183***
(0.00069)
Fraction Independent with Convenient Store, Dummy for 1st Quartile 0.00307*** (0.00072) Fraction Independent with Convenient Store, Dummy for 2nd Quartile 0.00162** (0.00069) Fraction Independent with Convenient Store, Dummy for 3rd Quartile -0.000416 (0.00086)
HHI, Dummy for 1st Quartile -0.000771 -0.000890 -0.000239
(0.00080) (0.00080) (0.00079)
HHI, Dummy for 2nd Quartile -0.000932 -0.00103 -0.000436
(0.00080) (0.00079) (0.00079)
HHI, Dummy for 3rd Quartile -0.00192** -0.00198** -0.00160**
(0.00079) (0.00079) (0.00077)
Observations 115
R-squared 0.23 0.28 0.31 0.43 0.28 0.28 0.33
Table 3: Competition and Cycling, Cont.
Each column represents a separate regression. Full controls include household income, the fraction of the MSA for three racial categories, three educational-attainment
categories, four commuting mode categories, median income, population size, and the median change in the wholesale price. Robust standard errors in parentheses, *** p<0.01,
Dep. Var. MSA Average Retail Price (1) (2) (3) (4) (5)
cycle -0.0284** -0.0150 -0.0181 -0.0184 -0.0164
(0.011) (0.011) (0.012) (0.012) (0.012)
Fraction Independent 0.0889**
(0.040)
Fraction Independent with Convenience Store -0.0318
(0.038) Fraction Independent, Dummy for 1st Quartile -0.0426**
(0.018) Fraction Independent, Dummy for 2nd Quartile -0.0156 (0.013) Fraction Independent, Dummy for 3rd Quartile -0.0138 (0.012)
Fraction Independent with Convenient Store, Dummy for 1st Quartile 0.0505*** (0.013) Fraction Independent with Convenient Store, Dummy for 2nd Quartile -0.0171 (0.012) Fraction Independent with Convenient Store, Dummy for 3rd Quartile 0.0127 (0.0097)
HHI, Dummy for 1st Quartile -0.0545*** -0.0607*** -0.0524*** (0.015) (0.015) (0.016)
HHI, Dummy for 2nd Quartile -0.0309** -0.0364** -0.0287*
(0.014) (0.014) (0.015)
HHI, Dummy for 3rd Quartile -0.0194 -0.0225 -0.0184
(0.014) (0.014) (0.014)
Observations 115
R-squared 0.61 0.70 0.64 0.65 0.64
Each column represents a separate regression. Full controls include household income, the fraction of the MSA for three racial categories, three educational-attainment categories, four commuting mode categories, median income, population size, and average wholesale price. Robust standard errors in parentheses, *** p<0.01, ** p<0.05, * p<0.10.