DYNAMIC MODELING OF SHENZHEN'S REAL ESTATE MARKET
--
UNDERSTANDING THE OSCILLATION AND TREND
by MASSA
E
JIM JINZHOU QIAN
OF TECHNOLOGYBachelor of Commerce
JUN
18
2014
University of British Columbia, 2010
SUBMITTED TO TiHE MIT SLOAN SCHOOL OF
LIBRARIES
MANAGEMENT IN PARTIAL FULFILLMENT OF THE REQUIREMENTS FOR THE DEGREE OF
MASTER OF SCIENCE IN MANAGEMENT STUDIES AT THE
MASSACHUSETTS INSTITUTE OF TECHNOLOGY
JUNE 2014
C Jim J. Qian, 2014. All Rights Reserved.
The author hereby grants to MIT permission to reproduce and to distribute publicly paper and electronic copies of this thesis document in whole or in part in any medium now known or
hereafter created.
Signature redacted
Signature of Author: _MIT Sloan School of Management
May 9, 2014
Certified By:
Accepted By:
Signature redacted
Robert Nachtrieb MIT Sloan Senior Lecturer Thesis Supervisor
Signature redacted
(I
Michael A. CusumanoSMR Distinguished Professor of Management Program Director, M.S. in Management Studies Program MIT Sloan School of Management
Dynamic Modeling of Shenzhen's Real Estate Market
--
Understanding the Oscillation and Trend
By
Jim Jinzhou Qian
Submitted to the MIT Sloan School of Management on May 9, 2014 in partial fulfillment of the requirements for the degree of
Master of Science in Management Studies
ABSTRACT
This thesis studies the causes of long term market oscillations in real estate markets. It tries to answer the question whether Shenzhen's real estate property prices are driven by speculation and will experience "chronic cyclical instability" as seen in many other markets (Sterman, 2000). The real estate model introduced in this paper extends John Sterman's Commodity Model to accommodate the durable nature of real-estate, and introduces features of price speculation. The model is tested and calibrated against California housing market data from 1980 to 2014, and then applied to Shenzhen's real estate market data from 2002 to 2012.
Simulation results show a good match between simulated output and historical records for California, both when speculation is included and when it is omitted. This model suggests that speculative demand is not actively linked to price trends, and that the repeated oscillation in price and construction is consistent with chronic instability caused by long delays in construction capacity development and fast price hill-climbing process. Speculation's influence on price and construction overshoot and undershoot is minimal.
Analyzing Shenzhen's market behavior through this model reveals that government regulations intended for controlling real estate speculation activities actually contributed to market instability. Demonstrating the dynamics of policy resistance, the "unutilized land fee" that intended to speed up the supply of building space to market in fact drove developers to slow down construction, so they could capture gains from rising prices. Government limits on the release of undeveloped land, intended to suppress speculative investment, in fact enabled the dynamic for a long rally in price and slowed construction at the same time. Shenzhen's real estate is expected to experience oscillations in the coming decade just like other regions' markets.
Thesis Supervisor: Robert Nachtrieb Title: MIT Sloan Senior Lecturer
ACKNOWLEDGEMENT
First and above all, I would like to thank my thesis advisor, Dr. Robert Nachtrieb. The countless hours he spent with me discussing the model design and simulation runs are crucial for the completion of this thesis. His insight in system dynamics and economic systems really helped me understand the topic I'm studying. Robert is the best advisor a student could ask for, and what he has taught me is going to help me throughout my life.
I would thank my wife, Jessica Wang, for keeping me company during my time in MIT and giving me full support when I devoted all my time into writing this thesis. I would not be here without her encouragement.
I would also thank my parents for supporting me in completing my MSMS degree. Without them, none of this would have been possible. I would thank my in-laws as well for sharing their knowledge and experience in thesis writing with me. I hope all of you are proud of me.
Last but not least, I would thank Professor John Sterman and Hazhir Rahmandad for introducing me to the fascinating world of system modeling in their system dynamics classes.
Table of Contents
IN TR O D U C TION ...
10
Problem Definition...11
M ethod...12
SHENZHEN AND ITS GROWTH ... 14
Ten Districts of Shenzhen...15
Real Estate Price ... 20
Population Composition... 21
Average Incom e Growth...22
Property Development Investm ent and Land Supply ... 24
Lim itations in D ata Availability ... 27
M O D EL D ESIG N ...
.
...
..
...
... ...
.. ....
... ... ... 30
Overview of the Generic Real Estate M odel ... 33
Construction and Stock M odule... ... 36
Capacity M odule...42
Dem and M odule ... 45
Price M odule...48
Speculation Dem and...51
Scope of the M odel...53
MODEL TESTING USING CALIFORNIA DATA ...
...
55
Real Estate M odel Testing W ithout Speculation Behavior... 55
Real Estate M odel Testing W ith Speculation Added... 59
California Housing M arket Projection... 62
ANALYZING SHENZHEN REAL ESTATE MARKET ...
.
...
65
Shenzhen M odel Setup ... 65
Shenzhen M odel Simulation Run ... 66
Shenzhen Real Estate Projection ... 73
C O N C LU SIO N ...
.
...
.
.. ...
... ...
77
W orks Cited ...
....
...
...
79
Appendix ..
...
....
... ....
... ...
81
LIST OF FIGURES AND TABLES
Figure 1 Shenzhen's Geographic Location 02013 Google ... 14
Figure 2 Administrative Districts of Shenzhen... 15
Figure 3 Breakdown of Land Auctioned by District ... 18
Figure 4 Land Auctioned by District and Purpose... 19
Figure 5 Comparing Baoan, Longgang and Nanshan District... 20
Figure 6 Shenzhen Average Property Price ... 21
Figure 7 Shenzhen Population ... 22
Figure 8 Shenzhen GDP per Capita...
23
Figure 9 Accumulated Resident Saving... 23
Figure 10 Supply of Undeveloped Land by Shenzhen Government ... 25
Figure 11 Building Area Under Construction... 25
Figure 12 Building Area Construction Completion... 26
Figure 13 Time to Complete Construction ... 26
Figure 14 Investment in Real Estate by Project Type... 27
Figure 15 Supply and Demand Balance with Speculation... 31
Figure 16 Overview of the Generic Housing Model ... 35
Figure 17 Construction and Stock Module ... 37
Figure 18 Table for Order Fulfillment Ratio (Sterman, 2000) ... 40
Figure 19 Table for Effect of Markup on Utilization (Sterman, 2000) ... 42
Figure 20 Construction Capacity ... 43
Figure 21 D esired Capital... 43
Figure 22 Unit Land Value ... 44
Figure 23 Effect of Expected Profit on Desired Capacity (Sterman, 2000) ... 44
Figure 24 Customer Order Component... 46
Figure 25 Adjustment for Primary Home Demand... 47
Figure 26 Price M odule ... 50
Figure 27 Speculation Demand... 52
Figure 28 Simulated Price Level vs. Actual Index Level ... 56
Figure 29 Simulated Construction Start Rate vs. Actual Home Construction Permit A uthorized ... 56
Figure 30 U.S. 30 Year Mortgage Rate ... 57
Figure 31 Homes Available for Purchase ... 58
Figure 32 Homes Unavailable for Purchase ... 58
Figure 33 Customer Orders of Homes ... 59
Figure 34 Simulated Price Level vs. Actual Index Level... 60
Figure 35 Simulated Construction Start Rate vs. Actual Home Construction Permit A uthorized... 60
Figure 36 Homes Available for Purchase ... 61
Figure 37 Homes Unavailable for Purchase ... 61
Figure 38 Customer Orders of Homes ... 62
Figure 39 California Home Price Projection ... 63
Figure 40 California Home Construction Projection... 63
Figure 41 SZ Average Land Value ... 66
Figure 42 SZ Simulated vs. Actual Unit Building Area Price ... 66
Figure 44 SZ Simulated vs. Actual Construction Completion Rate ...
68
Figure
45 SZ Construction Start Rate...
68
Figure 46 SZ Capacity Utilization ...
69
Figure 47 SZ Construction Capacity...
69
Figure 48 SZ Desired Capital ...
70
Figure 49 SZ Expected Profitability of New Investment...
70
Figure 50 Shenzhen Simulated Customer Orders ...
72
Figure 51 Shenzhen Simulated Building Area Available for Purchase... 72
Figure 52 Shenzhen Simulated Inventory Coverage ...
73
Figure
53
Shenzhen Unit Building Area Price Projection...
74
Figure 54 Shenzhen Construction Completion Rate Projection ...
74
Figure
Page
Table 1 Shenzhen GDP Breakdown (Billion RMB/Year) and Growth (%/Year)... 16
Table 2 Simulation Run Parameter Settings ...
76
Table 3 Shenzhen Land Auction Record ...
113
INTRODUCTION
A real estate market is an inherently complex system. Even in highly developed markets such as the U.S., the question of whether an increase in demand and investment is rational or speculative could be hard to determine. From 1994 to 2005, subprime mortgage loan's share of total home mortgage issued grew from less than 5 percent to 20 percent, and these lower quality loans were packed into mortgage-backed
securities (Barth, Li, & Phumiwasana, 2008). The integration of financial instruments into the housing market made real estate systems even harder to analyze. Jay Forrester explained in his book the counterintuitive nature of the outcomes of economic systems such as the one we are studying:
Complex systems have special responses which cause many of the failures and frustrations experienced in trying improve their behavior... the phrase 'complex system' refers to a high-order, multiple-loop, nonlinear feedback structure. All social systems belong to this class (Forrester, 1969).
Many studies based on existing statistics models were performed prior to 2008, trying to understand the causal relationship of the price movement, but "[flinding instruments or counter-factual evidence to rule out investment buying in this case, however, seems hopelessly difficult (Wheaton & Nechayev, 2008)." For new markets with limited history, such as China, it is crucial to understand the driving force behind its long term market trend.
Real estate assets are purchased for both consumption and investment purpose (Zhao, 2013). The Chinese real estate market has been booming for over two decades, and there is a growing concern that a property bubble is on the brink of burst (Zhao, 2013). Construction related businesses account for a large
percentage of the economic activity in China, and the purchase of properties is one of the most important channels of investment for ordinary Chinese people. According to Ju Zhao, in 2010, real estate related
investment accounted for 13.04% of China's GDP; and in 2005, housing property accounted for 61.13% of household asset for a typical Chinese family (Southern Metropolis Daily, 2011). On one hand, building
area accumulation is a sign of economic development of a region and one of the most fundamental resources of future growth in productivity and living standard. On the other hand, when developed and priced at a level mismatched to the real economic and population needs, this could also be a recipe for a
disaster (Barth, Li, & Phumiwasana, 2008). It is of great interest of policy makers, economists and
businesses to understand the fundamental forces driving the building boom in China, and develop a model to examine how different factors interact with each other over time. This paper focuses its study on the Shenzhen market, for the fact that this is a very young city with more reliable data available.
Problem Definition
There is a constant debate in China on whether the prolonged real estate fever is the result of a speculative bubble or is backed by concrete demand because of the economic boom since the "open door policy" of
1978 (Xu, 2012). This debate is hard to settle because there just isn't enough historical data to justify either claim. A statistics oriented model will not be very helpful if the trend has always been going up and there is no "turning point" in historical record. To solve this problem, this paper turns to the fundamental driving forces and dynamics of the system instead, trying to capture the essence of the rapid accumulation in building stock and appreciation in price.
We want to develop an understanding of the Shenzhen real estate market to answer the question whether we are going to see a price and construction crash like what we have seen in the U.S. during the 2008 crisis (DeLong, 2011). The goal is to study the Shenzhen real estate market on a very fundamental level to see whether its reinforcing mechanisms in investment and demand would take over the system, causing a bubble to expand exponentially and then head for a crash, or that there are sufficient balancing
Method
This paper looks at this question from a supply and demand balance perspective, using system dynamics modeling to simulate the behavior of the real estate market. A generic property market dynamic model is developed and tested against California's housing market data, and applies the understanding gained from this procedure on real estate cycles to explain the behavior and makes a projection for one of China's property markets - Shenzhen. The main methodology used to analyze the expansion of the Shenzhen real estate market is system dynamics modeling. Such a model works for two purposes. First is to qualitatively understand the dynamics and driving force of the building area accumulation process. Second is to quantitatively test the theory with historical data. Dynamic modeling visualizes how the process of property development takes place, and offers a solution to easily manipulate individual or a group of variables and see the impact on property development speed and price movement at real time. The rapid price increase and accumulation of building area in Shenzhen is not caused by one single factor, and different time delays in different part of this dynamic makes the system even more complex. It is necessary to see the effect of each variable over an extended period of time, in a way that is highly visualized, so that all stake holders can easily understand the impact of each variable.
This paper develops a generic real estate model that captures the dynamics of the Shenzhen real estate market. It will not only provide a qualitative understanding of the mechanism of the system, but also allow model calibration with historical data, so that the model can be used quantitatively to test theories and show trends. However, this model does not aim to make point predictions of any kind. The trend projection that is described in this paper is only for discussion of the market characteristics. This thesis first tests and calibrates this model based on more detailed California data, and then applies the
The real estate model introduced in this paper extends John Sterman's Commodity Model to
accommodate the durable nature of real-estate, and introduces features of price speculation (Sterman, 2000). It simulates the market behavior through mimicking the delicate balance between demand and supply, which determines the price and then alters investment and customer order. This paper uses data from very different real estate markets across different time scale to demonstrate how the current understanding about commodity markets would provide useful insights into real estate markets as well.
SHENZHEN AND ITS GROWTH
Established in March of 1979, neighboring Hong Kong and Macau, with a compounded annual growth rate (CAGR) in GDP of 19% from 2002 to 2012, Shenzhen is a young city that is making a big impact globally with its enormous export oriented economy (NBSC, 2014).
Figure 1 Shenzhen's Geographic Location 02013 Google
It is China's first experiment city for economic reform, home to Shenzhen Stock Exchange, and where the
iPhones are made. In 2012, Shenzhen recorded a GDP of USD $205.5 Billion (NBSC, 2014), which was
comparable to Portugal's USD $212.4 Billion of the same year (IMF, 2014).
Shenzhen's high economic growth is followed by fast real estate property value appreciation. In preparation of model design and analysis, this chapter studies the foundations of Shenzhen's real estate market through data collected on population, economic output, income and real estate related investment.
Ten Districts of Shenzhen
The city of Shenzhen is located to the north of Hong Kong, East of Macau, and South of Guangzhou. It covers a total land area of 1,911.64 square kilometers, and consists of ten administrative districts (SZ Government Online, 2014). They are Baoan, Longgang, Nanshan, Pingshan, Guangming, Longhua, Yantian, Futian, Luohu and Dapeng, as shown in Figure 2.
GDP
Construction
E
Service U Residential N Industrial E ManufacturingI
Commercial E Agriculture a Office III infrastructureFigure 2 Administrative Districts of Shenzhen
Each of the ten districts of Shenzhen have their distinctive roles in its social and economic system. We will briefly describe the city as a whole, then focus on three economically important districts.
In 2012, Shenzhen's total GDP of RMB Y1295 Billion could be broken down into a matrix of administrative districts and industry types (Longhua and Daping excluded because of limited data):
Region GDP total Agriculture Manufacturing Service Shenzhen 1295 10.0% 0.6 -18.2% 573.8 7.3% 720.7 12.3% Total Baoan 299.5 6.3% 0.1 -7.9% 167.3 0.9% 132.2 15.9% Nanshan 283.0 11.6% 0.1 -27.5% 166.8 10.6% 116.1 13.1% Futian* 237.4 9.0% 0.1 50.8% 18.6 4.8% 218.7 9.4% Longgang 217.7 10.8% 0.1 -15.0% 141.9 10.8% 75.7 10.9% Luohu* 135.9 8.6% 0.0 -16.1% 10.7 5.6% 125.2 8.9% Guangming 50.4 25.1% 0.1 -7.9% 36.2 26.7% 14.2 17.0% Yantian* 36.6 10.0% 0.0 -53.2% 7.5 2.7% 29.1 12.4% Pingshan 34.5 15.2% 0.1 -15.0% 24.8 15.4% 9.6 15.2%
Table 1 Shenzhen GDP Breakdown (Billion RMB/Year) and Growth (%/Year)
From Table 1, we can conclude that in 2012, Shenzhen's agriculture output is minimal and shrinking, but both manufacturing and service sectors are important parts of the economy. In some districts, such as Baoan and Nanshan, manufacturing has a bigger role, but in Futian, Luohu and Yantian, the service sector is much stronger. It is worth noticing that while Shenzhen has traditionally been export oriented and manufacturing intense, the economy has experienced a successful "upgrade" to high-tech, finance and creativity oriented structure. Shenzhen has over 6,000 design studios employing over 60 thousand people. It was chosen as Forbes' most innovative city in Mainland China in 2011 (Xue, 2011). For eight
consecutive years, Shenzhen has had the largest number of Patent Cooperation Treaty applications among all cities of China. It has the lowest energy and water consumption per 10,000 RMB of GDP generated in 2011 in the country (SZ Government Online, 2014). This trend is expected to continue, which means that the service sector is going to take a larger slice in the economy. In 2012, Shenzhen-Hong Kong Modem
Service Industry Cooperation Zone, located in Nanshan district, was officially launched. This is going to be a major driver for the economy for coming decades. The growth rates in Table 1 shows that
service at 12.3% annually. In some districts, even some manufacturing intense regions such as Baoan and Nanshan, service is growing much faster. This is because as these regions mature, their cost of production increases. The higher population density has attracted commerce and pushed up property prices.
Manufacturing are now moving away from coast districts and into relatively less developed inland districts, like Longgang and Guangming.
Luohu, Futian and Yantian are highly developed regions of Shenzhen. Luohu and Futian were the old city center, and Yantian has the 4' busiest port in the world. However, these regions are contributing little to the real estate boom in Shenzhen. Property price is high and room for development is little in these districts. What's fueling the average property price increase in Shenzhen is the appreciation in the value of land and buildings in newer districts. Shenzhen Land & Real Estate Exchange Center publishes the city's land auction records (SLREEC, 2014). This piece of information is very helpful in understanding
Shenzhen's trend of development. Appendix I contains full records of this data. I also perform a series of
analysis using this data. Figure 3 Breakdown of Land Auctioned by District illustrated the trend in
development among different districts. Most of the undeveloped land auctioned during the past decade came from areas outside of the old city center districts. Luohu, Futian, and Yantian together accounts for
less than 4 percent of the total land auctioned. A generic real estate model for a highly diverse region like Shenzhen must be able to simulate the overall effect of all districts without going into the shift in
LAND AREA AUCTIONED BY DISTRICT
Futian Dapeng N/A 1% Lu u D% 9% Yantian 0% 2% Longhu Baoan 2% 30% Guangming 7% Pingshan -8% Nanshan/ 12%
Figure 3 Breakdown of Land Auctioned by District
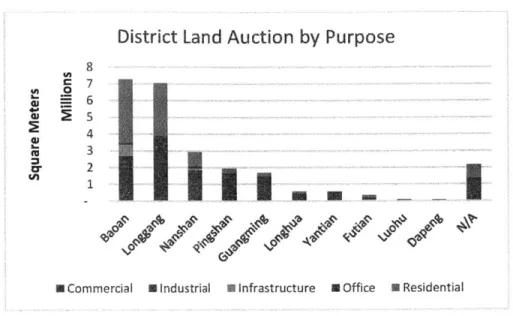
Figure 4 Land Auctioned by District and Purpose shows that Baoan, Longgang and Nanshan have seen the
greatest amount of development in recent years, especially residential, industrial and commercial real estate.
District Land Auction by Purpose
8 7 6 5 4 3 Cr 2%
$i
-V
N Commercial 0 Industrial 0 Infrastructure N Office U Residential
Figure 4 Land Auctioned by District and Purpose
A more focused look on the top 3 fastest growing (in terms of real estate development) districts of Shenzhen reveals a shift in development towards Nanshan district starting 2010. It is in line with
government's intention to setup the Shenzhen-Hong Kong Modern Service Industry Cooperation Zone in this district.
Land Area Auctioned by District
1,600,000 1,400,000 1,200,000 1,000,000 Baoan 800,000 -*r-Longgang 600,000 -*)--Nanshan 400,000 200,000 2002 2003 2004 2005 2006 2007 2008 2009 2010 20112012Figure 5 Comparing Baoan, Longgang and Nanshan District
Real Estate Price
The reason this paper studies the real estate market of Shenzhen is because of its relatively reliable data and mostly uninterrupted boom throughout the history of this young city. The National Bureau of Statistics of China (NBSC) publishes the average price for marketable building space since 2002, up to 2012 by the moment when this paper is completed. Marketable building space is authorized by the government and has the necessary licenses for market transactions between its current owner and any other third party. NBSC records are the best available data for quantifying the price trend of real estate properties in Shenzhen. This data shows that from 2002 to 2012, property price sky rocketed from RMB V5,808 to V14,662 per square meter, adjusted for inflation. The city's population, economy and income data per capita also experienced high growth, as discussed in later parts of this chapter. The following figure illustrates the movement of Shenzhen's average marketable building space price level.
Figure 6 Shenzhen Average Property Price
The above figure shows a strong upward trend for real estate price. The more important point here is that after the global financial crisis of 2008, Shenzhen's real estate market has kept rising.
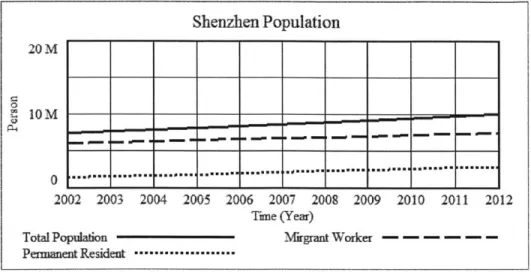
Population Composition
Majority of Shenzhen's population have migrated from other parts of the country. Although there are over 10 million residents in the city, only about one fifth has Shenzhen Hukou'. The figure below divides the Shenzhen population into two groups: Migrant Worker (MW), those who live in Shenzhen but do not have Shenzhen Hukou; and Permanent Resident (PR), residents of Shenzhen with Hukou.
I Hukou is a government issued identification system that links a person's social security and all government
sponsored benefits to a county. Not having a Shenzhen Hukou mostly means that the person will either obtain it in
Marketable Space Price
20,00
10,000
0
2002 2003 2004 2005 2006 2007 2008 2009 2010 2011 2012 Time (Year)
Average Marketable Area Price
Figure 7 Shenzhen Population
Shenzhen's population growth is maintained at a stable rate of 3% per year, with permanent residents taking on a higher percentage of the composition. This trend has two effects on the property market. First of all, it is mostly the permanent residents or those who plan to become PR of Shenzhen that purchase homes in the city. Higher proportion of PR means higher residential demand. Secondly, settling down in Shenzhen is costly for migrant workers. The shift from manufacturing to service makes Shenzhen more attractive to highly educated work force from other cities, and they will earn a higher wage on average.
Average Income Growth
Along with the high growth of the economic output of the city, Shenzhen's residents also experienced tremendous growth in their wealth during the past decade. It is reflected in both the increase in average worker's wage and total savings of residents.
Shenzhen Population 20 M 10M P-" 2002 2003 2004 2005 2006 2007 2008 2009 2010 2011 2012 Tme (Year)
Total PopuLation Mirgrnt Worker - - - - -
...---Figure 8 Shenzhen GDP per Capita
During these 11 years, average wage per worker per year had a CAGR of 4% after adjusting for inflation, while GDP per capita had a CAGR of 10%. More importantly in terms of effect on real estate market: the resident accumulated saving per person nearly doubled. Saving per person is roughly 5 times the annual wage, which indicates very high saving rate and little personal investment usual financial instruments.
Resident Saving 300,000 i 1 I 1 1 I i 1 1 -0 200,000 2002 2003 2004 2005 2006 2007 2008 2009 2010 2011 2012 Tnm (Year)
Saving per Capita
Figure 9 Accumulated Resident Saving
China is known for having one of the highest saving rates in the world, with a national saving rate at around 40% of income (Harbaugh, 2004). This high saving is on one hand preparing for the
down-GDP per Capita vs. Average Wage
100,000
0
2002 2003 2004 2005 2006 2007 2008 2009 2010 2011 2012 Tinne (Year)
Shenzhen GDP per Capita
Shenzhen Average Wage ---...
payment for purchasing homes, but on the other hand enabling higher home prices because without other forms of personal investment, purchasing a home could be the best way to hold value. High property price encourages real estate development, and the Chinese government has been actively trying to control the risk in property market and make sure homes are affordable with a series of policies issued since 2003 (CADRE, 2008). The next part analyzes developers' investment in real estate projects, and government's actions towards controlling this investment through adjusting land supply.
Property Development Investment and Land Supply
In merely over 30 years, Shenzhen has built a mega city from scratch (SZ Government News Office, 2013). Going from a small village to a city with total constructed building area of near 800 million square meters takes a lot of investment from both public and private side (Nanfang Daily, 2010). The stock of building space supports Shenzhen's growth in manufacturing and service, but this level of development expansion will not be sustainable indefinitely. Affordable homes is an important indicator of social and economic stability, and the Chinese government has a long history of issuing policies targeted at controlling real estate investment and speculation (CADRE, 2008). In China, all of the major banks are state owned, and all land belongs to the government. Therefore, the government is able to restrict real estate investment by limiting financial resources and by limiting the release of undeveloped land to developers. Following charts illustrate how the government and macroeconomic conditions influence the investment in real estate sector in Shenzhen.
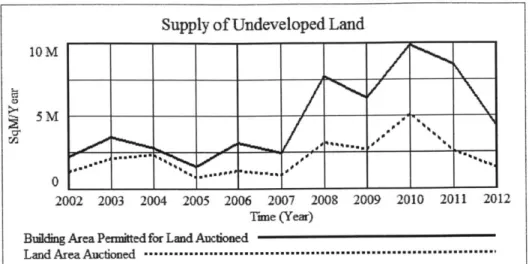
Figure 10 Supply of Undeveloped Land by Shenzhen Government
The figure above shows the total area of land been auctioned by Shenzhen government for the purpose of development in each year from 2002 to 2012. Each piece of land auctioned has a permitted construction area attached to it, effectively giving it a cap on development density. Construction area is greater than land area in the figure because on most land lots, multi-story buildings are planned. From 2003 to 2007, the government issued many policies and regulations aiming at controlling real estate development. However, since 2008, the release of land shows significant increase.
Building Area Under Construction
40 M 35 M -30 M ---25 M ----
I--
--- -20 M 2002 2003 2004 2005 2006 2007 2008 2009 2010 2011 2012 Tnm (Year)Building Area Under Construction
Figure 11 Building Area Under Construction
Supply of Undeveloped Land 10 M
5 M
2002 2003 2004 2005 2006 2007 2008 2009 2010 2011 2012 'nne (Year)
Buiding Area Pennittedfor Land Auctioned
Building Area Construction Completion
20 M 15 M 10M 5M 0 2C Complet )02 2003 ed Buikling 2004 2005 2006 2007 2008 2009 2010 2011 2012 Tine (Year) AreaFigure 12 Building Area Construction Completion
Time to Complete Construction
9 6.75 4.5 2.25 0 2002 2003 2004 2005 2006 2007 2008 2009 2010 2011 2012 Tnr (Year)
Tkne to Complete Construction
Figure 13 Time to Complete Construction
Over the years, the area under construction has been maintained at a stable level. However, area
completed has been decreasing over the years. It means that it's taking developers longer to complete the
same amount of building area, as shown in Figure 13 Time to Complete Construction. This is an
example of policy resistance. Regulators punish developers who hold unutilized land properties by charging them an "unutilized land fee" (Urban Planning Land and Resources Commission of Shenzhen Municipality, 2013). The government intends to use this policy to encourage speedy development and
increase the supply while restricting on speculation on land asset. This policy forces developers to start construction once they purchase a land lot. However, if land value is raising, it will be more profitable for developers to complete and sell the buildings later, which in effect works against the original intention of the policy.
Figure 14 Investment in Real Estate by Project Type
Figure 14 Investment in Real Estate by Project Type shows that investment in residential properties
far surpass all other types. Scherbina and Schlusche note that the housing market is more prone to speculative behavior than other types of real estate markets (Scherbina & Schlusche, 2012).
Limitations in Data Availability
In order to sustain the economic growth China has been enjoying, both policy makers and business leaders demand better statistics data to help them make important decisions. Starting mid 1990's, more and more data are collected by National Bureau of Statistics of China (NBSC). From early 2000's, the annual census report was improved to the point that allowed us to analyze a region's demography and economy as detailed as shown above. While this is a huge improvement in a short period of time, this set
Real Estate Investment
40B
20B
2002 2003 2004 2005 2006 2007 2008 2009 2010 2011 2012 Time (Year)
Residential Project Investment
Industal and OtherInvestment ...
Commeicig Project Imestment--- -
-of data is still unusable for either statistical analysis or any -of the real estate market dynamic analysis performed to date.
There are three limiting factors: First, available data only go back for a little more than 10 years, and many data are collected on an annual basis. What's rendering the explanatory power of these data even more, is the fact that China has not had a recession in a very long time. In order words, there is no "turning point" in this data. If everything is just going up, then any model can fit well into that pattern. It will not be possible to really test a model or a regression without at least one shift in the direction of the trend that is under examination.
Second, most data are only publicly available on a broad city wide basis. There is no way of drilling down to each district to analyze the market from bottom up. Shenzhen as a whole is shifting rapidly from an industrial production based economy to a more diverse economy. While some districts are still developing industrial parks and building up their economic output through industry, many others are now focusing on finance, commerce, service or even creative designing. Shenzhen on one hand has some of the busiest industrial parks in the country, but on the other hand also has the largest floor space of "green buildings" in the country (Askci, 2014). The cost and price for these buildings are vastly different. It will be very difficult to analyze the whole region's property market without regional data.
Third and most importantly, China still misses some crucial categories of statistics record to perform the kind of study that has been conducted in developed countries. In his 1989 thesis, "Understanding the Boston Real Estate Market: A System Dynamics Approach," Peter Genta designs a comprehensive model for Boston's housing market using rent, vacancy, low income population, condo versus detached homes, and tax data (Genta, 1989). None of these categories of data are available in China. There is simply no reliable data on some of the most basic numbers needed for traditional real estate market analysis, such as vacancy rate and rent index.
Ruling out the possibility of building a model that sits on fine-grained local data, this paper analyzes the real estate market using the frame developed for commodity market: based on demand and supply balance. By building a generic real estate model that can capture the development, sales, holding and demolition procedure within the property market, it allows us to examine any regional market with very
limited information. While such a model is not ideal for point prediction, it offers insight into the
dynamics of the market: why the trend, and why the oscillation. It also answers the important question we are asking: is there a property bubble building up in Shenzhen?
This generic model will be tested against California data for following reasons: California has very reliable historical data; it recently experienced the full cycle of the largest housing bubble in its history; and its most important record could be traced back to 1980, which could be used to test the model for long-term, multiple cycle behavior. Testing the model using California data not only validates the design of the model, it also offers an opportunity to understand the behavior of a real estate market, which will shed light into the understanding of Shenzhen's market condition.
MODEL DESIGN
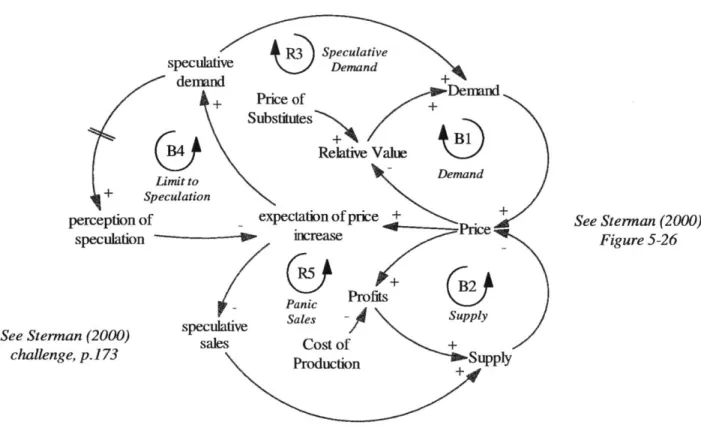
To design a generic model that simulates the dynamics common in different real estate markets, we start with John Sterman's Commodity Model, described in his textbook, Business Dynamics: Systems Thinking and Modeling for a Complex World, Chapter 20 (Sterman, 2000). The basic concept of the commodity model is based on demand and supply that is balanced by price. A simplified illustration of such market structure is described in Sterman's textbook, Chapter 5.
The price of a product is compared against the price of substitutes for consumers, and against the cost of production for suppliers. Consumers and Suppliers then decide on how much to consume and produce accordingly. This relationship between consumption and supply then determines the prevalent market price. System reaches equilibrium through this process. When price is higher than equilibrium price, consumers will demand less and suppliers produce more, causing the supply over demand ratio to rise -price falls. When -price is lower than equilibrium -price, consumers will demand more and suppliers produce less, resulting in a higher price. However, the system may take some time before it reaches equilibrium because there will be longer delays in production change than demand change. We will see oscillation in such a system, where production would overshoot because of the delay in satisfying demand, followed by a collapse because of over capacity developed during this period. A speculation component might be added to some markets where the products can be stored for resale later.
R3 Spclative speculative Speculative dennd + + Price of + Substitutes B4 Relative Value Limit to Demand + Speculation
perception of expectation of price + Price+ speculation inrease
- Panic Profits
speculative Sales Supply
See Sterman (2000) sales Cost of
+
challenge, p.173 Seosto Supply
Production Supl
See Sterman (2000) Figure 5-26
Figure 15 Supply and Demand Balance with Speculation
In a market with speculation, an increase in price causes an expectation in a higher price for the future, and investors increase their purchasing rate and reduce their sales rate. This speculation behavior breaks the equilibrium described above, causing a bubble. The bubble would eventually burst because after a long delay, the perception of speculation would increase sales rate (speculative sales) and decrease purchasing rate (speculative demand). When price starts to fall, speculative inventories will pour into the market and price crashes. This process further intensifies the overshoot and collapse cycle of the system.
The commodity model introduced in Business Dynamics is a perfect example of a supply-demand balance system. This thesis tries to further develop this model to test real estate markets using this framework. Sterman concludes that "[m]ost commodities.. .experience cycles in prices and production with characteristic periods, amplitudes and phases. Industries with long construction delays and long asset
lifetimes such as...real estate likewise exhibit strong cyclical dynamics" (Sterman, 2000). This is a point that the modeling simulation presented here tries to confirm.
A commodity market is similar to a real estate market in following aspects: Both markets have long capacity development delays and life time of capacities. Price-setting process is instantaneous and it is based on a bidding system for market clearance. Over a longer time horizon, excluding the random variations, the demand is stable. For commodity, it's driven by the rate of consumption by downstream industries; and for real estate, it's by population growth, holding other variables constant. Price will rise when there is a low inventory coverage (property available for purchase divided by the rate of property sold), and it will fall when the inventory coverage is higher than its equilibrium level. Cost of production is relatively stable. The production cost of commodity is composed of variable cost and fixed cost. The development cost of real estate projects is composed of land value and construction cost. When the production cost is low relative to price level, the capacity utilization will be high, so that the producers can take advantage of the short term price level. Same is true for real estate. This capacity utilization mechanism is carried over from commodity model to real estate model. When producers expect that profitability will be high for the long term, new capacity will be developed. Same is also true for real estate. More workers will be hired and trained, and more heavy equipment will be purchased. This mechanism is represented in Desired Capital and Capital Stock loops. More capital means more capacity, and with a higher utilization rate, production output will rise and inventory coverage fall. This is the most fundamental production to price balancing loop that is shared by commodity production and real estate development.
While it is reasonable to presume that the most fundamental mechanism of the commodity production-to-consumption dynamic is similar to that of the property market, there are some key differences. First and most important: Sterman's commodity model assumes goods are non-durable. Customers purchase the quantity they need and that quantity is out of the system. Opposite to that, properties are durable goods
with a very long life span. When a home is purchased, it does not leave the system, but rather just moves from a stock called Homes Available for Purchase to another stock called Homes Unavailable for Purchase, through a rate of Home Sales. The total stock only reduces through a very slow rate of
Demolition. What's making this procedure even more complex is that stock for sale takes input from two sources. It can be accumulated through new development, and through sales of existing properties. In this case, stock unavailable for purchase will move into stock available for purchase through the rate of Listing for Sale.
The second modifications that needs to be done to the commodity model is the addition of a speculation dynamic. Investors can purchase and hold real estate assets in anticipation of capital appreciation. This paper tests the effect of added speculation in this system, and tries to determine how much role does speculative investment play in the business cycle of real estate markets.
With the key differences between the commodity model and real estate model explained, the following sections explain the overall concept and the details of every part of the real estate model. Functions not listed in this paper are meant to be the same as Sterman's commodity model.
Overview of the Generic Real Estate Model
There are four major parts in Sterman's commodity model: Production & Inventory, Production Capacity, Demand, and Price. Each part has several smaller components, and all parts are interconnected to simulate the dynamics in commodity markets. Based on this structure, the generic real estate model this thesis tests also contains four corresponding major parts: Construction & Stock, Construction Capacity, Demand, and Price:
The Construction and Stock module is the part that consumers see and interact with in a real estate market. This part describes the development of a real estate project, the sales of the project, and its demolition after certain years of service. This is where the inventory coverage ratio and capacity utilization ratio are discovered. All inputs coming into this visible part of the market is determined in the three following, less visible modules.
2. Construction Capacity:
The Construction Capacity describes the behavior of real estate developers. This module is composed of two smaller parts. First is Desired Capital, which is the result of comparing the long term expected price to the expected cost of development. The second part is Construction
Capacity. It takes desired capital as an input, and through a delayed capital acquisition rate, it derives at capital stock, which is then converted into Construction Capacity that feeds into the Construction Start Rate.
3. Demand:
The Demand module puts together two kinds of demands: real demand and speculative demand. Real demand is driven by population growth. The stock of real demand equals the number of households in a housing market, or equals space per person times total population in a general real estate market. The speculative demand is determined by the rate at which the price changes. The input for this module is demographic information, price trend, and mortgage rate. These two types of demand are combined with expected demolition to derive an indicated customer order. If the customer order rate is positive, it feeds into the property sales rate. If it is negative, which only happens when there is a high speculative sale, it feeds into the property listing for sale rate.
The Price module simulates the pricing procedure that happens in each transaction, but is represented here as a market behavior as a whole. It generates what the price should be based on previous pricing level and the inventory coverage ratio from the Construction and Stock module. The price variable generated here will feed into all other three modules. This part also houses the price trend component. Price Trend is the driving force behind speculative demand.
Construction
Stock of RE
C Construction Propertyi Capacity -Construction O capaty Completion Utlization Rate Price " Inventory Coverage " Exp~ected Construction Cs Capacity a cost to gDemand Devedop 0 Popuhation -~~~ PceLe *mortgage RateePrice Level
e Prie TYrendFigure 16 Overview of the Generic Housing Model
Other than these four major modules, there are many smaller components that support them. In order to simulate the investment behavior in real estate assets for capital gain, a speculation component is created and added into the demand module of Sterman's commodity framework. Following is a description of each of the modules. I will first describe the corresponding design in Sterman's commodity model for each component, then discuss the modification made to suit the real estate market.
Construction and Stock Module
The Construction and Stock module corresponds to the "Production & Inventory" module in Sterman's commodity model (Sterman, 2000). "Production & Inventory" describes the flow of inventory from Production Start to Shipment. Production Start feeds into WIP Inventory, which after a Manufacturing Cycle Time delay, becomes Inventory. The stock of Inventory is then decreased through a Shipment Rate. The ratio of Inventory over Shipment Rate is Inventory Coverage. Production Start rate is the product of Production Capacity and Capacity Utilization. Capacity Utilization is determined by Expected Markup, which equals to Short Run Expected Price over Expected Variable Costs.
Figure 17 Construction and Stock Module describes this component in the real estate model. The basic structure is the same as the commodity model. However, because real estate assets can be held and resold later by owner, there is a stock added after the sales to represent assets held by owners. This stock increases as inventory (Homes Available for Purchase) are sold. It decrease with resale (Homes Listing for Sale) and demolition (Home Demolition).
Table for Listing <Minimum Order Total Construction <Customer Fulfillment Processing Time> Output Orders> Max'um --o Listing + Listing Rate Construction Time + Desired Listing -Fulfliment Ratio Construction + Fraction Rate Abandon Rate Abandoned Lstng Fulimen Expected HomesDemolit Homes Under
Homes
me. Construction Construction construction Available Homes Liting Unavailable Start Rate Completion for frSl o + Rate Purchase Purchase Home Demolition <Construction Homes Sold Capacity> Rate B) Demo] pay Price-ProdutionCoverage Desired Sales Utilzation BI&c B Rate <Customer7
Orders> Minimum Order Maximum Fulfilet Order Utilization Processing Time Sales Rate Fulfilment Table for Adjustment Ratio --- Order Time RO + Short Run <Price> ExEected Markup + Time to Adjust Short-Run Price Expectations Epee <Expected Unit Costs> nt Costs Time to Adjust Expected Development CostsIndicated Capacity Utilization
Table for Effect of Markup on Utilization of ition I-A %4 0 r+ 04 CL
a
0 0. CL Home inFollowing are the description of each components of this module:
1. Homes Under Construction:
Homes Under Construction is the stock of housing units that is currently under development. It is the integral of Construction Start Rate minus the sum of Construction Abandon Rate and
Construction Completion Rate.
2. Homes Available for Purchase:
This is the stock of homes in the market listed for sale. It is the integral of Construction Completion Rate plus Homes Listing for Sale minus Homes Sold. It includes newly developed homes and pre-owned homes that are listed by their previous owner.
3. Homes Unavailable for Purchase:
Homes Unavailable for Purchase is the stock of all homes that are in usable condition, but are not listed for sale. It could be homes occupied by owner, homes occupied by renter, second homes, vacation homes or investments homes. This stock is the integral of Homes Sold minus Homes Listing for Sale and Home Demolition.
4. Construction Start Rate:
Construction Start Rate measures the construction start volume in terms of number of homes per year at any point of time (each calculation time step). It is the result of total Construction
Capacity multiplied by Capacity Utilization.
Construction Completion and Abandon Rates are the result of a third order exponential delay of the Construction Start Rate, with a Construction Time (or delay time) of one year. This one year delay time is derived from the average home permit authorized to construction start time plus the average construction start to completion time. Because this model uses one stock to represent both authorized but not started and started construction, these two periods of time are put together to form a single delay time.
When there are multiple exists for a third Order exponential delay, there needs to be a total output ratio, then divide this total output ratio between two actual exists.
Total Construction Output = DEL4 Y3 (Construction Start Rate, Construction Time)
Construction Abandon Rate = Fraction Abandoned * Total Construction Output
Construction Completion Rate = (1-Fraction Abandoned) * Total Construction Output
6. Homes Sold and Homes Listing for Sale:
As described above, the rate of sales or listing is determined by customer order, which is the netted number of consumers selling and buying. If the customer order number is positive, it means that there are more consumers buying than selling at that point of time, and the Homes Sold rate will be positive, and Homes Listing for Sale rate will be zero. In other words, the stock of homes available for sale will decrease. If Customer Order is negative, it means there are more consumers selling than buying, and the Homes Listing for Sale rate will be positive and Homes Sold rate will equal to zero. Homes Available for Sale will increase.
Desired Listing Rate = MAX (-Customer Orders, 0)
Because of the limited amount of supply from the stock of homes, the rate of transaction will slow down when the inventory runs low, and this ensures that the stock never reaches below zero. Homes Sold or Listing equals the desired rate times fulfillment ratio. The lookup table here takes the maximum sales rate over desired rate as the input and generates fulfillment ratio as the output. This lookup table is unchanged from Sterman's the commodity model (Sterman, 2000).
Graph Lookup -Table for Order Fulfillment
/
Fulfillment P Ratio
0'
0 Max Rate/Desired Rate 4
Figure 18 Table for Order Fulfillment Ratio (Sterman, 2000)
7. Home Demolition:
Most buildings will be demolished after certain years of usage. Home Demolition is the product of Homes Unavailable for Purchase and Rate of Demolition. Calculated using actual total home units and actual construction rate from 2000 to 2008, the rate of demolition is assumed to be 0.25% of Homes Unavailable for Purchase per year.
Inventory coverage is the indicator of the balance between demand and supply. It equals to Homes Available for Purchase divided by Homes Sold. It is measured in years, meaning how many years of supply is in the stock of listed homes given the rate of sales at the moment. This is the most important indicator for price. Low Inventory Coverage results in multiple buyers bidding on the same house and price goes up; high Inventory Coverage results in sellers compete for potential buyer and lower their price.
Inventory Coverage = IF THEN E LSE (Homes Sold = 0, IF THEN ELSE (Desired Sales Rate = 0, 1, 0), Homes Available for Purchase/ Homes Sold)
Inventory Coverage calculation needs to avoid the denominator equals zero. There are two situations when Homes Sold would become zero, one is when Desired Rate is zero, and the other is when Fulfillment Ratio equals zero. The formula distinguishes these two situations and gives a corresponding response according to that.
9. Capacity Utilization:
Capacity Utilization is result of developers and home builder's collective opinion on the short run expected price versus cost, or the short run profit. If the profitability is expected to be high during
a time frame of a development project, the developer will utilize more capacities to construct more homes in order to gain more profit; the opposite if the profitability is low in the short run. The conversion from profitability into Capacity Utilization depends on a Lookup Table for Markup on Utilization. The real estate model uses the assumptions used in Sterman's Commodity
Graph Lookup -Table for Effect of Markup on Utilization 1.2 Capacity Utilization:
0
0 Expected Markup 5Figure 19 Table for Effect of Markup on Utilization (Sterman, 2000)
Capacity Module
This module corresponds to the Production Capacity and Desired Capacity components of Sterman's commodity model (Sterman, 2000). Production Capacity is derived from Capital Stock times Capital Productivity. Capital Stock is generated from Desired Capital, through a series of indicated capital order calculation and acquisition delay. The process of which desired capital is indicated and then acquired based on profitability is the same for both commodity market and real estate market. Therefore, no structural changes are made to this part. The figures and description below explain how this design is applied in the real estate market.
Capacity * onstruction
Acquisition Capacity
DeayCapital
Productivity
r , Caplta on - Ctal3
Order Rate Acquisition Discard Rate ~
-IF
~Rate
4Average Life of
B B
Capacity
Supply Line Stock ConW xrot,
CoSkrof Acquisition
Delay
Indicated Adjustment -- Desired
Orders r Suply _ Supply * Adjustment
Capacity <Desired
Supply Line ~ Capacity Capital>
Adjustment Adjustment
Time Time
Desired DesiredExpected
Acquisition EDis rd
Rate Rate
Figure 20 Construction Capacity
<Capital Stock> Desired Capital 4 + Effect of Expected Profit on Desired Capacity Sensitivity of Investment to Exp Profit <Price> Long Run Expected Expected + Profitability of New Investment +
Table for Effect of Expected Profit on Desired Capacity
Time to Adjus Long Run Pric Expectations Expected + Unit Costs Unit Costs Time to Adjust Expected Costs t ,e <Expected Land Value> Unit Construction Cost
Figure 21 Desired Capital
Expected Land Value is simulated in this model as a fraction of Investors' Expected Price.
<Investors
Expected Price>ExctdLdExpectedxpeected Land Value Initial Expected
Land Value +
Initial Land Value Fraction
Figure 22 Unit Land Value
2. Unit Construction Cost
Unlike land value, Unit Construction Cost is a constant number, measured in dollar per home.
3. Table for Effect of Expected Profit on Desired Capacity
Desired Capacity depends on Expected Profit. When expected profit is high, developers will demand higher capacity, vice versa. The function between these two variables is calculated through a lookup table. The real estate model uses the lookup table found in Sterman's commodity model.
Graph Lookup -Table for Effect of Expected Profit on Desired Capacity 2
Desired Capacity
0
-1 Expected Profitability
Demand Module
In Sterman's commodity model, demand is expressed as Customer Orders, and it is the result of a
reference demand adjusted by price and elasticity (Sterman, 2000). Reference demand is a constant, and it is assumed that at equilibrium price, the demand and customer order will stay constant. When price increases, Indicated Industry Demand will decrease and so will Customer Orders. The magnitude of the drop in demand is determined by Reference Industry Demand Elasticity. However, in the real estate model, Customer Orders consists of Primary Home Demand (real demand), Speculation Demand (demand to hold properties in anticipation of future real demand at a higher price) and Expected Home Demolition. Primary Home Demand is equivalent to Industry Demand, and it is the result of the increase in households, and adjusted by Reference Primary Home Demand Elasticity. The other two types of demands are result of changes to the model structure in order to represent the real estate market. They are directly added to Customers Orders in the real estate model.
+ <Other Factors Affecting Customer + Demand>
Orders
Demand <Speculation Primary Home Adjustment
Orders> Demand Delay
<Expected Home <Adjustment for
Demolition> Primary Home
Reference Primary Demand&
Home Demand Indicated Primary
Home Demand
Demand
<Price> Slope Reference Primary Home Demand Elasticity
Maximum Reference
Primary Homes Price
Figure 24 Customer Order Component
Primary Home Demand is adjusted according to price, so that if the price is higher than the Reference Price (less affordable), this demand will be lower than indicated. If the price is low (more affordable), it will be higher than indicated. This adjustment is done through discounting the Reference Primary Home Demand based on the ratio of Price over Reference Price, with the effect of Price Elasticity of Demand. All these simulation mechanisms are identical to Sterman's Commodity Model, and only the variables are changed according to calibration results to fit the characteristics of a real estate market.
Speculation Orders and Expected Home demolition are combined with Primary Home Demand to form Customer Orders.
The Reference Primary Home Demand equals to Adjustment for Primary Home Demand, which is the gap between total number of households (represented in the model as Desired Occupied Home Units) and home units actually occupied by households as their primary homes (Primary Home Stock).
<Homes Unavailable <Speculation for Pirchase> Demand Stock> Population Increase Rate + + + Priaflay Home Total Stock Net Changemin P Population+
+ Desired Occupied Adjustment for Primary Home Units + Home Demand
Occupied Home Household Size Adjustment Tune
Figure 25 Adjustment for Primary Home Demand
In Primary Home Stock, Speculation Demand Stock is subtracted from Homes Unavailable for Purchase. This is because the definition of speculation demand in this model is the demand beyond real demand (number of households). In other words, these homes are held by investors and are left vacant.
Total Population = INTEG (Net Change in Population)
Net Change in Population = Population Increase Rate * Total Population
Desired Occupied Home Units = Total Population / Household Size
Primary Home Stock = Homes Unavailable for Purchase -Speculation Demand Stock
Adjustment for Primary Home Demand = (Desired Occupied Home Units -Primary Home Stock) / Occupied Home Adjustment Time
a. Total Population:
Total Population is simulated using starting population level, and adjusted by a net rate of change in population (Population Increase Rate).
b. Household Size:
Household Size is set as a constant number in this model.
c. Desired Occupied Home Units:
Desired Occupied Home Units equals to Total Population divided by Household Size.
Speculation Demand is another variable that determines Customer Orders in the real estate model. This is a major change to Sterman's commodity model. It requires more attention and is described in detail in the section after we discuss Price.
Price Module
The Price Module is the information hub that balances all other modules in Sterman's commodity model. It takes the Inventory Coverage ratio and Expected Production Costs to derive at Price. This price figure after a delay in adjusting traders' expectations, becomes Traders' Expected Price. The value of Price at any given point in time is the product of this expected price times the effect of costs on price and effect of inventory coverage on price.
For the real estate model, the price setting mechanism is identical to the commodity model. However, in order to support the calculation of speculation demand in the real estate model, a price trend perception component is added. This component compares the price level over a time horizon to derive at a traders'
perception in price trend. This trend perception model is introduced in Business Dynamics, Chapter 16 (Sterman, 2000). There is no structural change to this model. Coefficients are calibrated along with other parameters of the real estate model.
PO CD CD
Minimum Price <Unit
Variable Cost> Adjusbnent +
C
Sensitivity of Price to Inventory Coverage ffect of Inventory overage on PriceA.
Relative Inventory Coverage
Time Reference Expectation Time to Change in RE Perceive Trend Time Horizon for Perceived Reference Expectation Indicated Trend Trend in Price e in TREND Investors' r' ExExeted Change
i
Investors' Sensitivity Expected of Prc to djust Price B pected + AdjustetB Effect of Cot on cost Pressure Indicated R + Price Price Coverage CovPerceived Inventory+ Coveraue +
Referenc Inventory C rentory erage> 41n Time to A Investors' Ex Price, 0" <Expected Unit Costs> lwverg ' e