Dynamic Behavior of Healthy and Malaria
MASSACHUSETTS INSTliUT
Infected Human Red Blood Cells
OFTECHNOLOGYby
SEP 0 1
2010
David John Quinn
LIBRARIES
B.S. Mechanical Engineering, Villanova University (2002)
M.Phil. Engineering by Research, University of Cambridge (2003)
S.M. Mechanical Engineering, Massachusetts Institute of Technology
(2006)
ARCHNVES
Submitted to the Department of Mechanical Engineering
in partial fulfillment of the requirements for the degree of
Doctor of Science in Mechanical Engineering
at the
MASSACHUSETTS INSTITUTE OF TECHNOLOGY
June 2010
@
Massachusetts Institute of Technology 2010. All rights reserved.
Author ...
Department of M4anical Engineering
May 18, 2010
C ertified by
...
Subra Suresh
Vannevar Bush Professor of Engineering
Professor of Mechanical Engineering
Chairman of the Committee
A ccepted by ...
.
-.
. .
David E. Hardt
Chairman, Department Committee on Graduate Theses
Dynamic Behavior of Healthy and Malaria Infected Human
Red Blood Cells
by
David John Quinn
Submitted to the Department of Mechanical Engineering on May 18, 2010, in partial fulfillment of the
requirements for the degree of
Doctor of Science in Mechanical Engineering
Abstract
Hereditary hematological disorders and foreign organisms often introduce changes to the spectrin molecular network and membrane of human red blood cells (RBCs). These structural changes lead to altered cell shape, deformability, cytoadherence and rheology which may in turn, promote the onset of vaso-occlusive events and crises that may ultimately cause pain, stroke, organ damage and possibly death. Previous work by our group and others has shown that the RBC membrane exhibits reduced deformability as a manifestation of diseases such as malaria, spherocytosis, elliptocy-tosis and sickle cell anemia. However, much of this previous work has modeled the RBC membrane as a purely elastic material and experiments are typically performed within the quasistatic deformation regime. This work investigates the connection between disease, structure and function in a more physiologically relevant, dynamic context using two in-vitro experimental approaches: (1) dynamic force-displacement characterizations using advanced optical trapping techniques and (2) microfluidic flow experiments. A new set of dynamic optical trapping experiments are developed using an alternate loading configuration and a broader range of deformation rates (up to 100ptm/s) and forcing frequencies (up to 100Hz) than previously reported with optical trapping systems. Results from these experiments provide further support to recent suggestions that traditional constitutive descriptions of the viscoelastic behavior of the RBC membrane are not applicable to this wide range of deformation rates and frequencies. Initial results on RBCs infected with Plasmodium falciparum malaria suggest that the parasite and its related exported proteins act to increase the effec-tive viscosity of the RBC membrane. The role of the temperature-dependent, viscous behavior of the RBC membrane is further explored in microfluidic flow experiments, where the flow behavior of RBCs is quantified in fluidic structures with length scales approaching the smallest relevant dimensions of the microvasculature (approximately 3pm in characteristic diameter). In particular, the role of a parasitic protein, the ring infected erythrocyte surface antigen (RESA), is investigated and determined to have a rate-dependent effect on microvascular flow behavior that has not previously been identified. Results from optical trapping and microfluidic flow experiments are used
to inform and validate a collaborative effort aimed at developing a meso-scale, three-dimensional model of microvascular flow using dissipative particle dynamics (DPD). This combination of modeling and experiments give new insight into the relative roles of fluid and membrane viscosity in microvascular flow. The results of this work may be used in the development of new constitutive behaviors to describe the deformation of the RBC membrane and to inform the design and optimization of microfluidic tools for blood separation and point-of-care diagnostic platforms. In addition, using the techniques developed here in further investigation of the roles of particular parasitic proteins may yield additional insight into the pathology of P.f. malaria that may, in turn, provide new avenues and approaches for treatment.
Thesis Supervisor: Subra Suresh
Title: Vannevar Bush Professor of Engineering Professor of Mechanical Engineering
Acknowledgments
I am grateful to too many people to try to name them all individually. However,
professionally, I would like to thank my supervisor, Prof. Subra Suresh, for allowing me the opportunity to work in his lab and providing me with all of the financial and personal support necessary to perform this work. Similarly, I would like to acknowledge the NSF and NDSEG graduate research fellowships for their support throughout my graduate studies.
Personally, the list of people to whom I am indebted could go on for several chapters. So, rather than risk forgetting to include anyone, I will acknowledge the most significant one: my wife Molly. I cannot imagine my life without her and do not think this body of work would have ever been completed without her love and support. I am more proud of my relationship with her than anything I have ever done.
Contents
1 Introduction 2 Background
2.1 Red Blood Cell Deformability .... ...
2.1.1 RBC membrane elasticity . . . . 2.1.2 RBC membrane viscosity . . . .
2.1.3 RBC flow in the microvasculature . . . . 2.1.4 Deformability of Plasmodium falciparum malaria parasitized
RBCs ... ...
2.2 Background on Optical Trapping . . . . 2.2.1 Principles of optical traping . . . . 2.2.2 Optical trapping system and components . . . .
2.2.3 Optical trap calibration . . . .
3 Dynamic Characterization.. .Using Advanced O.T.
3.1 Introduction . . . .
3.2 Materials and Methods . . . . 3.2.1 Buffer, bead coating and cell solution procedures . . . . 3.2.2 Optical trapping techniques . . . .
3.2.3 RBC elastic property extraction . . . .
3.3 Results and discussion . . . . 3.3.1 Elastic and viscoelastic characterization of healthy RBCs . . . 3.3.2 Characterization of P.f. parasitized RBCs . . . .
3.4 C onclusion . . . . 86
4 Flow Dynamics of RBCs in pFluidic Systems 89 4.1 Introduction . . . . 89
4.2 Materials and Methods . . . . 91
4.2.1 Microfluidic channel fabrication and experimental procedures . 91 4.2.2 Local pressure differential measurement . . . . 94
4.2.3 Buffer and cell solution preparation . . . . 97
4.2.4 Dissipative particle dynamics (DPD) modeling . . . . 97
4.3 Results and Discussion . . . . 98
4.3.1 Flow characterization of healthy RBCs . . . . 98
4.3.2 Flow characterization of parasitized RBCs . . . 106
4.4 Conclusion . . . 108
5 Summary of Results and Thesis Contributions 111 A KOH Etch coverslip protocol 115
List of Figures
2-1 General structure of the Red Blood Cell (RBC). (Taken from Alberts et al. [2]) . . . . 24
2-2 Structure of a phospholipid bilayer. (Taken from Lodish et al. [61]) . 24
2-3 Graphical depiction of the structure of the RBC spectrin network. (Taken from Alberts et. al. [2]) . . . . 24 2-4 Electron micrograph of the RBC spectrin network. (Taken from
Al-berts et. al. [2]) . . . . 25
2-5 (a) Colorized electron micrograph illustrating the typical biconcave shape of human RBC. (Taken from Lodish et. al.[61]), (b) Average geometric cross-section and corresponding surface area and volume (Adapted from Fung [43]) . . . . 26 2-6 Examples of large deformations of RBCs in the microvasculature: (a)
Bright field, phase image of RBC flow in the canine microvasculature. (Taken from Fung. [43]), (b) Histological stain of ex-vivo spleen perfu-sion experiment showing the passage of red cells (stained red) across the splenic sinus wall from the cords (co) to the sinus lumen (sl). (Taken from Buffet et. al [18]), (c) SEM image of mouse RBC passage across circular pores in the spleen (Taken from Klausner [56]), (d) graphical depiction of RBC flow in the microvasculature in the presence of white cells. (Taken from Pries and Secomb, [85]) . . . . 27
2-7 Steady-state shapes of axisymmetric cells flowing through cylindrical
tubes. (a) Cell shapes in varying diameter tubes with a cell velocity of 0.01cm/s, (b) Cell shapes in a vessel diameter of 6pm subjected to varying flow velocities. (Taken from Secomb et. al. [94]) . . . . 32 2-8 Life cycle and pathogenesis of P.falciparum malaria (Taken from Miller
et. al. [65]) . .. . . . . . . . 35 2-9 Intra-erythrocytic, asexual life-cycle of P.falciparum malaria (Taken
from A lberts [2]) . . . . 36
2-10 Membrane shear modulus of P.f. malaria as a function of intra-erythrocytic stage (Taken from Mills [66]) . . . . 37
2-11 Ray optics representation of optical trapping. (a) Unstable trapping with a non-Gaussian beam, (b) Stable trapping with a Gaussian beam. In both cases, the particle is attracted towards the focal point. (inset) Refraction gives rise to the gradient/restoring force. Figure taken with
permission from Brau [15] . . . .
40
2-12 Representative layout of a high-end laboratory optical trap: (A) 1064 nm trapping laser, (B) acoustic optic deflector (AOD) for high speed beam steering, (C) telescope lens pair for trap beam alignment and expansion only, (D) 975nm detection laser, (E) telescope lens pair for detection beam alignment and expansion only, (F) telescope lens pair for simultaneous alignment and expansion of trap and detection beams,
(G) high numerical aperture objective (60 - 1OOX, N.A. > 1.4), (H) condenser lens, (I) dichroic mirror used to integrate trap and detec-tion beams into microscope optical path, (J) dichroic mirror to direct beams to detection branch, (K) bright field lamp, (L) position detec-tion branch with band pass filter to eliminate 1064 nm wavelength and focus detection beam onto position sensitive detector (PSD), (M) CCD camera for conventional imaging, (S) specimen plane. Figure used with permission from P. Tarsa and caption used with permission from D.
2-13 Example position calibration of an optically trapped bead. (a) and (b) show the X and Y voltage signals, respectively, from the PSD as
the bead is moved across the detection region in both AOD coordinate directions. (c) The PSD signals as the bead is moved in a single di-rection, highlighting the linear detection region. (Figures (a) and (b) taken from Brau [15] and (c) from Appleyard [4].) . . . . 43
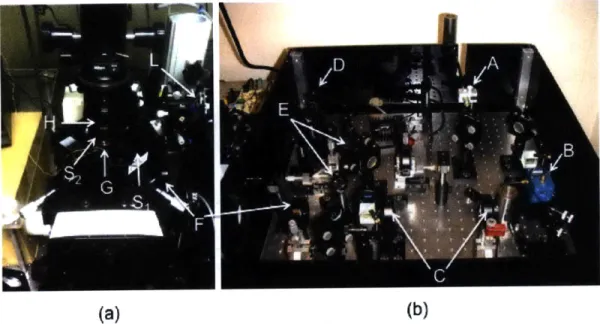
3-1 Optical trapping system implemented and used in this work, separated
by (a) the specimen plane, condenser and position sensing branch and (b) the trap, detection laser and supporting alignment and beam
steer-ing optics. Labels correspond to schematic view of the system given in Figure 2-12, where the specimen plane is comprised of the piezoelec-tric stage and the sample chamber, Si and S2 respectively. The 10OX
microscope objective used (G) is shown with the objective heater used in physiological temperature experiments. . . . . 50 3-2 Calibration of optical trap using stokes flow technique. (Trap stiffness
, = 0.29pN /nm .) . . . . 54
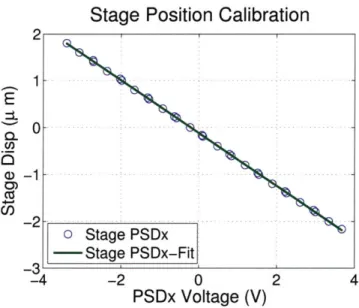
3-3 (a) Picture and (b) schematic of optical lever system used to measure stage displacements for large displacement rates and high oscillation frequencies (typically greater than 10pm/s and 10Hz, respectively). . 56 3-4 Example calibration of optical lever system used for stage position
detection, showing approximately 0.5pm/V. . . . . 57
3-5 Loading configurations relying on (a) limited coverslip adhesion and (b) circular coverslip adhesion and examples of a healthy cell under 60pN and 30pN load, respectively. . . . . 58 3-6 Determination of the coverslip contact radius (Rec) via relative motion
of a weakly-trapped bead relative to the cell to reveal the perimeter of contact between the cell and the coverslip. . . . . 59
3-7 Finite element simulations of RBC loaded under load configuration B
3-8 (a) Effect of initial shear modulus (p,) on the axial displacement vs. force response of an RBC for a fixed set of contact conditions and moduli ratio; (b) non-dimensionalized response where all curves in (a) may be described by Equation 3.10 with the displayed values of B and
C. .... ... ... 65
3-9 Force-displacement response of a healthy RBC and extracted modulus
using non-dimensionalized system of equations. . . . . 68 3-10 Comparison of average healthy RBC membrane shear modulus
mea-sured using load configuration B under an imposed displacement rate of lpm/s with results of other quasistatic approaches. (Error bars rep-resent standard deviations of N cells, where N is the number of cells measured for each technique and indicated on bargraph.) . . . . 68 3-11 Viscoelastic shape recovery tests performed at room and
physiologi-cally normal, body temepratures. . . . . 69 3-12 Example time-history of loading a healthy RBC with approximately
2pm of displacement imposed under configuration B at deformation rates from 1-100pm/s. The stage is held at its maximum displacement for 4sec and returned to its initial position at a rate of lpm/s. (a) and
(b) display different ranges of time for the same experiments performed
on the sam e cell. . . . . 71 3-13 Typical force-displacement response of healthy RBC under varying
dis-placement/deformation rates (1 - 100tm). . . . . 72
3-14 Apparent shear modulus as a function of displacement rate. Data points and error bars represent the average and standard deviations of 12 experiments, respectively. . . . ... 73 3-15 Example of exponential fits of relaxation behavior of an RBC following
loading via a stage displacement rate of (a)lpm/s, (b)lOpm/s and (c)l100pm /s.. . . . . . . . . 75
3-16 Relaxation time constants of two-timescale exponential fits compared
to single timescales. Data points and error bars represent an average and standard deviation of 6 cells. . . . . 76
3-17 Corresponding load-displacement histories of a healthy RBC subjected
to loading via stage displacement rates of 1, 10, 100pm/s, hold periods
of 4 seconds and unloading rates of 1pm/s. . . . . 77 3-18 Energy dissipation of stress relaxation experiments. Data points and
error bars represent average and standard deviations for 6 cells. . . . 78
3-19 Typical load-displacement behavior of a healthy RBC subjected to
sinusoidal displacements of varying frequency. . . . . 79
3-20 Energy dissipation behavior of healthy RBCs subjected to sinusoidal
displacem ents. . . . . 80
3-21 Power-law dependence of energy dissipation of healthy RBCs subjected
to sinusoidal displacements. . . . . 81
3-22 Typical load-displacement behavior of a healthy RBC subjected to
si-nusoidal displacements of varying frequency plotted on the same axes. The change in average slope at 100Hz indicates a softening of the re-sponse that may be a result of fluidization of the RBC membrane. . . 83
3-23 Effect of physiological temperature on the membrane shear modulus of
uninfected/parasite-free RBCs, RBCs parasitized with the wild-type condition in the production of RESA (resa-WT) and RBCs parasitized with genically modified parsites incapable of producing RESA (resa-KO). Figure adapted with permission from [66, 67]. . . . . 84 3-24 Comparison of membrane shear modulus mesurements of late-stage
(trophozoite) infected cells measured using Configuration B with mea-surements made using Configuration A. . . . . 85
3-25 Energy dissipation characteristics of healthy vs. infected (trophozoite
4-1 Schematic view of pressure-control flow system and channels used in flow experiments. A combination of pneumatic regulators and relative height adjustments are used to set the desired pressure differential. . 92
4-2 Relationship between average velocities of 1pm diameter beads and local pressure difference at room, body and febrile temperatures (220C,
37'C and 41'C, respectively) for 2.7 pm high, 30 pm long channels of
varying w idth. . . . . 96
4-3 Comparison of analytical solutions and CFD results for fluid and bead velocities at various positions along the width of the channel. (Inset: Pressure-velocity relationship for beads and fluid along channel center-lin e) . . . . 9 6
4-4 Shape characteristics of RBC traversal across microfluidic channels: (a) Experimental (left) and simulated (right) images of erythrocyte traversal across a 4 pm wide, 30 pm long, 2.7 pm high channel at
22'C and an applied pressure difference of 0.085kPa.; (b) local area
expansion contours for an RBC traversing a 3 pm and 6 pm wide (h = 2.7 pm) channel under AP = 0.085 kPa; (c) measured and
simu-lated cell lengths at the center of the microfluidic channel for varying channel widths; (d) estimated maximum stretch ratios of RBC spectrin network; and (e) asphericity index as the cell passes through different channel widths under AP = 0.085 kPa. In (d) all channel heights are
2.7 pm. In (e), channel height and width dimensions are indicated.
Vertical dashed lines in (d) and (e) indicate locations of channel en-trance and exit. Horizontal dashed line in (e) indicates the stress-free, resting asphericity of a normal RBC (a = 0.15). . . . . 100
4-5 Quantitive flow behaviors of RBC traversal of microfluidic channels. (a) Comparison of DPD simulation results (open markers) with exper-imentally measured mean velocities (filled markers) of RBC traversal as a function of measured local pressure differences for 3, 4, 5 and 6pm channel widths (height = 2.7 pm, length = 30 pm). Error bars on experimental data points represent an average ± one standard devi-ation of a minimum of 18 cells. Error bars on modeling data points indicate minimum and maximum variations resulting from a case study exploring the sensitivity of the RBC traversal to channel geometry and cell volume, shown in Figure 4-6. (b) Experimentally measured and modeled total transit time broken into entrance, channel and exit com-ponents for RBC traversal across varying channel widths under AP =
0.085 kPa. (*) Modeling results with 2X domain size to examine the
role of fluid inertia and periodic boundary conditions. . . . . 102 4-6 Case studies using the DPD model to evaluate the sensitivity of RBC
flow in a 4 pm wide x 2.7 pm high channel subjected to a pressure difference of 0.14 kPa with respect to geometric variations in flow di-rection (B: Off-centerline flow), channel geometry (C: Non-rectangular, beveled corner cross section with the same cross-sectional area), and cell volume (D,E,F: 0.8, 1.1, and 1.25 times the standard cell volume
of 100 pm 3, respectively).
. . . .
1034-7 Temperature dependent RBC flow behaviors. (a) Comparison of DPD simulation results with experimentally measured effects of temperature on ratio of local pressure difference and mean velocity of erythrocyte traversal in a 4 pm and 6 pm wide (h = 2.7 pm, L = 30 pm) mi-crofluidic channel. Data points represent an average of a minimum of
18 cells. (all p < 0.05 in experimental data) (b) Independent effects
of external fluid viscosity, membrane viscosity and internal fluid vis-cosity on the modeled flow characteristics of RBCs in 4 pm channels subjected to a pressure difference of 0.14 kPa. . . . . 105
4-8 Flow behaviors of (a) wild-type (WT) and (b) RESA knock-out (KO) P.f. parasitized RBCs in 4 pm wide channels under a pressure dif-ference of approximately AP = .1kPa. In order to highlight the differences between healthy and infected cells and the variation with temperature, each data set is normalized by the flow velocity of
List of Tables
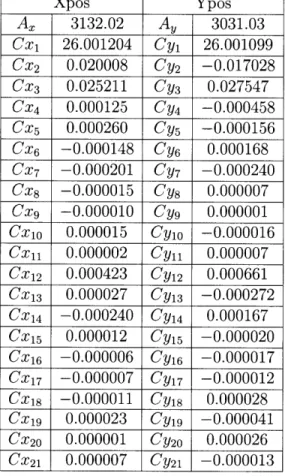
2.1 Elastic properties of the healthy human RBC . . . . 28 3.1 Typical fifth-order polynomial calibration coefficients used to map PSD
voltages to position in the specimen plane . . . . 52 3.2 Fitted coefficients for non-dimensional equations. . . . . 67 3.3 Range of parameters explored in finite element studies to determine
non-dimensionalized system of equations describing the load-displacement response of the RBC under loading configurations A and B. . . . . . 67
3.4 Corresponding average and maximum velocities imparted by sinusoidal displacements of given amplitudes and frequencies. . . . . 81
Chapter 1
Introduction
The flow of red blood cells (RBC) through the microvasculature is critical to human health. During its typical life-span of 120 days upon egress from the bone marrow, the human RBC circulates through the body approximately 500,000 times, delivering oxygen to tissue and vital organs. As it repeatedly traverses capillaries and microvas-cular passages, the RBC undergoes severe deformation with strains in excess of 100% [14, 21, 70]. Such deformation levels are typical, for example, in the spleen, where the RBC squeezes through splenic sinus and inter-endothelial slits with diameters es-timated to be approximately 3 pm [18, 42]. Large deformation can also occur in cap-illaries and artioles, where RBCs do not travel in isolation and their interactions with one another and the vascular wall cause them to stretch by up to 150%. As a result, the role of deformability in influencing RBC function has been studied extensively [14, 21, 70]. Furthermore, compromised RBC deformability contributing to human disease pathologies has also been a topic of growing research interest. For example, hereditary blood disorders such as spherocytosis, ellipocytosis and ovalocytosis, as well as diseases such as diabetes, sickle cell anemia, and malaria all exhibit character-istic losses in RBC deformability with the onset and progression of the pathological state. For the case of Plasmodium falciparum (P.f.) malaria, recent experiments showed that the membrane stiffness of the parasitized RBC can increase more than
20-fold during intra-erythrocytic parasite maturation [102, 67]. Such changes act in concert with enhanced cytoadherence to other RBCs and the vascular endothelium
to facilitate vaso-occlusive events such as stroke or other ischemias. In addition to its impact on disease pathologies, the deformability of the RBC is also of interest for the development of advanced in-vitro tools for the purposes of drug efficacy studies and the development of diagnostic platforms. Furthermore, RBC deformability and its impact on blood-flow and the development of vaso-occlusions is of direct importance in the performance more traditional implantable devices, such as heart valves and stents [95].
Despite such broad and growing interest in RBC deformability, much of the quan-titative understanding of single-cell deformability characteristics has been limited to quasi-static experiments, where only a limited range of deformation rates are exam-ined. While such single-cell, quasi-static assays have helped establish connections between the biophysical characteristics of RBC and disease states [102], they do not adequately capture the reality of various biorheological events associated with the flow of a population of RBCs through the microvasculature. Where more physiologically relevant, dynamic or flow characteristics of RBCs have been presented, they are often times limited in their quantitative nature and/or do not consider physiologically rele-vant temperature conditions. Furthermore, very little quantitative information exists on the dynamic and flow behaviors of diseased RBCs, such as those parasitized with P.f. malaria at relevant length scales and temperature.
In this thesis work, two experimental approaches were used in order to satisfy the need for additional quantitative insight into the dynamic behavior of healthy and dis-eased RBCs. First, an advanced optical tweezers system was implemented to examine the dynamic response of human RBCs over the broadest range of time-scales, frequen-cies and largest deformations reported to date with optical trapping techniques. In addition, this trapping system was used by collaborators to study the mechanical response of the human RBC as a function of temperature and disease progression in P.f. malaria. The effect of a specific parasitic protein (ring-infected erythrocyte surface antigen, RESA) on the mechanical behavior of the RBC membrane was also examined. Second, a microfluidic system was employed in order to quantify the flow dynamics of healthy and diseased RBCs at the smallest relevant length scales, as well
as physiological temperatures.
An important aspect of these optical trapping and microfluidic characterizations is their ability to be utilized in the development and validation of advanced com-putational models of microvascular flow. Therefore, where applicable, the results of a collaborative effort in computational modeling using dissipative particle dynamics (DPD) are presented in conjunction with experimental results in order to highlight the utility of such a combined experimental and modeling approach. This framework may be accessed to develop robust models that can be used for in vivo predictions. The insight gained from a systematic combination of simulations and experiments could also be used in the design and optimization of novel microfluidic systems for disease diagnostics and drug efficacy assays and in the interpretation of the role of mechanical and rheological cell properties in disease pathologies. Such insight may, in turn, lead to new therapeutic approaches for treatment.
Chapter 2
Background
2.1
Red Blood Cell Deformability
Red blood cells (RBCs) comprise 40-50% of human blood volume and are the pri-mary vehicle for oxygen delivery to the tissue and vital organs of the body [11].
A mature RBC does not contain a nucleus and is comprised of a membrane
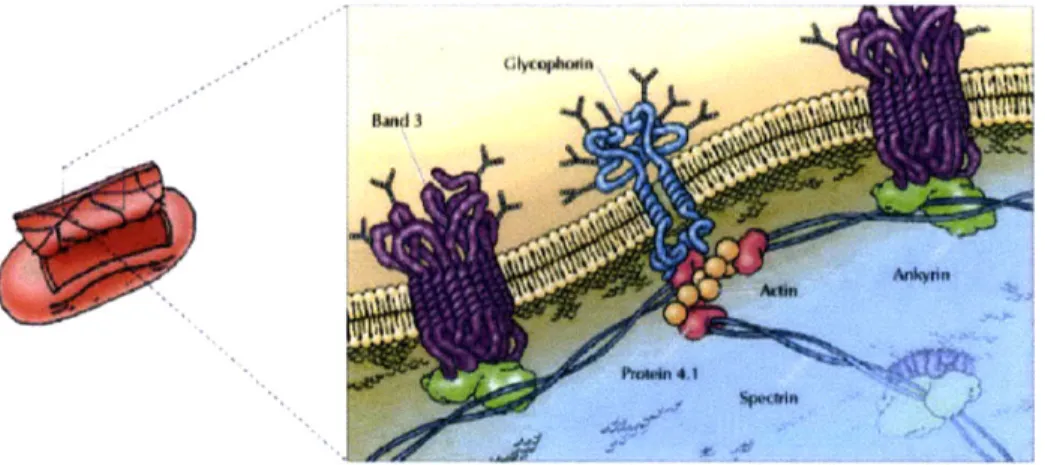
struc-ture and an internal fluid environment. The RBC membrane is comprised of a lipid bilayer and an underlying spectrin network. This general structure is depicted in Figure 2-1. The phospholipid bilayer contains cholesterol molecules with polar, hy-drophilic head groups and a hydrophobic core, as shown in Figure 2-2, as well as integral/transmembrane proteins that form the attachment sites for the spectrin net-work. The detailed structure of the spectrin network is shown in Figure 2-3. The primary subunit of the spectrin network is a spectrin tetramer, which is composed of two head-to-head aligned heterodimers, themselves made up of intertwined alpha and beta spectrins. The end of each spctrin tetramer is linked to a junction com-plex of f-actin and band 4.1 proteins, which is in turn anchored to the bilayer via glocophorin. In addition, band 3 and ankyrin also form a complex that is anchored to the bilayer at intermediate points along the spectrin tetramer. Topologically, the spectrin network is a triangulated network, as shown in Figures 2-3 and 2-4 [2, 61].
The typical, at-rest, shape of the RBC is that of a biconcave disc with an average major diameter of approximately 7-8 pm and thickness of approximately 2.5 pm [43].
Figure 2-1: General structure of the Red Blood Cell (RBC). (Taken from Alberts et
al.
[2])
Polar head groups
Figure 2-2: Structure of a phospholipid bilayer. (Taken from Lodish et al. [61])
adtucin
P\WP
WWt.ouI o~
mm
tOG
Figure 2-3: Graphical depiction of the structure of the RBC spectrin network. from Alberts et. al. [2])
(Taken
Figure 2-4: Electron micrograph of the RBC spectrin network. (Taken from Alberts et. al. [2])
This characteristic shape is shown in Figure 2-5. As discussed in Chapter 1, as part of its normal physiological function, this shape is required to deform severely as it undergoes nearly 500,000 cycles of deformation through its 120-day lifetime, often times being required to pass pores or slits with characteristic lengths and diameters down to 2-3pm. Several examples of such deformation levels are shown in Figure 2-6. With such severe mechanical deformations required for the human RBC to per-form its primary function, it is no surprise that reduced RBC deper-formability plays a role in the pathology of several diseases and disorders. These include hereditary dis-orders such as spherocytosis, elliptocytosis, ovalocytosis and sickle cell anemia, where genetic mutations cause deficiencies in either the spectrin network or the hemoglobin that lead to reduced deformability. Alteration of RBC membrane properties is also a part of the pathology of infectious diseases such as malaria, where structural mod-ifications made by parasitic proteins lead to significantly reduced deformability and increased cytoadherence. The role of RBC deformability in blood flow and its man-ifestation in haemotological disorders is well-reviewed by several authors, including Mohandas [69], Chien [21], Hochmuth and Waugh [51], and Mohandas and Evans
I
t
RBC Cross-Section
Average RBC Geometry:
Diameter = 7.82Im
Max. Thickness = 2.58
[Lm
Volume
=
94
sm
3Surface Area = 135 im
2(a)
(b)
Figure 2-5: (a) Colorized electron micrograph illustrating the typical biconcave shape of human RBC. (Taken from Lodish et. al.[61]), (b) Average geometric cross-section and corresponding surface area and volume (Adapted from Fung [43])
reduced deformability acts in concert with other factors, such as cytoadherence, to facilitate the occurrence of vaso-occlusive events that may lead to ischemia and/or, in the extreme case, stroke and death.
2.1.1
RBC membrane elasticity
The elastic properties of the RBC have most frequently been characterized using mi-cropipette aspiration, whereby a portion of the RBC membrane is drawn into a glass micropipette using suction pressure [88, 37, 51, 21, 109]. Measuring the geometry changes of the cell into the pipette, such as the projected length of the membrane in the glass tube combined with predictions from numerical and analytical models, allows one to determine the mechanical properties of the membrane, such as the membrane shear modulus (pt) and the area expansion modulus (K). In addition, other techniques, such as buckling instability measurements and thermal fluctuation measurements, allow for an estimate of the bending modulus of the membrane (B,)
(a)
(b)
(Pries, Secomb
(C)
1990)
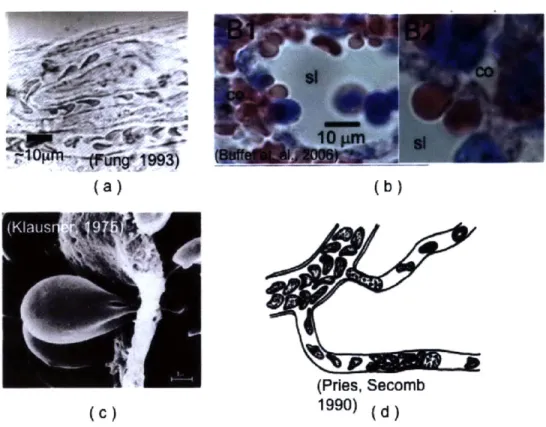
(d )Figure 2-6: Examples of large deformations of RBCs in the microvasculature: (a) Bright field, phase image of RBC flow in the canine microvasculature. (Taken from Fung. [43]), (b) Histological stain of ex-vivo spleen perfusion experiment showing the passage of red cells (stained red) across the splenic sinus wall from the cords (co) to the sinus lumen (sl). (Taken from Buffet et. al [18]), (c) SEM image of mouse RBC passage across circular pores in the spleen (Taken from Klausner [56]), (d) graphical depiction of RBC flow in the microvasculature in the presence of white cells. (Taken from Pries and Secomb, [85])
in Table 2.1. It has been shown that these values do not vary significantly between room and physiological temperatures (22-41 C) [109].
Area Expansion Modulus (K) 300 - 500mN/m [37, 51, 21, 109] Membrane Shear Modulus (p,) 4 - 10pN/m [37, 51, 21, 109] Bending Modulus (B0) (1.7 - 9) - 10- 9Nm [38, 40]
Table 2.1: Elastic properties of the healthy human RBC
At the molecular level, the lipid bilayer is responsible for the strong resistance to area changes in the RBC membrane. The bilayer is also responsible for the relatively small amount of bending resistance. However, the bilayer is not capable of resisting shear deformations. Thus, the underlying, two-dimensional spectrin network is re-sponsible for the shear resistance of the RBC membrane. It is this shear resistance that is considered to be the major property of interest when considering the overall RBC deformability [37].
Other techniques have been employed to measure the quasistatic, elastic prop-erties of the RBC membrane. These include laminar shear flow experiments [104], spectroscopic techniques measuring thermal fluctuations [75] and, most notably for this work, optical tweezers [47, 101, 30, 29, 28]. The first experiments utilizing an optically trapped bead to impart tensile forces to an RBC and attempt to extract mechanical properties were reported by Henon et al. [47]. This work reported an RBC membrane shear modulus of 2.5 ± 0.4pN/m, which is significantly lower than the typically measured range of 4 - 10piN/m. This discrepancy may be attributed to the fact that, in their analysis of the measured force-displacement response of the cell, Henon et al only considered a linear-elastic, small deformation constitutive model of the RBC membrane and did not consider the effects of contact area between the bead and cell. A subsequent study by Sleep et. al. [101] over-estimated the membrane shear modulus by at least one order of magnitude compared to the typically accepted values. This is also likely due to incorrect assumptions about the RBC shape as either a planar disc or a sphere and failure to account for the large contact area between the trapped beads and cells. More recently, Mills et. al. and Dao et. al. combined
optical tweezers with a finite element study to determine the elastic properties of the RBC membrane [30, 29, 28]. This combined experimental and modeling approach ac-curately accounted for the RBC shape and contact areas during an experiment. As a result, their results were in much better agreement with other traditionally-accepted techniques such as micropipette aspiration.
2.1.2
RBC membrane viscosity
Much of the current understanding of the RBC membrane viscosity is built upon the work of Evans and Hochmuth [39, 49], who described the stress in an RBC mem-brane undergoing finite deformations as the superposition of elastic and dissipative or viscous components:
Ti = TRe + T (2.1)
Where the elastic component of stress
T - Kaij + p[ti (2.2)
Where K is the area expansion modulus, a = A, - 1 is the area expansion, and y is the shear modulus. The viscous stresses are expressed as a constant (17e, the
membrane viscosity) times the rate of deformation (Vi):
T",' = 2TIe Vjj (2.3)
For the case of an incompressible material (AA2 = 1) in uniaxial tension,
Tu = (p/2)(A2
-A-
2) + 417e(dA/dt)(1/Aj) (2.4)
Under conditions when external forces such as fluid shear are small compared to the internal membrane forces, the elastic stresses must balance the viscous stresses:
Under uniaxial tension, Equation 2.5 reduces to:
(p/2)(A -- A--2) +4ie(dA/dt)(1/Ai) = 0 (2.6)
For a given set of initial stretch values (AQ), Equation 2.6 has the solution:
((A2 - 1)/(A 2 + 1)) =
((Ar
- 1)/(Al0 + 1))e/tc (2.7)Where tc = 277e/p is the characteristic time constant for the membrane material. This relationship has been applied to experiments measuring the relaxation charac-teristics of RBCs upon release from micropipette aspiration to determine tc = 0.3s. With the range of shear modulus in Table 2.1, the membrane viscosity is in the range: ?e= 0.6 - 1.5pNs/m [39]. Further experiments measuring the relaxation time of an RBC deformed at diametrically opposite ends using a dual micropipette aspiration configuration estimated the characteristic time to be approximately 0.2-0.26s [49]. Similar relaxation measurements made by Mills et. al [68] using optical tweezers yielded similar results as the dual micropipette configuration used by Hochmuth et. al. [49].
Subsequent to the work done by Hochmuth and Evans, Engelhardt et. al. mea-sured the time-dependent extension and relaxation characteristics of the RBC under forces resulting from a high-frequency electric field [35, 36]. This work suggested two time-scales present in the response of the RBC: a short time scale (tc1 = 0.1s) and
a long time-scale (tc2 = 1.0s) governing the initial and long-term response of the
RBC, respectively. More recently, Puig-De-Morales-Marinkivic et. al have examined the viscoelastic response of the RBC membrane using magnetic twisting cytometry (MTC) [86]. This work suggests that the single or two time-scale descriptions of the RBC membrane viscosity are not sufficient to describe the RBC membrane behavior. Instead, considering the RBC membrane as a viscoelastic material with a complex modulus (G* = G' + iG"), this work found a strong dependence of the loss modulus
(G") of the membrane with frequencies from 0.1-100Hz. This dependence is best
done under very low levels of applied force/deformation, with applied strain energies on the order of 0.1pJ/m2, compared to 1 - 10p J/m
2 in the work of Mills and in
this thesis work [30, 29, 28]. The implications of larger deformation levels on the apparent rate and/or frequency-dependent response of the RBC membrane, as well as the appropriate scaling to describe the dissipative nature of the RBC membrane are subjects of this thesis work.
2.1.3
RBC flow in the microvasculature
There is a large body of classical work that has characterized the effective viscosity of whole blood as a function of vessel diameter and hematocrit. This work is well-reviewed in the texts by Fung [43, 44]. Generally speaking, in vessels on the order of 100 pm in diameter or larger, such as major arteries, blood can be described as a thixotropic fluid with a constant viscosity of 3.5cP (3-4 times that of water) under shear rates above 200s'. However, as length scales approach the smallest regions of the microvasculature (less than 10pm diameters), an effective viscosity description is insufficient and contributions of the properties of individual cells must be considered. Such length scales and flow behaviors are a focus of this thesis work.
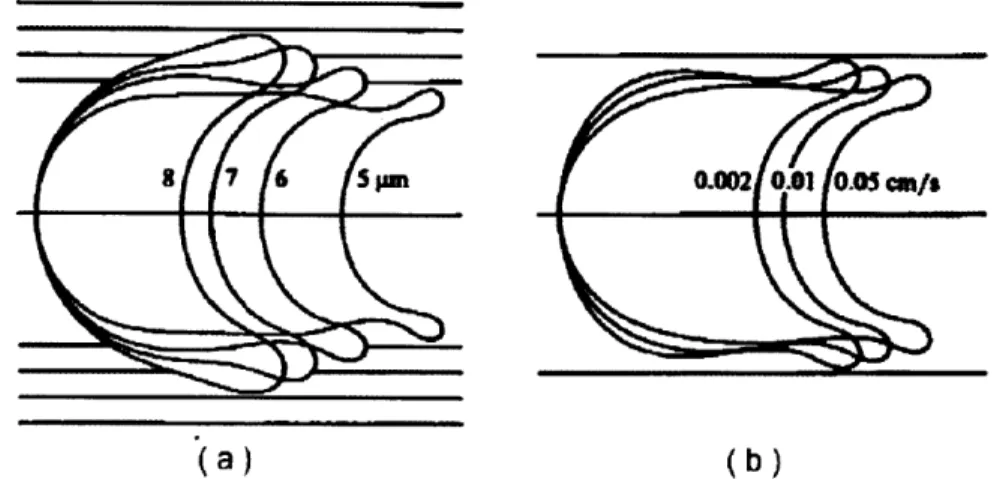
The biophysical factors affecting blood flow in the microcirculation are well-reviewed in the literature (e.g. Pries et. al. [84], Skalak et. al. [100], Schmid-Schonbein [90], Popel and Johnson [81]). Specifically, there exists a large body of work analyzing the flow of RBCs in vessels comparable to or smaller than the cell diameter. Much of this work builds upon the analysis presented by Lighthill of the flow of deformable pellets through narrow tubes [60]. Secomb et. al. [94] applied lubrication theory when considering the flow of an axisymmetric cell with shear and bending properties of the healthy RBC and determined, amongst other things, the equilibrium shapes of the RBC as a function of vessel diameter and flow velocity. Theses shapes are reproduced in Figure 2-7. Subsequently, Secomb and Hsu ex-tended this analysis to consider the transit of red blood cells across pores comparable to the microvasculature [92]. In this analysis, the effects of membrane viscosity and external fluid viscosity were included and it was determined that the role of these
(a)
(b)Figure 2-7: Steady-state shapes of axisymmetric cells flowing through cylindrical tubes. (a) Cell shapes in varying diameter tubes with a cell velocity of 0.01cm/s, (b) Cell shapes in a vessel diameter of 6pm subjected to varying flow velocities. (Taken
from Secomb et. al.
[94])
viscous components on flow inhibition (i.e. increased transit time) is more signifi-cant than membrane elasticity at diameters below 6pm. However, like the previous work, this analysis had limited experimental validation and was restricted to the axisymmetric flow case. More recently, several groups have attempted much more advanced computations and simulations of RBC biorheology and microvascular flow [94, 92, 34, 27, 10, 74, 22, 82]. However, these computational approaches typically lack rigorous validation by either in-vivo or in-vitro experiments. This thesis work will present a framework allowing for experimental validation of modeling approaches attempting to describe the full three-dimensional flow behavior of the RBC.
In-vivo characterizations of microvascular flow in animal models have been pre-sented by several groups (e.g. [85, 21, 33, 54]). Much of this work is well-reviewed
by Fung [44]. These in-vivo experiments have provided important validation of the
role of RBC deformability in microvascular flow. For example, RBCs stiffened by incubation with diamide or gluteraldehyde have shown decreased cell survival, in-creased splenic sequestration and inin-creased filtration resistance in perfusion studies using canine and rat mesentary models [21, 33, 54]. In addition, perfusion studies of rat skeletal muscle have been coupled with insights from computational models
to suggest that the RBC membrane viscosity has a significant role in increasing flow resistance in the microvasculature [91].
More recently, Jeong et. al. [53] were able to use a high speed imaging technique to measure microvascular flow in the microcirculation of anesthetized rats whose natural heartbeat is maintained through a life support system. Typical RBC velocities measured were approximately 2mm/s in vessels of approx. 6 pm diameter. This work provides some of the most quantitative measurements of individual cell velocities in the smallest regions of the microvasculature to date. However, in this work, like many others, significant uncertainties exist in the vessel geometry and there are no concurrent measurements of the pressure profile along the vessel of interest. Generally speaking, due to imaging and other experimental constraints (i.e. size constraints complicating the integration of local pressure probes), there have been few attempts at simultaneously characterizing flow velocities, pressure differentials and geometry in-vivo. Furthermore, there are no such studies at the length scales of interest in this thesis work (down to approx. 3pm diameter), such as those present in the spleen (see Figure 2-6).
In order to overcome this limitation, in-vitro assays of RBC flow through glass tubes [14, 50] and microfabricated fluidic structures made of glass, silicon or poly-dimethylsiloxane (PDMS) have been developed [3, 48, 97, 99, 107, 17]. These in-vitro experiments have suggested an increased role of the dynamic properties of the RBC under flow conditions. For example, Brody et. al. [17] have suggested that the time-scales of the RBC cytoskeleton's active reorganization is a significant factor of the ability of the RBC to traverse narrow pore-like structures. In-vitro flow studies have also established semi-quantitative links between decreased RBC deformability and inhibitied flow [99, 97]. However, there still remain a few short-comings of this body of work. Most notably, like in-vivo experiments, there is virtually no experimental quantification of flow characteristics (e.g., pressure difference versus cell velocity) of RBCs through constrictions of well-known geometry of the smallest relevant length scales (approx. 3 pm in diameter) whereby the dynamics of RBC deformation charac-teristic of the conditions in the microvasculature can be simulated and visualized. In
a few isolated studies where RBC flow has been studied through such small channels
[97, 99, 98], the dynamics of flow has not been quantified or analyzed so as to
facili-tate broad conclusions or to help facilifacili-tate the development of general computational models. Furthermore, when attempts to quantify such RBC dynamics have been made, they often do not take into account the effects of physiological temperature conditions [1, 41]. Providing such a fully quantitative study of RBC flow in the small-est length scales of the microvasculature at physiologically relevant temperatures is an important contribution of this thesis.
As a final note regarding microvascular flow, there exist a growing body of recent work examining the role of the microvascular glycocalyx, or endothelial surface layer
(ESL) (e.g. [93, 83, 27], and the reviews of Kamm [55], Popel and Johnson [81], and
Weinbaum et. al. [112]). This network of polysaccharides and glycoproteins on the surface of endothelial cells lining much of the microvasculature is approximately 0.5 pm thick and is an additional source of hydrodynamic resistance in microvascuature. As such, the glycocalyx is often hypothesized to be the source of discrepancies between in-vitro and in-vivo flow experiments. In addition, the glycocalyx is also thought be an integral part of the transduction pathway between fluid shear and the motility of the vascular endothelium [114]. The experimental results presented in this work do not explicitly account for the interaction of the RBC with the glycocalyx. However, where applicable, the extension of these results into future studies and simulations involving the glycocalyx will be discussed.
2.1.4
Deformability of Plasmodium falciparum malaria
par-asitized RBCs
P. falciparum malaria is the most severe of the four different plasmodium species capable of parasitizing human RBCs. The annual infection rate of P.f. malaria is on the order of several hundred million people and it is estimated to be responsible for several million deaths [65, 110]. The highest percentage of fatal cases of P.f. malaria occur in children, pregnant women and the elderly. A graphical description of the
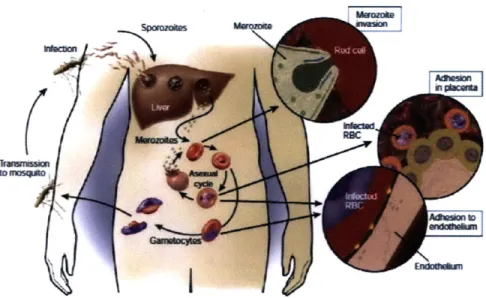
Figure 2-8: Life cycle and pathogenesis of P.falciparum malaria (Taken from Miller et. al. [65])
life cycle and pathogenesis of P.f malaria is shown in Figure 2-8. Upon transmission through a bite from the female anopheles mosquito, the malaria sporozoites travel to the liver. In the liver, each sporozoite, may develop into tens of thousands of merozoites. Upon release from the liver, merozoites invade red blood cells and begin the asexual life cycle of the parasite. This intra-erythrocytic life cycle is approximately 48 hrs and is broken down according to three characteristic stages (see Figure 2-9):
" Ring Stage (0-24hrs): The parasite resides as a thin discoid or ring-shaped
feature with slightly enhanced size and pigment near the end of the stage. In this stage, the RBC generally retains its biconcave shape.
* Trophozoite Stage (24-36 hrs): The parasite growth accelerates and develops more pigmented regions. The parasite begins to grow rapidly and develop knobs or bulges at its surface.
" Schizont Stage (36-48 hrs): The parasite divides, producing up to 20 new mero-zoites. Knobs form on the surface of the RBC, which may serve as adhesion sites. The RBC also has a much more spherical shape.
. ... ...
Invasion Schizont (36 - 48 h)
Ring Trophozolte (0 - 24 h post Invasion) (24 - 36 h)
Figure 2-9: Intra-erythrocytic, asexual life-cycle of P.falciparum malaria (Taken from
Alberts [21)
The body's natural immune response to malaria predominantly involves removal (aka "pitting") of the parasite, followed by phagocytosis by lymphocytes in the spleen. However, as the parasitemia increases, splenic clearance is insufficient. Throughout this entire life cycle, in addition to the severe structural evolution in the RBC, it has been shown that reduced deformability is a characteristic of the parasitized cell [24, 25, 45, 1041. In the trophozoite and schizont stages of parasite development, this decreased deformability is accompanied by increased cytoadhesion of the RBC mem-brane to other RBCs and vascular endothelium [65, 23]. Thus, it is likely that these factors act together to bring about red cell sequestration in the microvasculature and ischemia of major organs. Such sequestration and occlusive events contribute signifi-cantly to the occurrence of cerebral malaraia, hypoglycaemia, metabolic acidosis and respiratory distress [65]. This phenomenon of decreased deformabilty in parasitized RBCs was previously quantified using micropipette aspiration [45, 76] and laminar shear flow [26, 104]. Following that work, Suresh et. al. [102] used an optical trap-ping technique to demonstrate that the RBC membrane shear modulus may increase
100
0-
El
Mipeft AsWn (G~eilm et af-)Z
*
LP~w She a lw (Swonwusk atat.) % 80 W Twm aSuh at a. aWNis e t al.)S60
E
20
S20-Healthy Parasite- Ring Trophozoite Schizont RBC ree RBC pRBCs
Figure 2-10: Membrane shear modulus of P.f. malaria as a function of intra-erythrocytic stage (Taken from Mills [66])
are presented in Figure 2-10. Most recently, Marinkovic et. al. [62] have charac-terized the complex modulus of parasitized RBCs as a function of temperature using magnetic twisting cyctometry (MTC). This combination of data generally shows that both membrane stiffness and viscosity increase with the development of the parasite. Extending this general result to larger applied forces, as well as looking at the con-tribution of an individual erythrocytic proteins using an advanced optical trapping method is a major contribution of this thesis work.
In addition to membrane mechanical property measurements, there have also been attempts at characterizing the microvascular flow behavior of parasitized RBCs. Most notably, Shelby et. al. and Handayani et. al. have used simple microfluidic struc-tures to demonstrate that parasitized cells are less capable of traversing channels with smallest dimension ranging 2-8 pm [97, 46]. As with the aforementioned in-vitro studies of RBC flow in the microvasculature, these studies did not provide a robust characterization of the hydrodynamic forces (i.e applied pressure-velocity) such that the physiological relevance of the results may be inferred or that they may be applied to the development of analytical and computational models. Such quantitative char-acterizations of parasitized cells is a part of this thesis work. More recently, Antia
et. al. have used microfluidic structures to investigate adhesive interactions of par-asitized cells flowing over endothelial-lined surfaces [3]. Such adhesive interactions are not the subject of this thesis work. However, where appropriate, the interplay between adhesion and reduced deformability will be highlighted.
2.2
Background on Optical Trapping
Particle trapping by radiation pressure from a laser was first demonstrated by Ashkin
[7] with subsequent development leading to the formation of the first stable, three
dimensional optical trap from a single laser beam by Ashkin et. al. [9]. Shortly thereafter, Block et al. demonstrated one of the first applications of single beam op-tical trapping to biological systems in the measurement of the compliance of bacterial flagella [12]. Since that time, optical traps have been used extensively in the manipu-lation of biological cells and in the measurement of biological forces at the molecular level. The history of optical traps and their applications in biology is well-reviewed in the literature [8, 72, 96]. The optical trapping configurations used in this thesis work overcome two key disadvantages of the micropipette aspiration technique: (1) the presence of any increased cytoadherence causes friction along the wall of the pipette and complicates the interpretation of results and (2) micropipette aspiration is lim-ited in its dynamic range and resolution (largely due to image processing and pressure control systems employed). With optical trap systems, the effects of adhesion on the interpretation of results is minimal, enabling the investigation of biological systems where both altered cytoadherence and deformability are present. This thesis will also show how the dynamic capabilities of an advanced optical trap allows for a host of new experiments to be performed on the RBC membrane. In addition, optical traps have the general advantage over micropipette and other experimental approaches (laminar shear flow, AFM) in that the applied stress state is more readily reproduced in three-dimensional computational simulations. This allows for a more accurate in-terpretation of experimental results and the ability to parametrically investigate the effects of experimental uncertainties such as cell shape and contact conditions on the
extraction of mechanical properties. The following sections will establish the physical principles behind optical trapping systems and describe the major components and layout of an advanced trap system and the techniques that are commonly used in their calibration.
2.2.1
Principles of optical traping
A laser beam passing through a high numerical aperture microscope objective and
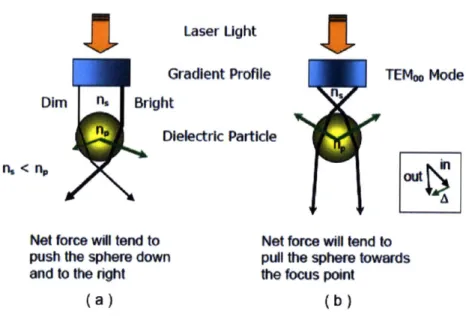
focussed onto a dielectric particle, typically a glass or polystyrene bead, will place that particle in a three-dimensional potential well. Within this potential well, the interaction of the laser beam and the particle gives rise to two characteristic forces: the scattering force and the restoring, or gradient, force. The scattering force arises from the momentum transfer of light that is reflected from the particle, tending to push the particle away from the focal plane. The gradient force arises from the refraction of light, whereby the momentum transfer of photons will tend to pull the particle towards the focal point of the laser beam. The magnitude of these two forces vary with a host of factors, including the wavelength of light used and the laser power, the diameter of the particle. The mathematical description of these forces in the ray optics regime (i.e. particle diameter is much larger than the wavelength of light dp >> A) or the Rayleigh
/
electromagnetic dipole regime (i.e. d, >> A) are presented throughout the literature (e.g. [89, 96]). The gradient and scattering forces are described using ray optics in Figure 2-11.In stable traps, the gradient force dominates the scattering force, allowing the particle to be maintained near the focal plane of the laser beam. This is achieved through the use of a laser with a TEMoo or Gaussian mode. At the center of the trap, a particle has a net force of zero. However, when displaced from the center of the trap by an outside force, the restoring force will act to pull the bead back to the focal point. The magnitude of this force is dependent on the displacement from the center of the trap. However, within a range of displacements, this force varies linearly with radial displacement. The radius of this linear region is typically on the order of 100nm - 1pm, depending on the particle size. Within this linear regime,
Laser
Light
Gradient Profile
TEMeo Mode
Dim nl BrightDielectric Particle
n.< nout
Net force will tend to
Net force will tend to
push the sphere down
pull the sphere towards
and to the right
the focus point
(a)
(b)
Figure 2-11: Ray optics representation of optical trapping. (a) Unstable trapping with a non-Gaussian beam, (b) Stable trapping with a Gaussian beam. In both cases, the particle is attracted towards the focal point. (inset) Refraction gives rise to the gradient/restoring force. Figure taken with permission from Brau [15]
the trap has a characteristic stiffness(K) that may be empirically determined using one of the techniques described below. With a known trap stiffness, measuring the displacement of the bead from the center of the trap within this linear regime allows one to determine the force applied to the trapped particle.
2.2.2
Optical trapping system and components
The layout of a high-end optical trapping system employing laser-based detection is shown in Figure 2-12. This system, like most used in biological systems, employs a high-power infrared trapping laser (A = 1064nm), colinear with a low-power infrared
(A = 975nm) detection laser. These wavelengths are used due to the limited
absorp-tion of biological molecules in the infrared spectrum, ensuring that the laser does not damage the molecules or cells when trapped particles are brought into contact with them. The lasers are passed through a high N.A. objective of a modified inverted microscope. At the specimen/imaging plane, the specimen is commonly mounted on a manual positioning stage and, as in the case of this thesis work, a high resolution,
closed-loop controlled piezo stage capable of sub-micron displacements. An image of the condenser back focal plane formed by the detection laser is monitored on as position sensitive detector (PSD), which produces an X and Y voltage proportional to the position of a spot on is active sensing area (analogous to the quadrant photo-diodes commonly used in AFM systems or earlier trapping systems). Alignment of the various optical paths are achieved through the use of three different telescope lens pairs. The trapping laser is steered using acoustic optical deflectors (AOD), which utilize piezo crystals to form diffraction gratings whose position response time is less than ims. Further details on the components used in this system are provided later and in the literature [57, 72, 96, 105].
2.2.3
Optical trap calibration
In the most commonly applicable configurations of an optical trap, the beads used have diameters that are comparable to the wavelength of the trapping laser (both approximately 1 pm). Thus, neither the ray optics or Rayleigh analyses can be used to assume a quantitative trap stiffness. Thus, an important aspect of employing optical traps is their bead position measurement and trap stiffness calibrations. The following summarizes the techniques most commonly used for these tasks. For further details on these techniques, the reader is referred to the reviews of Neumann and Block and Svoboda and Block [72, 105].
Bead position measurement system calibration
The typical calibration of the bead position detection system first requires the cali-bration of the CCD camera image. For this, a ruled or grid slide (i.e. Ronchi Ruling) may be used in order to establish the translation of CCD pixel coordinates to physical length units (nm or pm). Following this calibration, displacements of a trapped bead via changes in frequency of the AOD may be used to establish a correlation of AOD frequency with physical displacement. Using the AOD to move the trapped bead
K
L
Position
Detector
A-
H
C
G
DE
F
M
Figure 2-12: Representative layout of a high-end laboratory optical trap: (A) 1064 nm trapping laser, (B) acoustic optic deflector (AOD) for high speed beam steering, (C) telescope lens pair for trap beam alignment and expansion only, (D) 975nm detection laser, (E) telescope lens pair for detection beam alignment and expansion only, (F) telescope lens pair for simultaneous alignment and expansion of trap and detection beams, (G) high numerical aperture objective (60 -10OX, N.A. > 1.4), (H) condenser lens, (I) dichroic mirror used to integrate trap and detection beams into microscope optical path, (J) dichroic mirror to direct beams to detection branch, (K) bright field lamp, (L) position detection branch with band pass filter to eliminate 1064 nm wavelength and focus detection beam onto position sensitive detector (PSD),
(M) CCD camera for conventional imaging, (S) specimen plane. Figure used with permission from P. Tarsa and caption used with permission from D. Appleyard [4]
6.7 . 44 .0 X -24.2. 0.22 aoY .tontu -0 o 0. .2 052 -- 0 5 0 .2 02
A YG~MMA03X P M iaM AM Y POgla 114 -4 AMO X Pbsoic Pub]
4 A 0 -2 Position (nm) ( C )
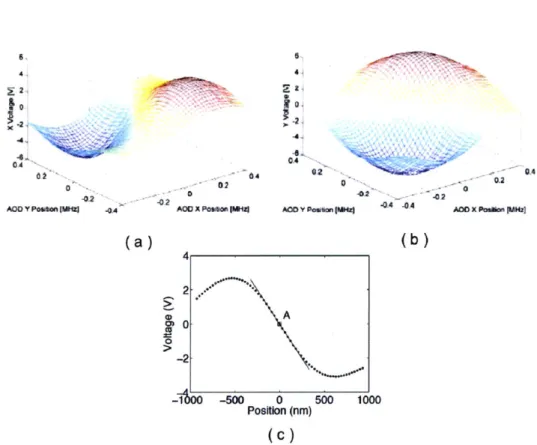
Figure 2-13: Example position calibration of an optically trapped bead. (a) and (b) show the X and Y voltage signals, respectively, from the PSD as the bead is moved across the detection region in both AOD coordinate directions. (c) The PSD signals as the bead is moved in a single direction, highlighting the linear detection region. (Figures (a) and (b) taken from Brau [15] and (c) from Appleyard [4].)
position sensitive detector (PSD) allows allows for the mapping of AOD frequency coordinates to PSD X and Y voltage signals. This mapping is commonly fit using a fifth-order polynomial. With the fifth-order function to map PSD X and Y volt-ages to AOD frequency coordinates, the previously established conversion from AOD frequency to physical displacement coordinates allows for a complete mapping of the
PSD signal to the bead position relative to the center of the trap position. This
mapping process is shown in Figure 2-13.
Trap Stiffness Calibration
Stokes drag technique: This technique employs the flow of fluid around a trapped bead and the corresponding measured displacement to determine the trap stiffness.
m ... ... .... . ...
![Figure 2-10: Membrane shear modulus of P.f. malaria as a function of intra- intra-erythrocytic stage (Taken from Mills [66])](https://thumb-eu.123doks.com/thumbv2/123doknet/14753941.581526/37.918.271.673.131.435/figure-membrane-modulus-malaria-function-erythrocytic-taken-mills.webp)