HAL Id: tel-02839538
https://hal.inrae.fr/tel-02839538
Submitted on 7 Jun 2020
HAL is a multi-disciplinary open access archive for the deposit and dissemination of sci-entific research documents, whether they are pub-lished or not. The documents may come from teaching and research institutions in France or abroad, or from public or private research centers.
L’archive ouverte pluridisciplinaire HAL, est destinée au dépôt et à la diffusion de documents scientifiques de niveau recherche, publiés ou non, émanant des établissements d’enseignement et de recherche français ou étrangers, des laboratoires publics ou privés.
Evaluation of risks and monitoring of nitrogen fluxes at
the crop level on the Romanian and Bulgarian plain.
Application to maize, wheat, rapeseed and sugar beet
B. Leviel
To cite this version:
B. Leviel. Evaluation of risks and monitoring of nitrogen fluxes at the crop level on the Romanian and Bulgarian plain. Application to maize, wheat, rapeseed and sugar beet. Life Sciences [q-bio]. Institut National Polytechnique, 2000. English. �tel-02839538�
ph. D. thesis - B. Leviel
INRA-INPT - March 2000
THESE
Présentée pour obtenir
LE TITRE DE DOCTEUR DE L'INSTITUT NATIONAL
POLYTECHNIQUE DE TOULOUSE
SPECIALITE: SCIENCE DE L'EAU ET ENVIRONNEMENT
Par
Bruno LEVIEL
Ingénieur ENSEEIHT
Evaluation des risques et maîtrise des flux d'azote au niveau d'une
parcelle agricole dans la plaine roumaine et bulgare. Application
aux cultures de maïs, blé, colza et betterave.
Evaluation of risks and monitoring of nitrogen fluxes at the crop
level on the Romanian and Bulgarian plain. Application to maize,
wheat, rapeseed and sugar beet.
Soutenue le 30 MAI 2000 devant le jury composé de: M. Lucien Masbernat
Professeur à l'INP Toulouse M. André Falisse
Professeur à Gembloux, Belgique M. Nader Katerji
Directeur de recherche à l'INRA de Grignon M. Ghislain Gosse
Directeur de recherche à l'INRA de Grignon (directeur de la thèse) M. Michele Genovese
Docteur, Commission Européenne
Président
Rapporteur Rapporteur
Abstract / Résumé ph. D. thesis - B. Leviel
INRA-INPT - March 2000
Abstract
Environment has become a major concern all over Europe, notably regarding non-point source pollution from agriculture. Not only groundwater but also rivers and seas are subject to nitrogen and other compounds fluxes linked to agricultural productions, and their impact on environmental factors as drinking water quality, toxicity or biodiversity.
Because of economic reasons, these questions are not yet priorities in eastern Europe. However, the Bulgarian and Romanian plains, which constitute the Danube's terminal watershed with the Black Sea as outlet, need actions as this project promoted by EC.
The aim was to develop and apply a methodology in country-specific conditions in co-operation with local searchers. The results expected were recommendations to local agriculture and maintain of research and development potential of eastern Europe partners.
Typical situations were defined from information about the most common crops and soils. Modelling of the Soil-Plant System was then used as a second step to extrapolate typical situations to regional situations. To that end, a first series of experiments was performed to calibrate the model parameters. An in situ model validation was performed with independent series of experiments. From these models, both a risk evaluation and an identification of sensitive zones was done in relation to the current agricultural practices. An analysis based on long-term climatic records was used. It aimed at developing sustainable agricultural techniques suited to the site-specific characteristics.
The results are an estimation of the risk level and a definition of the means to reduce nitrogen percolation downwards into deep ground water and/or rivers.
Résumé
L'environnement est devenu une préoccupation majeure dans toute l'Europe, particulièrement en ce qui concerne les pollutions agricoles diffuses. Les eaux souterraines mais aussi rivières et mers sont exposées aux flux d'azote et autres composés liés aux productions agricoles, et à leur impact sur les facteurs environnementaux tels la qualité de l'eau potable, la toxicité ou la biodiversité.
Pour des raisons économiques, ces questions ne sont pas encore prioritaires en Europe de l'Est. Pourtant, les plaines bulgares et roumaines qui constituent le bassin versant terminal du Danube avec la Mer Noire comme exutoire nécessitent des actions comme ce projet financé par l'UE.
L'objectif était de développer et appliquer, dans les conditions de ces pays, une méthodologie spécifique en coopération avec les chercheurs locaux. Les résultats escomptés étaient des recommandations pour l'agriculture locale et le maintien du potentiel de recherche et développement des pays de l'Est partenaires.
Des situations types ont été définies à partir d'informations concernant les cultures et sols les plus fréquemment rencontrés. La deuxième étape a été l'utilisation de modèles de cultures pour extrapoler les résultats des situations types à une échelle régionale. Pour cela, une première série d'expérimentations a été réalisée pour caler les paramètres des modèles. Une validation in situ des modèles a été faite, basée sur des données expérimentales indépendantes. A partir de ces modèles, l'évaluation des risques et l'identification des zones sensibles sera menée pour les itinéraires techniques existants. Une analyse sur une longue série climatique a été utilisée. L'objectif était d'élaborer des itinéraires techniques "propres" adaptés aux particularités des sites.
Les résultats sont une estimation des niveaux de risque et la définition de recommandations visant à réduire les pertes d'azote vers les eaux souterraines ou de surface.
Abstract / Résumé ph. D. thesis - B. Leviel INRA-INPT - March 2000
Table of contents
ABSTRACT... 1 RÉSUMÉ... 1 TABLE OF CONTENTS... 2 INTRODUCTION... 6 1. BACKGROUND... 71.1. SUSTAINABLE MANAGEMENT AND QUALITY OF WATER... 7
1.1.1. Implications for society ... 7
1.1.2. Implications for the economy ... 7
1.1.3. Implications for Europe ... 8
1.2. BLUE DANUBE AND BLACK SEA... 8
1.3. RECENT STUDIES ABOUT THE BLACK SEA POLLUTION... 9
1.4. EASTERN EUROPE: ECONOMY AND SITUATION OF RESEARCH AND DEVELOPMENT... 11
1.5. ROMANIA... 12
1.6. BULGARIA... 12
2. OBJECTIVES OF THE STUDY ... 13
2.1. DEFINITION OF STUDIES... 13
2.1.1. Regions and soils... 13
2.1.2. Crops and models... 13
2.2. SIMULATIONS OF DIFFERENT CLIMATES AND TECHNIQUES... 14
2.3. RISKS ANALYSIS AND RECOMMENDATIONS... 15
2.4. TRANSFER OF TECHNOLOGY TO LOCAL SEARCHERS... 15
2.4.1. Exchanges ... 15 2.4.2. Formation... 15 2.4.3. Equipment ... 18 3. DESIGN... 19 3.1. EXPERIMENTAL SITES... 19 3.1.1. Choice of crops ... 19
3.1.2. Typology of regions next to the Danube River ... 20
3.1.3. Definition of typical situations ... 20
3.2. MODELS... 21
3.2.1. Choice of models ... 21
3.2.2. Improvement of models ... 22
3.2.3. Models calibration ... 23
3.3. SIMULATIONS... 23
3.3.1. Weather data sets and scenarios ... 23
3.3.2. Analysis of risks linked to climate and/or techniques... 24
3.3.3. Recommendations... 24
4. CERES-BEET DEVELOPMENT AND BIBLIOGRAPHY... 25
4.1. BIBLIOGRAPHY... 25 4.1.1. Sowing ... 25 4.1.2. Emergence... 25 4.1.3. Heterogeneousness... 26 4.1.4. Early growth... 26 4.1.5. Base temperature... 27 4.1.6. Leaves development... 28
4.1.7. Dry matter accumulation ... 29
4.1.8. Root development ... 31
4.2. LAI... 32
4.2.1. Materials and methods ... 32
4.2.2. Results ... 36
4.2.3. Discussion ... 41
Abstract / Résumé ph. D. thesis - B. Leviel
INRA-INPT - March 2000
4.3. CERES-BEET... 47
4.3.1. Construction ... 47
4.3.2. Calibration and validation ... 47
4.3.3. Perspectives... 50 5. MODELS UPDATE ... 51 5.1. PHYSICAL BASES... 51 5.1.1. Soil water ... 52 5.1.2. Soil nitrogen ... 53 5.1.3. Crop ... 54 5.2. PROGRAM STRUCTURE... 55 5.2.1. Inputs... 55 5.2.2. Outputs ... 56
5.2.3. Global flow diagram ... 57
5.3. UTILISATION... 58
5.3.1. Parameterisation ... 58
5.3.2. Global interfacing with Excel... 62
5.3.3. Input parameters management... 64
5.3.4. Outputs visualisation... 65
5.3.5. Simulation of crops rotations ... 68
5.4. MODIFICATIONS WITHIN THE PROJECT AND LIMITS... 69
5.4.1. Bare soil functioning ... 69
5.4.2. Input/output files ... 70
5.4.3. Management of different crop models ... 71
5.4.4. Limits... 71
5.5. CONCLUSION... 72
6. CALIBRATION OF EXPERIMENTAL CONDITIONS ... 73
6.1. BOJURISHTE (WHEAT) ... 73
6.1.1. Experiment description ... 73
6.1.2. Measurements ... 73
6.1.3. Treatments and replicates ... 73
6.1.4. Results synthesis... 73
6.1.5. CERES model calibration ... 74
6.1.6. Model validation ... 77
6.1.7. Utilisation for one crop and bare soil ... 79
6.2. CHELOPECHENE (MAIZE)... 80
6.2.1. Experiment description ... 80
6.2.2. Measurements ... 81
6.2.3. Treatments and replicates ... 81
6.2.4. Results synthesis... 81
6.2.5. CERES model calibration ... 83
6.2.6. Model validation ... 87
6.2.7. Utilisation for one crop and bare soil ... 89
6.3. FUNDULEA (WHEAT) ... 91
6.3.1. Experiment description ... 91
6.3.2. Measurements ... 92
6.3.3. Treatments and replicates ... 92
6.3.4. Results synthesis... 92
6.3.5. CERES model calibration ... 93
6.3.6. Model validation ... 95
6.3.7. Utilisation for one crop and bare soil ... 96
6.4. FUNDULEA (MAIZE)... 98
6.4.1. Treatments and replicates ... 98
6.4.2. Results synthesis... 98
6.4.3. CERES model calibration ... 99
6.4.4. Model validation ... 100
Abstract / Résumé ph. D. thesis - B. Leviel
INRA-INPT - March 2000
6.5. BUCHAREST (SUGAR BEETS)... 105
6.5.1. Experiment description ... 105
6.5.2. Measurements ... 105
6.5.3. Treatments and replicates ... 105
6.5.4. Results synthesis... 105
6.5.5. CERES model calibration ... 107
6.5.6. Model validation ... 108
6.5.7. Utilisation for one crop and bare soil ... 109
6.6. DATA BASE... 111
6.6.1. Description ... 111
6.6.2. Perspectives... 112
7. RESULTS OF AGRICULTURAL SYSTEMS' TYPOLOGY ... 114
7.1. PRINCIPLE AND OBJECTIVES... 114
7.2. SITUATION IN ROMANIA... 114
7.2.1. Zones studied... 114
7.2.2. Soils description ... 115
7.2.3. Meteorological data ... 119
7.2.4. Farming systems and practices ... 120
7.3. SITUATION IN BULGARIA... 125
7.3.1. Zones studied... 125
7.3.2. Soils description ... 125
7.3.3. Meteorological data ... 127
7.3.4. Farming systems and practices ... 129
7.4. OTHER USEFUL DATA... 132
8. MODELS UTILISATION ... 133
8.1. PRINCIPLE AND OBJECTIVES... 133
8.2. METHOD... 134
8.3. ROMANIA... 134
8.3.1. Translation into scenario ... 134
8.3.2. Risk analysis... 136
8.3.3. Conclusion... 154
8.4. BULGARIA... 154
8.4.1. Translation into scenario ... 154
8.4.2. Risks analysis ... 155
8.4.3. Conclusion... 160
8.5. SOFTWARE IMPROVEMENT TO PERFORM RISK ANALYSIS... 160
9. LIMITS, RECOMMENDATIONS AND PERSPECTIVES ... 162
9.1. RECOMMENDATIONS TO RESEARCH... 162
9.1.1. Increasing the quantity of data... 162
9.1.2. Improving the quality of data ... 162
9.1.3. Integrating the existing specialities knowledge and know-how... 163
9.1.4. Improvement of models ... 163
9.2. RECOMMENDATIONS TO AGRICULTURE... 163
9.2.1. Risks through leaching ... 164
9.2.2. Risks through surfaces flows ... 164
9.2.3. Recommendations... 164 9.3. PERSPECTIVES... 166 CONCLUSION... 167 REFERENCES... 169 INDEX OF FIGURES... 167 INDEX OF TABLES... 179 INDEX OF APPENDICES... 180
ph. D. thesis - B. Leviel
INRA-INPT - March 2000
I thank all my colleagues in INRA for their co-operation, help or assistance, and particularly Dr. Raymond Bonhomme, ex-director of the ex-Bioclimatology station of Grignon.
I especially thank Dr. Ghislain Gosse for his confidence for several years concerning this thesis and the other interesting projects in which he involved me, and Mrs Françoise Flament who solved every administrative problem with an incomparable efficiency.
I have a special thought to the persons involved in the project that supported my work: COPERNICUS project (Project IC15CT96-0101) partners:
Dr. Ghislain Gosse (Co-ordinator) Françoise Flament
Dr. Benoît Gabrielle Dr. Romain Roche
Institut National de la Recherche Agronomique
Unité Environnement et Grandes Cultures - Thiverval-Grignon (France) Prof. André Falisse
Xavier Cocu
Faculté des Sciences Agronomiques de Gembloux (Belgique) Prof. Lucian Ghinea
Dr. Catalin Lazar
Research Institute for Cereals and Industrial Crops Fundulea (Romania) Assoc. Prof. Dr. Zornitsa Popova
Scientific researcher Dr. Totka Mitova Scientific researcher Milena Kersheva
Prof. Dr. Ivan Varlev
N. Poushkarov Soil Science Institute of Sofia (Bulgaria) Dr. Cecilia Crivineanu
Dr. Marin Dumbrava
Université des Sciences Agronomique et de Médecine Vétérinaire de Bucarest (Roumanie)
Fortunately, work is not everything in life. I salute all my sport-addicted friends, mainly runners but also bikers and so on. Together, we had many painful experiences, always with the same satisfaction, for all of us, after the race ! See you soon Jean-Baptiste, Olivier, Christian, Pierre, Vincent, François-Xavier, Virginie, Nicolas, Sophie.
To my wife, A mon épouse.
Introduction ph. D. thesis - B. Leviel
INRA-INPT - March 2000
Introduction
The European Community countries' ecological experience has emphasised the necessity of anticipating all environmental problems, notably regarding non-point source pollution from agriculture in large-scale farming industry. The nitrogen fluxes linked to agricultural productions, and their impact on drinking water quality, necessitate action in such zones as the Bulgarian and Romanian plains, which constitute the Danube's terminal watershed, with the Black Sea as outlet.
Firstly, the study of "typical" situations, that is to say the most common crops and soils, allows an estimation of the risk level and a definition of the means to reduce nitrogen percolation downwards into deep ground water and/or rivers.
Modelling of the Soil-Plant System can be used as a second step to extrapolate "typical" situations to regional situations. To that end, a first series of experiments was performed to calibrate the model parameters. The in situ model validation was performed with independent series of experiments.
From these models, both a risk evaluation and an identification of sensitive zones was done in relation to the current agricultural practices. A frequential analysis based on long-term climatic records was used. It aimed at developing sustainable agricultural techniques suited to the site-specific characteristics.
Chapter I - Background ph. D. thesis - B. Leviel
INRA-INPT - March 2000
1. Background
For a few years, and with the recent events in western Europe (pollution of water and air, global warming and its effects on climate), environment has become a major preoccupation for people and political deciders. If local point-source emissions, mainly from industry, might be more easily regulated, non-point-source emissions, especially from agriculture, will certainly remain hard to measure and to restrain. Scientists have pointed out this problem for long, and tools are available to deal with non-point-source emissions. The difficulty consists in the variability induced simultaneously by the climate, the type of soil, and the crop cultivated. Direct measurements can be performed, but they are time-consuming and expensive, and correspond, after one season or one year of measurements, to one combination climate/soil/crop, and therefore these measurements cannot be extrapolated, neither to another place, nor to another crop, nor to another year. The solution proposed by searchers in environment and agriculture is the use of mechanistic crop models. They describe the soil-plant-atmosphere interactions for physical transfers in soil and crop development, in function of the climate. So, if such interactions are well simulated, results can be extrapolated to any combination of soil and crop, and submitted to various climates to determine risks of pollution. From these risk analyses, recommendation can be done to farmers or regional deciders for agriculture, in order to reduce environmental risks linked to crop production. Such a scenario is natural in western Europe. Unfortunately, the situation is different in eastern Europe. Indeed the means required for modelling techniques limit the use of this tool in countries like Romania and Bulgaria, two countries with important agricultural productions along the Danube river with the Black Sea as outlet. It is mainly an economic problem, that should disappear with time, but there is also a lack in Research and Development in this domain. EU sustains the co-operation of western and eastern countries to fill in the gap in research of the latter.
1.1.
Sustainable management and quality of water
1.1.1. Implications for societyA vital natural resource, water continues to be wasted and treated with little respect - despite its economic importance. Since 1970, the quantity of water available per human being has dropped by 40% and two out of five people living on the planet have water supply problems. This imbalance between needs and availability is leading to over-exploitation, the depletion of reserves and consequently to tensions between competing users, or even countries.
It is not only the southern countries of the world which are under threat. 60% of Europe's cultivated land contains fertiliser and pesticide levels which are dangerous to the quality of groundwater. The combined effect of peak water demand due to tourism and irrigation is also producing a worrying depletion of water reserves in some southern Member States.
1.1.2. Implications for the economy
In Europe, domestic water consumption represents just one fifth of total consumption; 54% is consumed by industry and 26% by agriculture. The cost of supplying the EU with water almost doubled between 1990 and 1995 (from 12 to 20 billion euros) and is expected to reach 30 billion euros in the year 2000. The global water market - in which Europe possesses leading know-how, particularly in building and managing water treatment plants - is expected to reach 124 billion euros in 2010.
Chapter I - Background ph. D. thesis - B. Leviel
INRA-INPT - March 2000 1.1.3. Implications for Europe
Twenty European countries depend on the rivers of neighbouring Member States for more than 10% of their water supplies - and for as much as 75% in the case of the Netherlands and Luxembourg. This is why EU Member States have adopted a common water policy, implemented through directives designed to protect this shared resource. The "Urban waste water" directive, for example, requires all agglomerations of between 10000 and 15000 inhabitants to be served by an adequate water collection and treatment system by the year 2005.
1.2.
Blue Danube and Black Sea
Connecting eight countries from the Black Forest to the Black Sea, the Danube is Europe's second longest river (Figure 1). The Danube River Basin covers 817 000 km² in 17 countries in the heart of Central Europe. The cumulative inflow of nutrients to the Danube River system is causing eutrophication problems in the river itself and pollution of its groundwater, as well as adding to the degradation of the unique Danube delta and the north-west shelf region of the Black Sea.
Figure 1: The Danube River through Europe
For some (maybe most) of the countries crossed by the river, it is crucial for local or national economy, as sadly shown by the example of chemical pollution in Feb. 2000 (tons of cyanur from North Romania in Tisza river destroyed about 80% of the river's ecosystem and contamined Danube).
Several programmes were engaged to protect Danube's ecosystem and reduce the pollution load. This study was supported by the European Commission within a COPERNICUS project. There are other projects aiming at protecting the river and its environment, as the Environmental Programme for Danube River Basin (EPDRB). Within this program, a prototype Danube Information System (DANIS) was developed for some textual information. Furthermore the Danube River Information Network (DBIN) for the management of water quality was initiated by NATO. The development of these and other environmental information and communication activities were in support of the Environmental Programme for the Danube River Basin (EPDRB), Danube River Protection Convention, and Strategic Action Program (Danube Strategic Action Plan 1995).
These projects aim at taking a further important step for implementation of the Danube River Basin Information System on an international scale, to meet the needs of the International
Chapter I - Background ph. D. thesis - B. Leviel
INRA-INPT - March 2000
Commission for the Protection of the Danube River and to allow for the participation of the interest groups in environmental protection in the Danube region.
The Bulgarian and Romanian plains constitute the Danube River's watershed, with the Black Sea as outlet (Figure 2). The river is the physical border between the two countries along the south border of Romania.
Figure 2: The Danube River from Budapest to Constanta
1.3.
Recent studies about the Black Sea pollution
The Black Sea is the biggest inland sea in the world. It is linked in the north to the Sea of Azov and in the south to the Sea of Marmara and the Mediterranean via the Bosphorus, which is both very narrow (1.6 km on average) and shallow (36 m). It is thus a virtually enclosed sea, as deep as 2,000 m in places and with an average depth of 1,240 m. Several of Europe's major rivers flow into the Black Sea, including the Danube, the Don, the Dnieper and the Dniestr. The Black Sea basin includes the greater part of 17 countries, six of which border directly on it. The population of this region is some 160 million. Although its ecosystem is fragile, being vulnerable due to factors such as its shallowness in places, the Black sea had no major problems until the 1970s; on the contrary it enjoyed remarkable biodiversity. Overfishing, man-made pollution, eutrophication and intense shipping traffic are some of the causes of damage to the environment, which has now reached alarming proportions.
The Black Sea has always had an extremely rich ecosystem. The great rivers already mentioned have always discharged nutrients which have been considered a special contribution to the quality of the ecosystem. These nutrients have been the source of substantial production of phytoplankton, the first element of the marine food chain. Precipitating phytoplankton give rise to substantial bacterial activity on the seabed, consuming all available oxygen and leading to the complete disappearance of all life forms below a depth of 180 m. This has always been a feature of the Black Sea which, apart from being the most "anoxic" in the world, has always had a mid-surface area of great richness and diversity.
Unfortunately, for nearly 30 years, the Black Sea environment has been suffering unprecedented damage due to the conjunction of various phenomena. Pollution by large rivers plays an important part in the Black Sea's deterioration. Firstly, owing to over-fertilisation of farmland in their catchment basins, they discharge much too large amounts of nutrients such as nitrogen and phosphorus, causing excessive proliferation of phytoplankton. In moderate amounts, such phytoplankton has been considered beneficial to marine ecosystems, but too much has caused the system to "seize up" and had a devastating, suffocating effect.
A typical example is the Danube which in 1990 alone deposited 40 000 tonnes of phosphorus and 50 000 t of nitrogen into the Black Sea, 10 times more than in 1960. In this respect, the example of the Danube is eloquent. Knowing that the Danube is responsible for 80% of pollution in the Black Sea and that various schemes are under way in the Danube Basin, we
Chapter I - Background ph. D. thesis - B. Leviel
INRA-INPT - March 2000
can see that any co-operation concerning the Black Sea and the Danube must be co-ordinated in order to achieve synergy.
In addition, the proceedings of the first Interparliamentary Conference on the Environmental Protection of the Black Sea (Istanbul, 10-12 July 1996), jointly organised by the Parliamentary Assembly of the Council of Europe and the Parliamentary Assembly for Black Sea Economic Co-operation (PABSEC), showed that the pollution generated upstream along the rivers which flow into the Black Sea affect — to some extent, at least — the Mediterranean basin (cf. Sustainable development in the Mediterranean and Black Sea basins, Appendix H1 or http://www.seafront.org/archive/recoder-report7977.htm).
Among the various basins of the World Ocean, the environmental degradation in the Black Sea is the most severe. In a recent study by the Intergovernmental Oceanographic Commission (IOC) examining the health of twelve marine areas (Caribbean, North Sea, West African coast, Baltic Sea, Northern FSU, Mediterranean, Red Sea, the Gulf, Asian Seas, Black Sea, Oligotrophic Gyre and the Great Lakes) with respect to various contaminants, the Black Sea received the poorest marks. The most predominant anthropogenic impact is the severe eutrophication experienced in the surface layers. Regarding marine pollution, the Black Sea thus deserves increased vigilance and effective environmental management. The environmental crisis in the Black Sea resulting from anthropogenic forcing, and accompanied by natural variability and climatic changes, is manifested by dramatic changes in its ecosystem and resources. The fishery yields have declined dramatically with 80% reduction in total catch in the last few years, and only six out of the 26 species of commercially valuable fish of the 1960's remaining in exploitable quantities. Heavy metals, pesticides, and hydrocarbons mostly originating from terrestrial inputs (notably from the Danube in alarmingly high amounts: 60 000 t of phosphorus, 340 000 t of inorganic nitrogen, 1 000 t of chromium, 900 t of copper, 60 t of mercury, 4 500 t of lead, 50 000 t of oil) have lead to chemical and microbial pollution, affecting public health and tourism industry (annual losses: 400 M$, cf. The nato committee on the challenges of modern society, Appendix H2 or
http://www.nato.int/ccms/p00/tor.htm ).
The Black Sea Environmental Series Vol. 10: “The Black Sea Pollution Assessment” gives alarming information on pollution in the sea. It confirms that one of the most significant processes degrading the sea is due to the increased concentration of nitrogen and phosphorus compounds, as a result of agricultural, domestic and industrial sources. The dramatic growth of human population in coastal areas, the “Green Revolution” and the increase of agricultural production through fertilisation and intensive live stock farms since the 1960s, the conversion of forests and wetlands into fields and urban areas and the release of nitrogen oxides in the atmosphere, all contribute to the problem. Eutrophication (a phenomenon caused by over-fertilisation) has developed the problem of low oxygen that in its turn has changed the structure of the Black Sea ecosystem that lead to decrease of biodiversity and reduction in the animal populations. The nitrogen and phosphorus compounds enter the Black Sea from the 17 countries in its drainage basin, mainly through rivers (the three largest rivers are the Danube, Dniepr and Dniestr). The estimations show that about 30 % of the total amount of nutrients originate from the other 11 non-coastal countries and the remaining 70 % - from the six riparian countries. The largest inputs of nutrients originate from Romania; the second from Ukraine, the next in this order are Bulgaria, Russia, Turkey and Georgia (cf. The Black Sea “Eutrophication Syndrome”, Appendix H3 or http://www.bseanetwork.org/Issue2_2.html ). Moreover, the Black Sea is under several stresses: waste from 17 countries drains into the waters of the Black Sea, almost two thirds of the nitrogen and phosphorus in the seawater
Chapter I - Background ph. D. thesis - B. Leviel
INRA-INPT - March 2000
comes in from the Danube basin, over 10 million people are connected to sewage systems in the Black Sea Coastal region, and 111 000 tons of oil enters the Black Sea each year from transport of oil through the Danube (cf. Better days for the Black Sea, Appendix H4 or
http://europa.eu.int/comm/research/rtdinfsup/en/sea4.htm ).
To finish with a more optimistic study, if by the early 1990s the Black Sea was in the grip of an extreme environmental crisis due to nitrogen, phosphorus and pesticides, added to agricultural land, and found in the sea at extremely high concentrations, causing massive blooms of micro-organisms, monitoring data show that during the last years the content of biogenous substances in water has stabilised at a certain point which is far below the permissible levels for ammonia nitrogen, nitrates, nitrites and phosphates. This is closely related to a considerably reduced application of mineral fertilisers and pesticides to the arable land, which has brought about a reduction of the biogenous and polluting matters washing out from the catchment basins of the major rivers. The main polluting components of the sea environment are petroleum products (cf. Regional and global ecological problems, Appendix H5).
1.4.
Eastern Europe: Economy and situation of Research and
Development
As most of its countries transform to market economies, the Europe and Central Asia region’s environment has improved. Pollution is declining, and air, water and soil quality is improving. Lead and heavy metal dust levels have decreased in response to lower outputs and new emissions control measures. Particulate and sulfur dioxide emissions from large stationary sources have decreased through industrial decline and price adjustments in the power and metallurgy sectors. Nitrates, heavy metals and toxic chemicals in drinking water have been reduced, and waste water collection and treatment has improved in areas like the Baltic and Black Sea.
But environmental progress has been mixed. In many areas, air quality improvements appear to be less than proportional to the fall of total emissions. Even though particulate emissions from large sources have decreased substantially in some areas, increased emissions from smaller sources like cars, small boilers, households and new commercial establishments have meant that average exposure has remained almost unchanged. Bacteriological contamination risk remains high in drinking water, and may even increase in places with deteriorating water utility operation and maintenance.
Countries in the region with advanced market reforms are more likely than less reformed economies to keep pollution down as they increase their GDP and industrial production. Phasing out subsidies and eliminating market distortions provide a better foundation for efficient natural resource use and sustainable environmental improvements. But even countries successfully transforming to market economies need to complement their reform measures with effective environmental policies and institutional frameworks. Proper environmental management systems need to be developed with clear sets of environmental priorities, established within the financial constraints of the transition process. Since the region’s countries are embarking on transition strategies which vary in objectives, speed of transformation, and emerging partnerships, they need access to a variety of instruments and institutional and investment support. The region’s most important new challenge is to combine economic growth and recovery with environmentally sustainable improvements.
Chapter I - Background ph. D. thesis - B. Leviel
INRA-INPT - March 2000
The regional economic picture is changing rapidly. Some countries in Central and Eastern Europe are facing the immediate challenge of European Union accession; others are undertaking major structural changes and building new trade and economic zones. EU and the World Bank must respond appropriately to each of these differentiated needs. For the accession countries, EU and the World Bank can be instrumental in proposing least-cost strategies for meeting European Union's environmental requirements and financing parts of the public investment programs. For the majority of the countries outside of the immediate EU expansion, EU and the World Bank can mobilize support for economic recovery and environmental management improvements.
In this project, financial support from EU was used to provide up to date measurements devices for environmental questions and acute formation in crop modelling for risk assessment of agricultural practices in the Dabube River's watershed.
1.5. Romania
Romanian plain is surrounded by Danube in the South and by the Southern part of the Carpathian Mountains in the North. Considering counties closed to Danube covers most of the agricultural area of Romania.
The country started a large land privatisation program some years ago. It resulted in an excessive land fragmentation. Statistical data about repartition of cultivated area and major crops exists for each county. In addition the Romanian partners of University of Bucharest conducted a large survey (127 farms managing 88500 ha) to establish a typology of the farms. Major crops and husbandry can be identified for public and private sector. The combination of these data with a typology of different types of farms is essential to obtain an overview of farming systems in Romania. The main productions are maize, wheat, rye and sunflower.
1.6. Bulgaria
Bulgarian plain is surrounded by Danube in the North and by Balkan mountains in the South. The Danube watershed in Bulgaria spreads on 4 640 000 ha. We worked with two climate stations and soil types (Pleven and Ruse) to characterise the Bulgarian Danube plain.
In 1991 Bulgaria broke up old agricultural collectivist structures and started to return lands to private sector. Farms coming from this context are mainly small and agricultural practices often extremely basic. Bulgarian agricultural area was in 1998 distributed between 3 types of exploitations: private associations and co-operatives, public farms managed by State and small individual exploitations. Wheat, barley, maize and sunflower are currently the major crops (55 % of arable lands).
Chapter II - Objectives ph. D. thesis - B. Leviel
INRA-INPT - March 2000
2.
Objectives of the study
The final objectives of this work were, on one side, to perform an analysis of risks linked to climate and/or techniques in selected regions of the Danube watershed, in order to deduce recommendations based on simulations with long data sets and different scenarios, and on the other side to develop a complete procedure and the tools to be able to realise the same study at any other place.
It required a typology of agricultural practices in the regions near to the Danube River, to define typical situations. Once soils and crops were chosen, the models calibration could be envisaged, in collaboration with local searchers. It was important to make sure they could complete the same work in other situations without our assistance.
2.1.
Definition of studies
2.1.1. Regions and soils
A limitation in the selection of soils was the necessity to locate the experimental sites nearby the research institutes associated to the project. With our three partners (2 in Romania and 1 in Bulgaria), representative soils near to the research institutes were found.
2.1.1.1. Bulgaria
The experimental station of Bojurishte was chosen as geographical site of the wheat field trials in Bulgaria. This site presents an impermeable soil profile that is contrasting to the moderately permeable soil profile of the other experimental site in Chelopechene. Impermeable soils are spread over 399 000 ha that is 8.6% of the area of the Bulgarian part of the Danube River watershed or 17.4% of the agricultural land there (Koynov et al., 1968; Koynov et al., 1980; Penkov et al., 1992; Giurov & Toshev, 1990).
2.1.1.2. Romania
In Romania, the cambic chernozem of Fundulea (near Bucharest) is widespread on about 27% of the surface taken into account in the present study. The reddish-brown forest soil of Bucharest represents about 9% of the arable land considered.
2.1.2. Crops and models
The study aimed at representing as large areas as possible in the regions considered. Therefore main crops were chosen for simulations: maize, wheat, and sugar beet.
2.1.2.1. Maize
Maize is the most widespread crop in Romania. The area cultivated with this crop in the Romanian Danube Plain is about 1 372 000 hectares (49% surface taken into account in this study). 88% of the land covered with this crop is private property. The irrigation is applied especially to the crops belonging to public (state) sector.
Maize is sown over 6-11.2% of the rural territory of Bulgaria. Percentages of area sown with maize are higher for the Danube River watershed: up to 19.2%.
2.1.2.2. Wheat
The area cultivated with wheat in the Romanian Danubian plain is about 676 000 hectares (24% surface taken into account in this study). 66% of the land covered with this crop is private property. The irrigation is applied especially to the crops belonging to public (state) sector.
Chapter II - Objectives ph. D. thesis - B. Leviel
INRA-INPT - March 2000
Wheat is sown over 23-27 % of the rural territory of Bulgaria. It is more specific for the Danube River watershed: up to 34.5%.
2.1.2.3. Sugar beet
Sugar beet is one of the most important technical crops in Romania. The area cropped with sugar beet has decreased every year since 1989, because of modifications in Agricultural property structure and of the settling of market economy, to reach in 1997 1.5% of the total arable surface in the country. In these conditions, the sugar production for 1998 in Romania is estimated to 220 000 tons. The greatest areas cultivated with sugar beet in Romania (39 %) are in the South of the country, including the Danube plain.
2.1.2.4. Rapeseed
In addition, rapeseed as an intermediate crop was eventually introduced. This was an occasion to promote a practice which is recognised as efficient in western Europe but not used neither in Romania nor in Bulgaria.
2.1.2.5. Models
Models for three out of the four crops with very similar structures were available at INRA Grignon, based on the North American model CERES (Jones & Kiniry, 1986). Initial CERES-Maize was modified at INRA Grignon (Gabrielle, 1996) to develop environmental aspects of the model, that was mainly oriented to yield prediction. The same modifications were applied to CERES-Wheat (Ritchie, 86). With the same physical bases, a new model was developed for rapeseed by Vardon (1993) and improved by Gabrielle (1996) and Roche (in prep.). Finally, for the purpose of this project a version for sugar beet was developed (Leviel & Crivineanu, 2000).
2.2.
Simulations of different climates and techniques
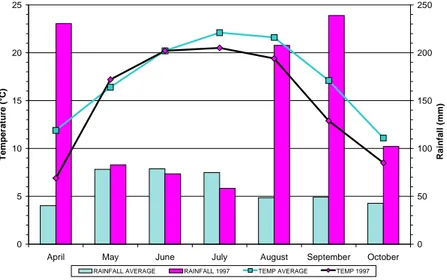
The objective was to use long meteo data sets from representative regions to perform the risk analyses. We could gather for each experimental site 30-year long data series including the minimal required measurements: extreme temperatures (Tmax and Tmin), rainfall (P) and global
solar radiation (Rg).
The models require initial conditions, especially for soil moisture and temperature. These data were measured for the field experiments, but obviously they were missing for the long weather data series. A common hypothesis consists in starting the simulation at the end of winter, with soil moisture set to field capacity and soil temperature set to an average over a long period. All simulations for risks analysis were computed this way.
Various crop rotations were envisaged, including or not an intermediate crop (rapeseed). At least two crop rotations cycles were computed to eliminate the impact of undetermined initial conditions.
The simulated technical itineraries were adapted from the local agricultural practices. Concerning the irrigation dates, they were adapted in relation to the weather data sets within the simulations, to avoid date-related irrigation that could occur simultaneously with rainfall and provoke accidental drainage/leaching. Concerning fertiliser types, they were chosen in function of local agriculture. In regions with husbandry, organic fertilisers were used in complement or instead of mineral fertilisers.
Chapter II - Objectives ph. D. thesis - B. Leviel
INRA-INPT - March 2000
2.3.
Risks analysis and recommendations
Two methods were used to compare the results of simulations, depending on the complexity of the simulation: either for one crop simulated one year with different practices, or for crop rotations over several years.
In the latter case, drainage and nitrate leaching were simply expressed as units per day, due to varying duration of the successive crops. Indeed water and nitrogen availability in the soil or air temperature may change significantly the development of cultivated crops.
With easier simulations (one crop over only one season), environmental impacts were expressed in function of cumulative probability of rainfall. The resulting simulations of drainage and nitrate leaching with increasing probability of rainfall were used to form recommendations according to the local practices, in collaboration with local searchers. The objective is now that these searchers use the results and the methodology to diffuse this information to agricultural and political deciders who could make it applicable at large scale in their respective countries.
2.4.
Transfer of technology to local searchers
Great efforts were done to fulfil this aspect of the projects. They consisted in three aspects that are scientific exchanges in research institutes in France and Belgium, specific formations in relation to the project and acquisition of recent material by the eastern partners.
2.4.1. Exchanges
Several periods of exchange allowed eastern partners to have long formations in the different aspects of the project. Short descriptions of these exchanges are listed below.
We insist on the fact that these exchanges represented about 66% of the project duration, that is to say between 550 and 600 days along the 30 months of the project (900 days). It implies a significant time investment mainly supported by INRA Grignon for:
• Modelling techniques.
• Nitrogen balance in wheat field ecosystem.
• CERES- Sugar beet.
• Analysis of the 97' data from sugar beet experiment.
• Maize data analysis and utilisation of CERES-Maize.
• Computing the data for the sugar beet model development and calibration.
• CERES calibration with lysimeter results.
• Experimental measurements and data treatment.
• Risk assessment in Bulgaria.
• Risk assessment in Romania.
• Sugar beet modelling, and risk assessment in Romania. 2.4.2. Formation
2.4.2.1. Crop models functioning
As soon as during the first meeting in Bucharest (December 1997), a detailed presentation of CERES models was proposed to all partners. In addition they were all given a copy of the documentation and could contact directly several authors in Grignon: B. Gabrielle, R. Roche and B. Leviel. See chapter 5 for detailed description of models.
Chapter II - Objectives ph. D. thesis - B. Leviel
INRA-INPT - March 2000
2.4.2.2. Experimental data treatment
To gather the experimental results in a form that could be understood and used easily by everyone inside or outside the project, similar files were used whatever the crop and location. INRA Grignon developed Excel templates to enter rough data.
In addition partners were initiated and incited to the use of macro-commands to avoid repetitive computing tasks. It saved a lot of time and reduced risks of errors.
Finally, templates and macro-commands made easier the conversion of all experimental data of the project in a data base (extract in Figure 3).
Meteo
previous year's r esidues Soil Moisture Pest pheno crop density LAI Fresh Matter Dry Matter N content Leaves
Grignon 1998 Mt pheno GrSB98de GrSB98LA GrSB98FM GrSB98DM GrSB98Nc Leaves
Bucharest 1996 Mt harvest pheno LAI BuSB96DM BuSB96Nc
1997 Mt BuSB97SM NO3 NH4 missing pheno BuSB97LA BuSB97FM BuSB97DM BuSB97Nc leaves
1998 Mt BuSB98SM NO3 NH4 missing pheno BuSB98LA BuSB98FM BuSB98DM BuSB98Nc leaves
Chelopechene 1997 or Bojurishte 1998
Fundulea 1997
1998 Gembloux
back to general index
cf, harvest N analyses Gr98Nt COPERNICUS Data Soil Sugar Beet Crop
Figure 3: Excel Data Base for sugar beet data
2.4.2.3. CERES Models utilisation
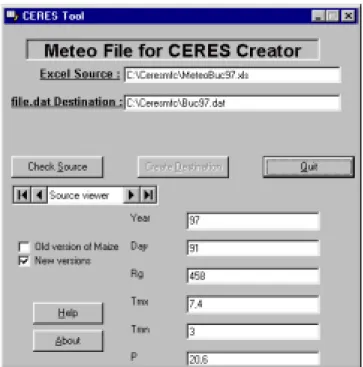
At the beginning of the project, CERES was a search tool not user-friendly. That was a huge loss of time to teach all requirements of the models. So we decided to develop specific tools. An interface (Figure 4) was created by INRA Grignon to manage all tasks linked to CERES utilisation (see chapter 5 for detailed description of modelling tools):
• Input files creation and edition (Visual Basic)
• Meteo files creation (Visual Basic)
• Simulation
• Outputs visualisation (Excel VBA)
• Comparison to experimental data (Excel VBA)
Chapter II - Objectives ph. D. thesis - B. Leviel
INRA-INPT - March 2000
Figure 4: Interface for the use of CERES models
2.4.2.4. Models calibration
Two kinds of situations were encountered:
• Physical parameters were known
Mainly for soil hydraulic properties, a laboratory description was often available, but did not correspond to the CERES model description (different empirical equations). A set of CERES parameters had to be deduced from the laboratory parameters, using Excel solver for instance.
• Development of specific tools
When no similar parameters were available, estimations of error with 1to1 graphs (Figure 5) were used. Such model outputs were obtained with specific macro-commands.
One To One Graph - Soil Water
y = 0,92x + 1,54 R2 = 0,91 0 10 20 30 40 50 60 0 10 20 30 40 50 60 Measured Si m u la te d
Chapter II - Objectives ph. D. thesis - B. Leviel
INRA-INPT - March 2000
2.4.2.5. Risk assessment
Final objective of the project, a special attention was paid to risk assessment of varying agricultural practices, and mainly to crop rotations. We had to be able to simulate easily every succession of the 3 crops studied, with bare soil or catch crop between them. The interface shown in Figure 6 manages successive simulations and takes the outputs of a simulation as the input conditions of the following simulation. Year by year yields and environmental impacts are stored.
Figure 6: Interface for simulation of crop rotations
2.4.3. Equipment
The project had an experimental part and a modelling part, both of them requiring specific equipment to ensure the same level of quality of the data and the same treatment of information. A part of the budgets were dedicated to update old material or to buy new devices. At the experimental level, Bulgaria needed TDR for permanent and non destructive soil moisture measurements, and Romania bought a High Performance Liquid Chromatograph (HPLC) to perform pesticide measurements. At the modelling level, computer equipments were upgraded in both eastern countries.
Chapter III - Design ph. D. thesis - B. Leviel
INRA-INPT - March 2000
3. Design
The thesis was a contribution of a large European project in the Copernicus program. The global project involved five European research institutes from France (INRA - co-ordinator), Belgium (Gembloux), Romania (Fundulea and Bucharest) and Bulgaria (Sofia).
The project described in Figure 7 consisted in three different but not independent steps. First step, field experiments had to be defined and monitored in relation to local and national characteristics. Meanwhile, the models used for simulations had to be improved and adapted to crop rotations (second step). With experimental results of the first year the calibration could be done, before validation with the results of the second season of field experiments. Finally, simulations could be performed and analysed for risk assessment on the basis of the third step’s results, the typology of the regions studied.
Thesis contribution
in the full Project
Models Developments Experiments Specific « Soil » Parameters’ determination Calibration Validation Typology Utilisation Frequential analysis One crop several years,
Crops successions and Recommandations Administrative areas 2 years Field Definition of representative itineraries Conclusions Perspectives Choice Description Coherence of models CERES Beet Interfaces to use the models crops
Figure 7: The global Copernicus project. The dark boxes represent the contributions of the thesis in the project. The light boxes are Belgian and eastern countries contributions.
The contribution of the thesis concerned especially the ‘models’ axis and all ‘data treatment’ and ‘simulations’ aspects as illustrated in Figure 7.
3.1. Experimental
sites
The locations of the experimental sites had to respond to two imperatives: to be near the research institutes and to be representative of the global situation in the country for soil types and crops.
3.1.1. Choice of crops
We wanted to focus on main arable crops of both countries, in order to have widely applicable recommendations. In addition, several models are available for this kind of crops.
Chapter III - Design ph. D. thesis - B. Leviel
INRA-INPT - March 2000
Consequently we considered maize and winter wheat in both countries, and in addition sugar beet in Romania. By now there is no cover crop used in these countries to reduce nitrogen losses by leaching during intercropping. We decided to add scenarios with rapeseed as cover crop to test its effectiveness in different situations.
3.1.2. Typology of regions next to the Danube River
An inventory of agricultural practices along the Danube river on both Romanian and Bulgarian sides was realised in co-operation with local institutes. The goal was to identify few characteristic zones that could be representative of a large proportion of the countries. The criteria were the soil, the climate, and the local agricultural management, especially concerning fertilisation and husbandry (presence of husbandry enhances the use of organic fertilisers -manure- and reduces the use of mineral fertilisers).
3.1.3. Definition of typical situations
As a result of previous steps, typical situations could be defined for field experiments and for modelling scenarios. In each country, two types of soil were selected for field experiments:
• in Romania, a reddish-brown forest soil in Bucharest and a cambic chernozem soil in Fundulea,
• in Bulgaria, a leached cinnamonic forest soil of loamy texture in Chelopechene and a leached chernozem-smolnitsa soil (vertisol) in Bojurishte
Winter wheat field experiments were monitored in Bojurishte (Bulgaria) and Fundulea (Romania). Maize field experiments were monitored in Chelopechene (Bulgaria) and Fundulea (Romania). Sugar beet field experiments were monitored in Bucharest. For all these field experiments, inorganic fertiliser was used.
A few scenarios were proposed to describe typical regions: main crop rotations and fertiliser type, with or without irrigation, and amount of organic fertiliser to incorporate in the soil according to husbandry. We'll present the results of four scenarios with different situations of soil and climate representing the simulations of 22 situations:
• Maize only :
! two soils ✕ two climates = 4 situations in Romania
• Wheat-Maize rotation:
! two soils ✕ two climates = 4 situations in Romania ! two soils ✕ four climates = 8 situations in Bulgaria
Chapter III - Design ph. D. thesis - B. Leviel
INRA-INPT - March 2000
• Wheat-Beet-Wheat-Maize rotation:
! two soils ✕ two climates = 4 situations in Romania
• Wheat-Rapeseed-Maize rotation:
! one soil ✕ two climates = 2 situations in Bulgaria
3.2. Models
3.2.1. Choice of models
Crop simulation is widely (wildly?) used in environment research, and many models are available (Apsim, Century, Ceres, CropSyst, Daisy, LeachM, Nleap, SoilN, Stics, Sucros, Sundial), with different characteristics:
• Mechanistic or empirical
• Complexity of crop module
• Weather data requirements
• Complexity of soil parameterisation
• Time step • …
Ea
sy
C
o
m
p
le
x
Flux estimation
Decision tool
Regionalisation
Socio-eco analysis
NLEAP
LEACHM
NLEAP
STICS
CERES
LEACHM
NLEAP
DAISY, SOILN
SUNDIAL
SUCROS
INDICATEURS
CENTURY
APSIM, CropSyst
Figure 8 : Overview of existing models (from Gabrielle, personal communication)
Figure 8 illustrates the main existing models in the public scientific community, and it is far from being exhaustive. Vertical axis represents the level of complexity of the processes modelled, horizontal axis lists the fields of application of the different models. Roughly these models can be grouped in three categories.
Chapter III - Design ph. D. thesis - B. Leviel
INRA-INPT - March 2000
3.2.1.1. First group of models
LeachM, SoilN (American), Daisy (Danish), Sucros (The Netherlands): at least one aspect of the modelling is very complex, C-N Dynamics or transfers for LeachM, SoilN, Daisy (with a rather poor plant component), or on contrary strong ‘plant’ components and rather light soil description for Sucros. The time step is generally inferior to the day.
3.2.1.2. Second group of models
Apsim (Australian), Cropsyst and CERES (American) and Stics (French): one module by process, with a search for an equilibrium between the complexity of different processes modelling. The time step is typically the day.
3.2.1.3. Third group of models
Sundial (English), or indicators. They are usually non-dynamic models that use statistics to chain crops, generally used for socio-economic studies or as decision tools.
We wanted a mechanistic model, with a good crop development module available for all crops considered in the project, and few weather data requirements.
CERES (Crop Environment REsource Synthesis) models are daily incrementing simulation models that can simulate the impact of various irrigation management scenarios, nitrogen uptake and nitrate leaching. They have a strong crop simulation component, and the weather input requirements are simple. The models have also been extensively tested with various crops on different soil types and for a range of climatic conditions. At the moment, the bottleneck is a rather complex parameterisation procedure, but projects are in progress to standardise and make easier this crucial step.
3.2.2. Improvement of models
On the basis of CERES models for Rapeseed, Maize and Wheat used at INRA Grignon, and modified by different authors along time, it was decided to make a common structure for all models, with a strictly equivalent soil functionment and similar crop submodels organisation. This task started with modifications of all inputs and outputs organisation (parameters, order, format). Then bare soil simulations were run to eliminate every difference between the codes, at first in soil temperatures, secondly in soil moisture and finally in soil nitrogen contents. The succession of controls corresponds to interactions in the models between temperature, moisture and C-N biotransformations. Indeed, nitrogen contents in soil depend directly on temperature, soil moisture and water transfers, therefore it was not possible to check coherence of biotransformations in the different models as long as soil temperatures and soil moisture were not themselves coherent.
Once this step achieved, we used an updated version of the model to adapt it to sugar beet. The crop module was developed with different data sets obtained with the same cultivar in Romania and in France. At the moment, crops available with these homogeneous bases are:
! Maize ! Wheat ! Rapeseed ! Sugar beet ! Sweet sorghum ! soon: barley
Chapter III - Design ph. D. thesis - B. Leviel
INRA-INPT - March 2000
As most research models with many parameters, input and output files and other specific characteristics, this family of models remained really not user-friendly. As the goal of the project was also to make of these models a valuable tool for sustainable agriculture, an effort had to be done to develop clear and easy user interfaces.
Experience of new users allowed to define the main difficulties they encountered. Specific softwares were programmed (and continue to be improved) to help non-specialist users to create and edit input parameter files, meteo files, run the models and visualise outputs.
3.2.3. Models calibration
In CERES, a few parameters control soil water transfers (between soil layers and with the crop), soil biotransformations and heat transfers. The stage of models calibration is therefore among the most important. Yield and environmental impacts predictions directly depend on it. Wrong parameters may, for instance, overestimate drainage and leaching, and consequently create a water stress that would reduce dry matter estimation. A result could be to advise irrigation where it is not necessary. On contrary, drainage and leaching may be underestimated, favouring crop development in the simulations: thus a bad scenario could be recommended.
Two stages of soil calibration are commonly used before validation.
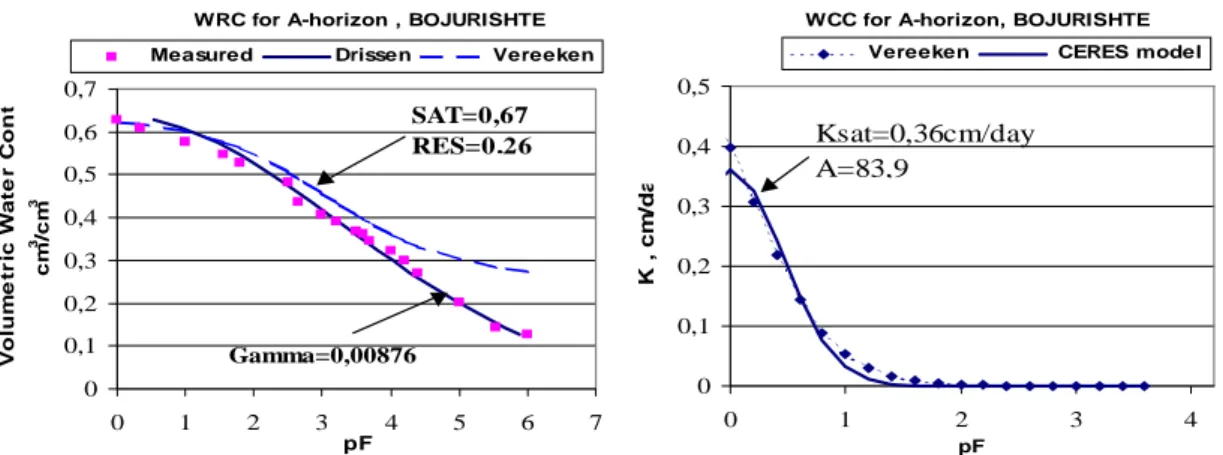
• From preliminary laboratory measurements, physical parameters are initialised. They include figures (hydraulic conductivity at saturation, thermal conductivity, denitrification rate) that are directly entered in the model's parameter file, and curves (retention curve, conductivity curve) used to define parameters sets describing a behaviour with a simplified representation. The retention curve is represented by 2 parameters (Driessen, 1986) and characterised by a wilting point (pF=4.2), a saturation (pF=0) and a field capacity also called drainage upper limit, for which pF vary with the type of soil. The conductivity curve is represented by 3 parameters (Davidson et al., 1969). Besides, according to the user's background, some terms might be ambiguous, as the field capacity, interpreted differently by agronomic or physic scientists. From our experience, the agronomic meaning roughly corresponds to the saturation for physic scientists.
• Comparison of simulations with this first set of parameters to field experiments data are used to adjust the parameters. Extensive data sets including soil temperatures, soil moisture, soil nitrogen and plant development data are used. Such data sets are the result of time consuming field experiments all along the growth season. 10 such data sets were realised in this project over two years (2 years ✕ 2 locations for winter wheat, 2 years ✕ 2 locations for maize and 2 years ✕ 1 location for sugar beet).
• Validation is performed with the data of the second year of experimentation.
3.3. Simulations
3.3.1. Weather data sets and scenarios
One partner of each participating country collected weather data records of selected zones representing the different kinds of climates encountered along the Danube's basin. The data series had to fulfil the following criteria:
Chapter III - Design ph. D. thesis - B. Leviel
INRA-INPT - March 2000
! Daily recording
! Several full years records (30-year series expected) ! Minimum and maximum temperatures
! Rainfall ! Solar radiation
! If available: soil evapotranspiration ! If available: cloudiness
If missing, the last two values are set to -1 in the weather data files, and estimated by the model during the simulation. A specific software developed within the project was used to prepare the data for simulations with CERES.
One partner of each participating country collected information about agricultural practices and characterised few situations representing his side of the Danube's watershed. These typical situations were used to define representative scenarios for both countries (see §8).
3.3.2. Analysis of risks linked to climate and/or techniques The yearly weather data files of each location were ordered by ascending total rainfall over the year, or over the growing season, to define probabilities of rainfall. In order to limit the number of simulations to run, different comparisons were then performed:
! For simulations of one crop over one season (and eventually the following bare soil period), five or seven weather scenarios were kept, corresponding to 0% (dry), 25% (moderately dry, eventually 2 years kept), 50% (average), 75% (moderately wet, eventually 2 years kept) and 100% (wet). These risk assessments are presented in §6-Calibration and were used to check the models' coherence.
! For rotations, only two weather scenarios were kept, corresponding to 25% (moderately dry year) and 75% (moderately wet year) probability of rainfall. Drainage and nitrate leaching were expressed in units/day in the successive periods of vegetation or bare soil. Results are presented in §8-Utilisation and in appendices.
! Lately, software interface was improved to run automatically models over series of weather data files and extract selected outputs to compare yield and environmental impacts (mainly drainage and nitrate leaching) more precisely. One application is presented in §8-Utilisation.
3.3.3. Recommendations
The recommendations deduced from simulations were expressed as basic rules for local deciders. It's now the objective of our partners in the respective countries to diffuse the results and persuade agricultural authorities that these recommendations should be respected to protect environment. Our aim was also that local searchers continue to use the tools we developed together, in order to process other similar studies, and this way complete the work we only initialised. Finally, a real progress (but still very improbable) would be a bilateral collaboration of these countries, without a so large contribution of western Europe, to protect their environment.
Chapter IV - CERES-Beet ph. D. thesis - B. Leviel
INRA-INPT - March 2000
4.
CERES-Beet development and bibliography
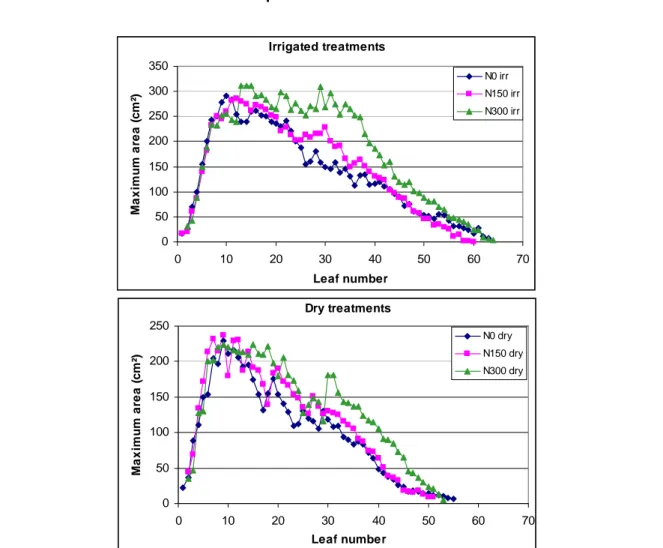
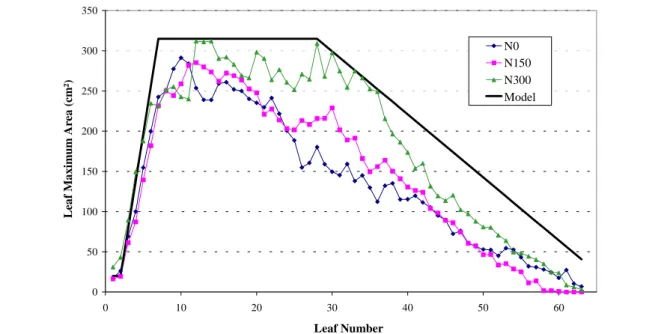
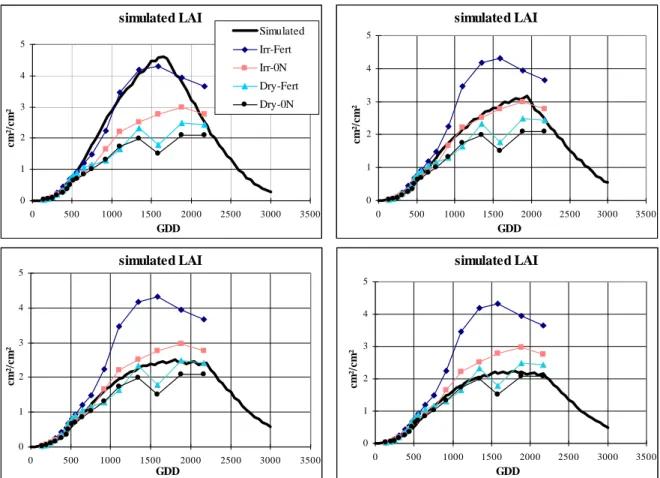
A lot of literature is dedicated to sugar beet, from all stages of development to modelling. The aim of CERES-Beet was to integrate as far as possible the scientific knowledge described in the existing literature in a model scheme imposed by the CERES' structure. The first step of CERES-Beet programming was therefore the Leaf Area Index modelling, which controls the crop development through the light interception in CERES models. The LAI sub-model was developed on the basis of other CERES models functioning, and with large and high-quality data sets monitored for the project in Bucharest and Grignon. Once the LAI sub-model validated, dry matter production/repartition and root development were calibrated to fit experimental data.
4.1. Bibliography
The stage of bibliography for sugar beet modelling aimed at getting an overview of the scientific knowledge concerning the crop at different steps of its development. This overview distinguished the following steps: sowing, emergence, early growth, leaves development, dry matter accumulation and root development. It raised also two crop-specific aspects: heterogeneousness and base temperature.
4.1.1. Sowing
Sugar beet growers must optimise sowing dates and densities, seedbed preparation and seed placement to ensure successful crop establishment (Durr & Boiffin, 1995).
Sugar yields are closely related to both sowing date and harvest date. Beet crops should be sown as early as possible in spring (Martin & Drewitt, 1984). However, the base temperature for germination is about 4°C; consequently, without genotype selection, low temperatures at the beginning of the cycle may provoke seed formation in the first year (Caneill et al., 1994). Seedbed preparation and seed placement can have a significant influence on the early growth of sugar beet through seedling size distribution, as well as through emergence rate and duration (Durr et al., 1992). Difficult conditions can induce a lack of plants, delayed emergence, and slow growth after emergence (Durr et al., 1992). Further stages in the study of the early growth of sugar beets would consist in analysing the response of seedling size and emergence delay to environmental factors controlled by tillage and drilling operations (Boiffin et al., 1992).
There is an early absorption of mineral elements. Numerous studies showed the negative effects on germination velocity of high contents in mineral elements near the seeds during germination (Durr, 1994).
Models have been proposed to predict the effects of environmental conditions on sugar beet germination rates (Gummerson 1986; Richard & Guérif 1988). Germination date is calculated from accumulated temperatures since sowing (Gummerson 1986; Richard & Guérif 1988).
4.1.2. Emergence
Sugar beet is especially subject to problems in emergence such as crusting (Fick et al., 1975). In the usual conditions of crop establishment, delays of 10 days or more (100-150 °Cdays) are commonly observed between early and late emergence in the same field (Duval & Boiffin, 1990). When averaged across all years, genotypes, and harvest dates, a delay in emergence of
Chapter IV - CERES-Beet ph. D. thesis - B. Leviel
INRA-INPT - March 2000
46 days decreased root yield 38% (from 52.2 to 32.3 t/ha), sugar content 4% (183 to 175 g/kg), and recoverable sucrose 42% (9.25 to 5.34 t/ha) (Lauer, 1997).
Elapsed time to reach the soil surface is calculated from germination date, distribution of aggregates along the way up to the surface, hypocotyl elongation function and soil temperature (Durr et al., 1995). After germination, the path to soil surface is estimated to calculate the hypocotyl's date of arrival to surface. Then, soil surface is evaluated (mainly its moisture) to determine the ability of hypocotyl to get through it (Durr et al., 1995). These authors proposed two tests at this stage:
• If more than 175°Cdays elapsed since sowing, the plant is considered as dead.
• Else, and if there is no crust at surface or a moist crust, plant emerges. If the crust is dry, time elapses until crust is rewet, as long as plant accumulated °Cdays remains inferior to the threshold established for its death.
The factors controlling the time to emergence in field conditions include sowing depth and seedbed structure. The hypocotyl elongation rates indicate that a distance of 2-2.5 cm, corresponding to a usual sowing depth, is covered in 65-75 °Cdays (base 3.5°C) from sowing, assuming no water deficiency and no mechanical obstacles. Emergence time observed under good field conditions are in agreement with such values (Duval & Boiffin, 1990; Durr et al., 1992). The seedling biomass at emergence depends mainly on the initial seed weight, which is consistent with other results on sugar beet (Scott et al., 1974) and other species (Black, 1956; Tamet et al., 1994).
Post-emergence growth is supposed exponential (Durr et al., 1994). 4.1.3. Heterogeneousness
A successful crop implies fast and homogeneous early growth (Durr et al., 1992). But underground growth may be disturbed by soil structure and aggregates (Caneill et al., 1994), and since sugar beet seedling size is very heterogeneous even within a given field, it induces a wide range of plant-to-plant variability at the end of the exponential growth period (Boiffin et
al., 1992).
The difficulty to obtain stable growth stages datation, and therefore to identify their causes, may be attributed to initial heterogeneousness (Caneill et al., 1994).
4.1.4. Early growth
The crop establishment period includes three different steps: first, germination, which conventionally ends when the radicule protrudes; second, preemergence growth; and third, growth after emergence (Durr & Boiffin, 1995).
Seedling development is generally slow until after four to six foliage leaves have been formed, which may be one month after planting even under favourable conditions (Fick et al., 1975). The pattern of growth is similar whatever the growing conditions. 3 successive phases were identified (Durr & Boiffin, 1995):
• The seedling dry weight and the dry weight of each organ increased (during 4 days after imbibition has started at 20°C)
• The weight of the seed residue did not change any further. The seedling dry weight increased slightly, but there were large changes in the weight of the organs.