THE DISTRIBUTION OF SOCIAL CONSUMPTION IN SOCIALIST COUNTRIES
by
XIAOMING ZHANG
B. Arch., Tsinghua University, Beijing (1983)
M. Urban Plan., Tsinghua University, Beijing (1986)
Submitted to the Department of Urban Studies and Planning in Partial Fulfillment of
the Requirements of the Degree of Master of City Planning
at the
Massachusetts Institute of Technology May 1989
c Xiaoming Zhang 1989. All rights reserved
The author hereby grants to MIT permission to reproduce and to distribute copies of this thesis document in whole or in part.
Signature of Author
Certified by
Accepted by
DepWrtment of Urban Studies and Planning May 18, 1989
eeIr
~
SA A Lance Taylor Professor of Economics Thesis Supervisor I0 V ** Donald Schon Director, MCP Committee 14 I- S T TEC 8.AUG
0
3 ??
THE DISTRIBUTION OF SOCIAL CONSUMPTION IN SOCIALIST COUNTRIES
by
XIAOMING ZHANG
Submitted to the Department of Urban Studies and Planning on May 18, 1989 in partial fulfillment of the
requirements for the Degree of Master of City Planning
ABSTRACT
In socialist countries, social consumption refers to the free goods and services such as public housing, education, health care, and transfer payments, which are distributed through administrative allocation mechanisms.
Social consumption is a very important part of income distribution in socialist countries. However, there are very few studies on the distributional mechanisms of social
consumption and their results. Most scholars assume that social consumption has a strong equalizing effect on the overall distribution of income in socialist countries.
In this thesis, the author examines the distribution of social consumption in detail by analyzing the distributional mechanisms of public housing, education, health care, pension,
and price subsidies, in the following three countries: China, Hungary, and the Soviet Union. The author compares the
distribution of social consumption with that of wages and salaries, to see which is more unequally distributed.
All evidence in this study shows that social consumption is not more equally distributed than wages; therefore, it does not carry out the assumed function of equalizing the overall
income distribution.
Thesis Supervisor: Lance Taylor
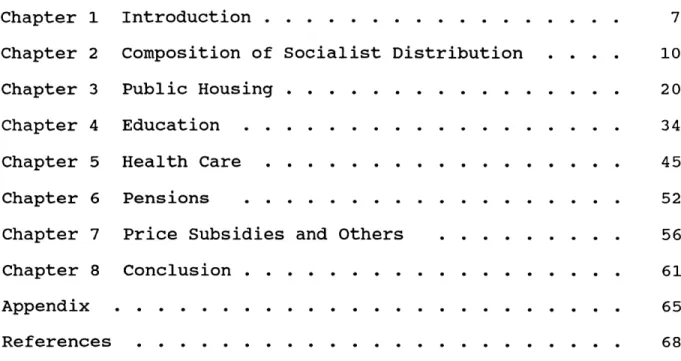
Table of Contents Acknowledgment Chapter 1 Chapter 2 Chapter 3 Chapter 4 Chapter 5 Chapter 6 Chapter 7 Chapter 8 Appendix Introduction . . . . . . . . . . . . . Composition of Socialist Distribution Public Housing . . . . . . . . . . . . Education . . . . . . . . . . . . . .
Health Care . . . . . . . . . . . . . Pensions . . . . . . . . .
Price Subsidies and Others
Conclusion .. . . . .. . ... References . . . . . . . . . . . . . . 3 7 10 20 34 45 52 56 61 65 68
List of Tables Table 2.1. Table 2.2 Table 2.3. Table 2.4. Table 2.5. Table 2.6. Table 3.1. Table 3.2. Table 3.3. Table 3.4. Table 4.1. Table 4.2. Table 4.3. Table 5.1.
National Income Distribution in Socialist Countries
p. 11
Composition of Consumption Fund in The USSR, 1970
p. 13
Composition of Consumption Fund in China, 1983
p. 14
Distribution of Income and Social Consumption per Household Member For Active Population, USSR 1983 p. 17
Distribution of Social Benefits In Kind In Selected Years, Hungary p. 18
Distribution of Urban Wages, Pensions, and
Subsidies by Households Per Capita Income Deciles, in Both Public and Collective Sector, China, 1986 p. 19
Urban Housing Standards, China, 1983 p. 25
Average Per Capita Housing Distribution by Social Groups, Beijing 1986. p. 26
Average Per Capita Housing Distribution by Social Groups, Shanghai 1982. p. 27
Redistribution Effects of Rent-subsidy According To Social Groups, Hungary, 1980. p. 31
USSR Social-occupational Characteristics of Eighth-graders', Tenth-graders', and College
Students' Parents. Six-region Survey, 1973 p. 37
Occupational Status of Soviet Students in Different Universities, Late 1960s p. 38
Occupational Status of Chinese Students in Colleges and Graduate Schools, 1977-87 p. 43 Distribution of Soviet Population Among
Table 6.1. Distribution of Retirement Pensions by Social Groups, Beijing, 1982 p. 54
Table 6.2. Influence of Prior Earnings on Pensions in the
USSR, Late-1970 p. 55
Table 7.1. Urban Household Expenditure on Commodities and Other Subsidized Items, China 1986 p. 59 Table 7.2. Social Position, Per Capita Income, and
Cultural Indexes, Hungary 1960s. p. 60
Acknowledgments
First, my gratitude goes to Dr. An Wang for his generous financial support, which made my study at MIT possible. I would like to thank Dr. Alan Strout, whose warm hearted
encouragement and valuable advice greatly helped me in
overcoming the difficulties that I encountered during the two years at MIT. Professor Lance Taylor has given me his trust
and encouragement. I would also like to thank Professor Karen Polenske for her careful editing of my thesis.
Chapter 1 Introduction
In socialist countries, social consumption refers to the free goods and services such as public housing, education, health care, and transfer payments, which are distributed through administrative allocation mechanisms.
For many years, scholars both inside and outside socialist countries have been engaged in numerous studies on the income distribution under socialist system. Most of these scholars, however, concentrate their studies on the distribution of wages and salaries1 (see Wiles, 1974; Morrison, 1984, Bergson, 1984, Flakierski, 1986). They believe that because there is no private ownership of means of production, and personal income from capital gain and rent should be absent in
socialist countries, at least in the public sector, therefore, wages are the main household income (Bergson, 1984;
Flakierski, 1986; Zhao, 1985). As Chilosi claims:
"inequalities in the structure of earnings are in principle the basic source of inequalities of personal incomes" in socialist countries (Chilosi, 1980, p. 3).
Based on such a common belief, those scholars tend to
1In the rest
of the thesis, we will use "wages" to refer to both wages and salaries.
ignore the impact of social consumption on the overall
socialist distribution. Up till now, very few scholars have paid attention to the mechanisms of social consumption
distribution and their results. Most of them assume that in socialist countries social consumption are more equally
distributed than wages. Some people even claim that it has an egalitarian tendency (McAuley, 1979; Chilosi, 1980; Bergson, 1984; Flakierski, 1985; Vinokur and Ofer, 1987).
In this thesis, the author challenge the above common belief. The author argues that social consumption is a very important part of socialist distribution, which deserves full attention of research. In socialist countries, social
consumption is not more equally distributed than wages. As we will see later, some items of social consumption are
distributed as unequally as the wage distribution, and some other items are distributed more unequally than wages.
The structure of the thesis is as follows. In the second chapter, we will discuss some common features of
distributional mechanisms in most socialist countries. Then we examine the composition of total consumption fund in
socialist countries to see the importance of social consumption in the overall socialist distribution. In
chapters 3-7, We discuss one by one the distributions of major items of social consumption: housing, education, health care, pension, and price subsidies. Our emphasis will be on
wages in socialist countries, and to see which one is more unequally distributed. In the final chapter, conclusions will be presented.
Chapter 2
Composition of Socialist Distribution
In most socialist countries, national income is divided into two parts: consumption and accumulation. Total
consumption usually consists of households' personal
consumption and social consumption. The personal consumption includes wages and other work-related earnings (bonus and work-related subsidies) from state-owned and collective work units. The social consumption includes social, cultural and welfare services (such as education, health care, free
housing, and cultural and entertaining facilities), government administration expenditure, and national defense. Transfer payments, such as pensions, social relief payments, and
stipends, are also included in the social consumption funds. (Chu, 1978).
Total accumulation fund is divided into production-related accumulation and consumption-related accumulation (Bor, 1974; Chu, 1978). The latter is capital investment on
non-productive sector, such as capital investment in
hospitals, schools, and public housing. Because in socialist countries, health care and education are free, and public housing are distributed free of charge, consumption-related accumulation is in fact an extra part of social consumption
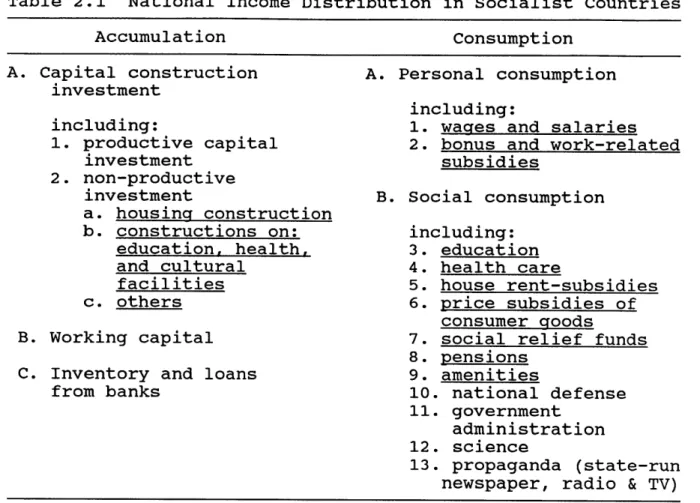
Table 2.1 National Income Distribution in Socialist Countries
Accumulation Consumption
A. Capital construction A. Personal consumption investment
including:
including: 1. wages and salaries
1. productive capital 2. bonus and work-related
investment subsidies
2. non-productive
investment B. Social consumption a. housing construction
b. constructions on: including: education, health, 3. education and cultural 4. health care
facilities 5. house rent-subsidies
c. others 6. price subsidies of
consumer goods
B. Working capital 7. social relief funds
8. pensions C. Inventory and loans 9. amenities
from banks 10. national defense
11. government
administration 12. science
13. propaganda (state-run
newspaper, radio & TV) Note: Based on Chu, Cheng-Ping, 1978, "The National Economic
Balance Table," in Lardy, Nicholas R., White Plains, New York: M. E. Sharpe Inc., pp. 122- 27.
* All the underlined items are household related consumption.
fund. Table 2.1 shows the main components of total income distribution in socialist countries. In the table all the underlined items are household related consumption. The study of income distribution in socialist countries should cover all of them. As we already noted, the distribution of wages in socialist countries has been studied by many scholars, so that in this thesis, we will concentrate on the distribution of
social consumption.
From Table 2.1, we can see that the social consumption fund has two sources. One is from the consumption sector, and the other is from accumulation sector. These social
consumption funds are controlled and distributed by central planners in housing plan, education plan, health and cultural plan (Lardy, 1978; Bor, 1967).
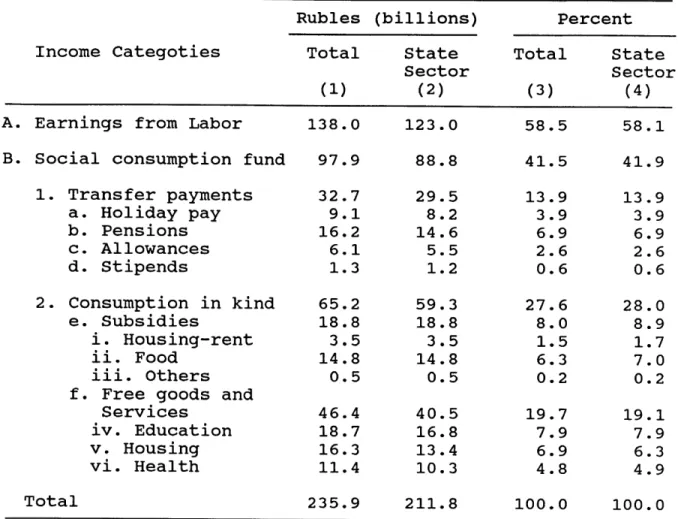
The ratio between the wages and social consumption expenditures differs in different socialist countries. In most countries, however, wages account for 50-60 percent of total consumption fund, and social consumption is about 40-50 percent. Table 2.2 shows the composition of total household consumption fund in the USSR (Union of Soviet Socialist
Republics) in 1970. The ratio between wages and social
consumption was 58:42. Table 2.3 shows the ratio in China in 1983 was 53:47 for urban population.
Compared to the social welfare expenditure in the Western industrial countries, the social consumption in socialist
countries is very different in nature. First, while the social welfare programs in the West, such as unemployment-insurance, low-income public housing projects, medicaid, and food stamps, are exclusively provided for the poor people
(SAUS, 1989), the social consumption in socialist countries is distributed to the entire population. Second, the social
consumption plays a far more important role in the total household consumption in socialist countries than the social
Table 2.2 Composition of Consumption Fund
Rubles (billions) Percent Income Categoties Total State Total State
Sector Sector
(1) (2) (3) (4)
A. Earnings from Labor 138.0 123.0 58.5 58.1 B. Social consumption fund 97.9 88.8 41.5 41.9 1. Transfer payments 32.7 29.5 13.9 13.9 a. Holiday pay 9.1 8.2 3.9 3.9 b. Pensions 16.2 14.6 6.9 6.9 c. Allowances 6.1 5.5 2.6 2.6 d. Stipends 1.3 1.2 0.6 0.6 2. Consumption in kind 65.2 59.3 27.6 28.0 e. Subsidies 18.8 18.8 8.0 8.9 i. Housing-rent 3.5 3.5 1.5 1.7 ii. Food 14.8 14.8 6.3 7.0 iii. Others 0.5 0.5 0.2 0.2
f. Free goods and
Services 46.4 40.5 19.7 19.1
iv. Education 18.7 16.8 7.9 7.9
v. Housing 16.3 13.4 6.9 6.3
vi. Health 11.4 10.3 4.8 4.9
Total 235.9 211.8 100.0 100.0
Sources: Column 1: line ii: line vi: Dobson, 1988;
Treml 1978; line V: Dimaio, 1974;
all the others: McAuley, 1979. Column 2: line A, McAuley, 1979; Line v: Dimaio, 1974; other figures are derived by assuming that state employees received the following share of the total: line a, b, c, d, iv, vi: 90 percent; line i. ii. iii: 100
percent. In 1970, Soviet state employees account for 84.8 percent of total labor force. Study in our later
chapters indicates that they obtain social consumption more than national average.
13
Table 2.3 Composition of Consumption Fund in Urban Sector, China 1983
Income Categories Yuan (billions)*l Percent A. Wages (including sick leave) 93.5 53.2
among which:
Bonuses, piece-rate wages
and above-quota payments 12.1 6.9 B. Social consumption fund 82.4 46.8
1.Labor insurance & welfare 21.0 11.9
a. Retire-pension 8.7 4.9
b. Welfare expenditure*2 1.7 1.0
c. House-rent subsidies 4.6 2.6
d. Health 6.0 3.4
2.Relief funds for
natural disasters 0.4 0.2
3.Consumption in kind 61.0 34.7
e. Price subsidies 32.8 18.6
f. Housing investment 17.8 10.1
g. Education expenditure
from state budget 10.6 6.0
h. Education expenditure
from state-owned firms 2.9 1.6
i. Capital investment in
Education & Health 3.9 2.2
j.
Deduction of wages fromeducation & health -7.0 -4.0
Total 175.9 100.0
Sources: SSBP, 1984, p III-6, 14, 15, 36, IV-58; SSBP, 1987, p. 556, 557, 559; except: line a: Zhuan & Li, 1985, p. 27; line c: based on SSBP, 1984, p. 111-81, and Zhu & Wang 1988 p. 59; line 5: residue.
*1: All the data in this column are originally stated for urban sector. Except lines g, i,
j.
For linej,
and i: in 1983 total state expenditure on education was 15.1 billion yuan, capital investment on education and health was 4.9 billion yuan. We assume that urban sectorreceives 70% share of total educational fund and 80% of investment in E & H. For line
j:
in 1983 total wages in the sector of "science, education, health, and culturalactivities" was 11.0 billion yuan, we assume that 80% of the total went to E & H of which 80% in urban sector. *2: Including allowances, social relief and others.
welfare programs in Western countries. In the United States, for example, the ratio between total personal disposable
income and the public social welfare expenditure was 79.6 20.4 (SAUS, 1989, p. 334, p. 414). In China and the USSR, as we see from Tables 2.2 and 2.3, this ratio is almost half to half.
From the above comparison, we learn that the distribution of social consumption is a very important part of total
socialist distribution, therefore it has a great impact on the total inequalities in socialist countries.
There are only a few studies available on the
distribution of social consumption, which are conducted by Western scholars. These studies tend to show that social consumption is very equally distributed in socialist
countries. Adam and Nosal (1982, P. 195), for example, conclude that the distribution of transfer payments among household-income groups within each social stratum continues
to favor low-income groups, which "contributed to a narrowing of household income differentials for the whole country."
To date, the most comprehensive study on distribution of social consumption in socialist countries is conducted by Ofer and Vinokur (1988). They did a sample survey of Soviet
immigrants who went to Israel during the mid1970s. Ofer and Vinokur found that the distribution of the social consumption
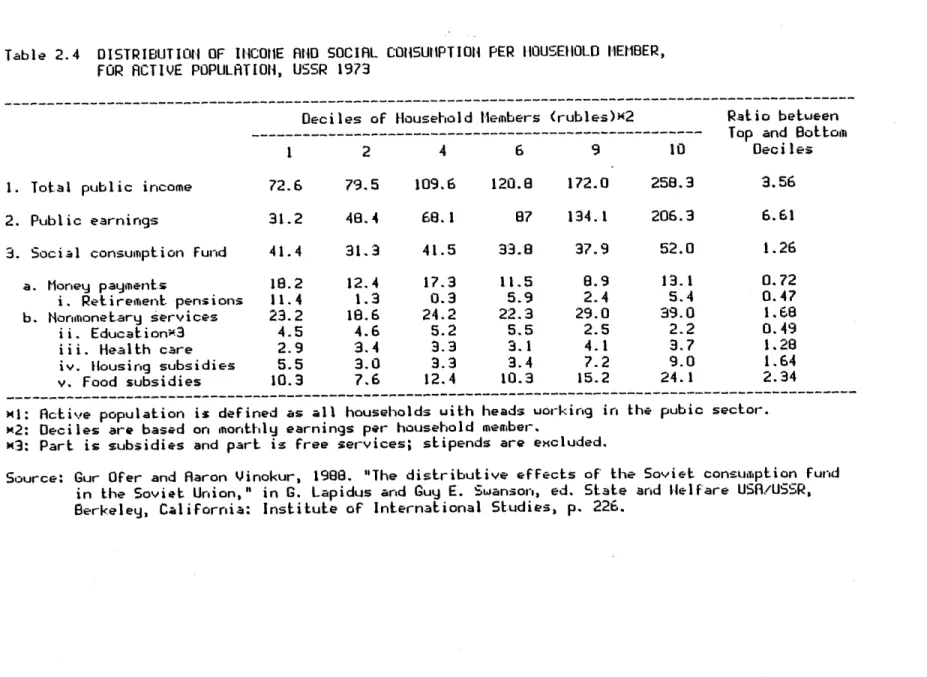
fund was very equal in the Soviet Union. Data presented in Table 2.4 show that although the households in the highest
decile receive wages 6.6 times as much as that received by those in the lowest decile group, the former only receive 1.6 times as much as social consumption fund that received by the latter. Among all items of social consumption, retirement pensions and educational fund are distributed particularly in
favor of low-income groups. Households in lowest income decile received twice as much retirement pensions and
educational fund as that received by households in the highest decile group. Health services and housing subsidies are also distributed much more equally than wage distribution; only
food subsidies are distributed in favor of higher income families, but it is still more equal than wage distribution. In general, according to Ofer and Vinokur, the social
consumption fund has a great redistributive impact on overall distribution, which reduces the ratio between the top and
bottom deciles from 6.6 in wage distribution to 3.6 in overall distribution.
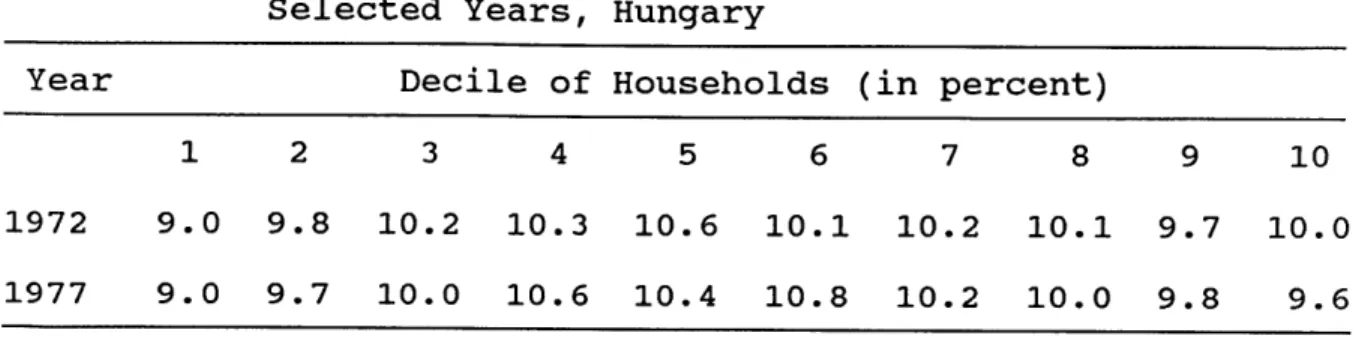
Moreover, the Hungarian official statistical data also demonstrate an extremely equal distribution of social
consumption among all the household income deciles. Table 2.5 shows the distribution of social benefits in Hungary in 1972 and 1977. According to the table, the social consumption is distributed very flatly among the entire population.
On the other hand, many scholars in socialist countries as well as from the West, such as Szelenyi (1983), Daniel
Table 2.4 DISTRIBUTION1 OF INCOHE AND SOCIAL COISUMPTIOH PER HOUSEHOLD MEMBER,
FOR ACTIVE POPULATION, USSR 1973
---Deciles of Household Members (rubles)x2 Ratio between
--- Top and Bottom
1 2 4 6 9 10 Deciles
1. Total public income 72.6 79.5 109.6 120.8 172.0 258.3 3.56 2. Public earnings 31.2 48.4 68.1 87 134.1 206.3 6.61 3. Social consumption fund 41.4 31.3 41.5 33.8 37.9 52.0 1.26
a. Money payments 18.2 12.4 17.3 11.5 8.9 13.1 0.72
i. Retirement pensions 11.4 1.3 0.3 5.9 2.4 5.4 0.47 b. NoniTionetary services 23.2 18.6 24.2 22.3 29.0 39.0 1.68
ii. Educationx3 4.5 4.6 5.2 5.5 2.5 2.2 0.49
iii. Health care 2.9 3.4 3.3 3.1 4.1 3.7 1.28
iv. Housing subsidies 5.5 3.0 3.3 3.4 7.2 9.0 1.64 H
v. Food subsidies 10.3 7,6 12.4 10.3 15.2 24.1 2.34
---M1: Active population is defined as all households with heads uorking in the pubic sector.
x2: Deciles are based on monthly earnings per household member.
M3: Part is subsidies and part is free services; stipends are excluded.
Source: Gur Ofer and Aaron Vinokur, 1988. "The distributive effects of the Soviet consumption fund in the Soviet Union," in G. Lapidus and Guy E. Swanson, ed. State arid Nelfare USR/USSR, Berkeley, California: Institute of International Studies, p. 226.
Table 2.5 Distribution of Social Benefits In Kind In Selected Years, Hungary
Year Decile of Households (in percent)
1 2 3 4 5 6 7 8 9 10
1972 9.0 9.8 10.2 10.3 10.6 10.1 10.2 10.1 9.7 10.0 1977 9.0 9.7 10.0 10.6 10.4 10.8 10.2 10.0 9.8 9.6
Source: Flakierski, Henryk, 1986, Economic Reform and Income distribution: A Case Study of Hungary and Poland, Armonk, New York: M. E. Sharpe, Inc. p. 105.
inequalities in one or several items of social consumption, such as public housing, free education, pensions, and free health care. Most of these studies show that there are serious inequalities in the distribution of social
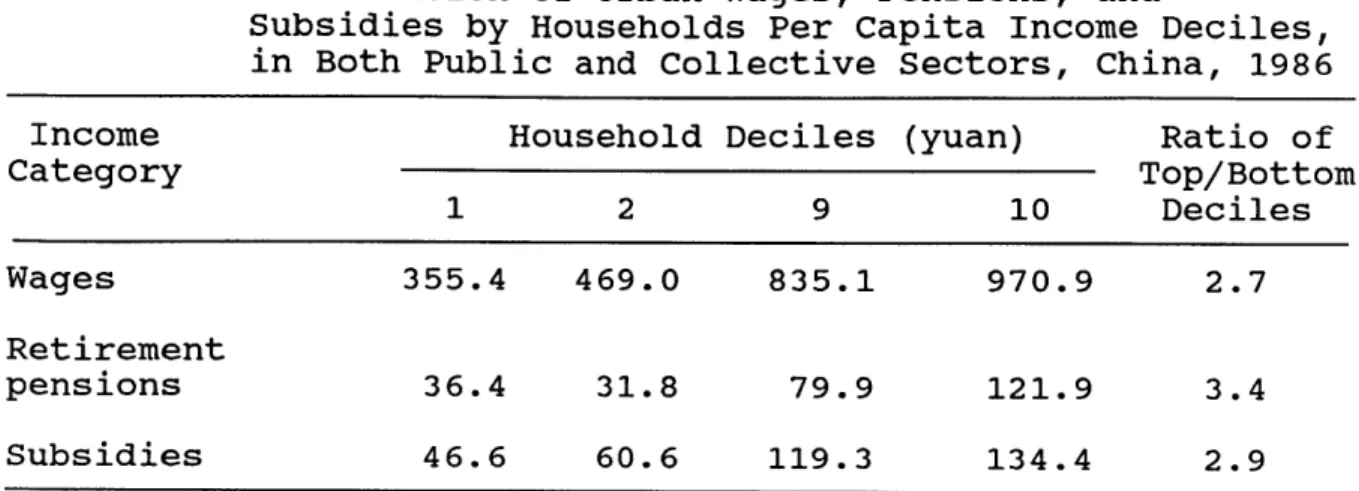
consumption. Furthermore, contrary to Hungarian statistical data, official statistical data from China (as shown in Table 2.6), indicate that at least the monetary part of social
consumption, i.e., transfer payments, is distributed more unequally than wages. In 1986, the ratio between wages received by the top 10 percent per capita income households and that by the bottom 10 percent is 2.7:1, while the ratio between the retirement pensions received by the two groups is 3.4:1, which is greater than the wage ratio.
Why is there such a controversy? Why do Hungarian and Chinese data differ so much? Do the Hungarian and Soviet data represent the truth, or do the Chinese data? Is it because the distributions of social consumption are very equal in
Table 2.6 Distribution of Urban Wages, Pensions, and
Subsidies by Households Per Capita Income Deciles, in Both Public and Collective Sectors, China, 1986 Income Household Deciles (yuan) Ratio of
Category Top/Bottom 1 2 9 10 Deciles Wages 355.4 469.0 835.1 970.9 2.7 Retirement pensions 36.4 31.8 79.9 121.9 3.4 Subsidies 46.6 60.6 119.3 134.4 2.9
* Including both state-owned and collective sectors.
Source: SSBP, 1986: State Statistical Bureau PRC. A Survey of Income and Expenditure of Urban Households in China, 1985, Beijing: China Statistical Information and Consultancy Service Center, p. 25.
Hungary and the Soviet Union, and more unequal in China?
In the following chapters, we will search for the answers to the above questions by examining in detail the
distributional mechanisms and results in the allocation of major items of social consumption: public housing, education, health care, pensions, and price subsidies. Each chapter deals with one of the items. We will mainly concentrate on data from the USSR, China, and Hungary, for the reason that data from these countries are much easier to obtain than from other socialist countries.
Chapter 3 Public Housing
Housing is a large item of consumption in kind in
socialist countries. In the Soviet Union in 1970, the urban public housing expenditure, which including housing investment and rent-subsidies, was 13.8 percent of total earnings in
urban public sector. 2 In China in 1983, it was 23.8 percent
(SSBP, 1984).
In most socialist countries, housing is a public good to be built and allocated through the administrative allocation system. Each year, the state puts a portion of the national investment fund into housing construction, and distributes it to people through administrative allocation mechanisms
(DiMaio, 1974; Daniel, 1983; Zhu and Wang, 1988).
Because in socialist countries, wages and salaries are set to exclude the cost of housing (Szelenyi, 1983), housing has to be distributed to people virtually free. Housing rent is very low in all the socialist countries. In China, for
example, it was only 2.6 percent of average household income in 1961. It decreased to 1.4 percent in 1981, and further decreased to 0.9 percent in 1986 (SSBP, 1987). In Eastern Europe and the USSR, rents for public housing are only 1-3
2 This figure is computed based on data from McAuley (1979),
percent of average family income (Suranyi-Unger, 1972). Such low rents cannot even cover the housing maintenance cost. The state not only has to provide free housing, but also has to pay the most part of the housing maintenance cost.
Such a low wage, free housing policy is the main cause for the chronic housing shortage in socialist countries. There is an insatiable demand for housing, because everybody
is entitled to get housing from the state, and the more
housing one gets, the more benefits she or he obtains. On the supply side, the state does not have incentives to build more housing, because housing investment is actually regarded a heavy burden--it cannot generate direct revenue for the state
(Zhu and Wang, 1988). Even when under social pressures, the state does want to increase housing supply, there is a limited amount of capital available. It is acknowledged by the
governments of the socialist countries that under the
administrative allocation of housing, the conflicts between the limited supply of housing and the insatiable demand for it can never be solved (Conner, 1979; Daniel, 1983; Liu, 1989).
One solution now being adopted by many socialist countries is to allow private ownership of housing property and to
encourage private housing investment. In the USSR, this policy was adopted as early as in 1947 (Dimaio, 1974). In China, it was started only in the mid1980s. This policy, as we will see later, has a strong negative impact on income distribution, because under such a policy, public housing is
only distributed to a part of urban population. Thus, those who get public housing receive a large share of the
concentrated public housing fund, and others who do not get housing receive nothing, they have to build housing on their
own resources.
Take China as an example. According to the official 1985 statistical data, the average cost for building a 55 square meter flat of apartment type housing was 30,000 yuan, and the basic maintenance and repair cost for the flat was 240 yuan a year (see Zhu and Wang, 1988). Residents had only to pay 55.8 yuan for housing rent, and the state subsided the remaining 184.2 yuan of maintenance cost. Now let us consider two households with the average annual income--748.9 yuan per capita in 1985 (SSBP, 1986). One family receives a 55 square meter flat from the state, so it receives not only the 30,000 yuan investment free3, but also the 184.2 yuan of maintenance cost. The other family, on the other hand, is unable to get public housing, and it has to build a house of the same size and same cost on their own. Thus, while the first family can enjoy free housing and rent-subsidies forever, the second family not only has to invest 30,000 yuan from their own pocket, but also has to spend 240 yuan (184.2 plus 55.8) to maintain it. From this example we can see the distributive
3once the family obtain the flat, they usually can live there for decades, and leave to their children, unless they move to better public housing. Therefore, in fact they own the flat.
impact of public housing. For an average income family with 748.9 yuan per capita annual income, the 30,000 yuan
investment and several hundred yuan annual cost would be an extremely heavy burden.
Now, the question is who gets the most from public housing? Does most public housing stock in socialist
countries go to the poorest groups in society, as is the case
of the public housing projects in Western industrial
countries? Or instead, do those who have power, status, and high income have the priority in obtaining public housing? To find the answers, let us examine how the public housing is distributed in China, Hungary, and the Soviet Union.
China
In China, everybody working in the public sector relies on the government to provide housing. Public housing is built and distributed by work units, which receive housing
investment funds and subsidies from the government, and build and distribute housing to workers and staff within the work units (Liu, 1989).
There are two levels of inequalities in housing
distribution. First, there is an inequality among different work units. According to Zhu and Wang (1988, p. 27), large
industry enterprises, government agents, and all those work
units with political or economic power usually get more
housing funds from the state than others, so that, on average, people working in these units have better housing conditions. Other work units, such as most work units at local level or remote areas, small enterprises, collective-enterprises, middle and primary schools, etc., usually get few or no housing funds. People working in these "peripheral" units suffer the most from the housing shortage.
The second level of inequality is within work units, where housing is officially distributed according to a criteria
which is based on a person's seniority, performance, need, and administrative ranks4. In the circumstances of housing
shortages, however, the administrative rank is usually the only criteria observed (Zhu and Wang, 1988, p. 23).
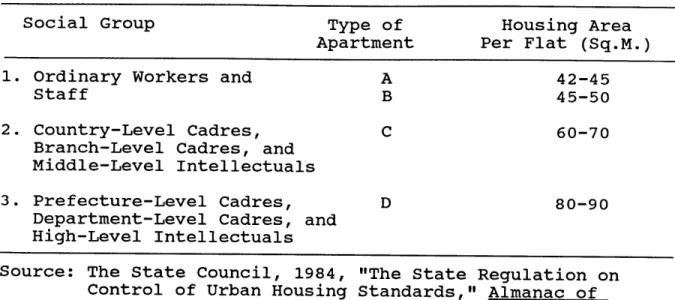
Table 3.1 shows the official regulation on housing standards for different administrative ranks, which allows people in higher positions to have better housing. We note that the regulation only sets standards up to middle-level
cadres. For those at higher levels, such as managers of large enterprises, high-level military officers, and cadres at
provincial, municipal, and ministerial levels and higher, there is no restrictive regulations of housing standards.
4In China, all
the occupations are attached to an administrative rank. We have "monk with branch-director's rank," or "monk with county-director's rank"; "restaurant-director with county-governor's rank" or "with department-director's rank"; and "professor with province-governor's rank." Each rank corresponds to a specific level of privileges. (Chen,
Table 3.1 Urban Housing Standards, China, 1983
Social Group Type of Housing Area
Apartment Per Flat (Sq.M.)
1. Ordinary Workers and A 42-45
Staff B 45-50
2. Country-Level Cadres, C 60-70
Branch-Level Cadres, and Middle-Level Intellectuals
3. Prefecture-Level Cadres, D 80-90
Department-Level Cadres, and High-Level Intellectuals
Source: The State Council, 1984, "The State Regulation on Control of Urban Housing Standards," Almanac of China's Economy, Beijing: China Statistical Information and Consultancy Service Center.
In fact, the above regulation has never been
well-observed. As one state government document points out, many provinces and ministries ignore the state regulation and set their own higher housing standards freely, and they build
increasingly larger and higher-standard housing for leading cadres (SSBR, 1984). Study by Zhu and Wang (1988) also shows that many not-so-privileged cadres and those who have
connections with powerful cadres usually obtain more housing by occupying two or three flats, each within the standards of the state housing regulation. For cadres, housing is a symbol of power and social position, so they often compete with each other to show off who has the better and larger housing (Zhu and Wang, 1988).
On the other hand, the majority of population are not able to obtain housing even at the lowest standard of the state
regulation. Because the total public housing investment is
fixed for each year, when those who have power try their best to obtain more housing, ordinary people will inevitably have less housing. According to the data from China's first urban housing census in 1986 (see Zhu and Wang, 1988; Liu, 1989),
1.28 million urban households had no housing at all, i.e., they lived in warehouses, corridors, workshops, classrooms, office rooms, and basement year after year; another 4.15
million households were "inconvenient households," i.e., three generations living in one bedroom, parents and grown-up
children living in one bedroom, or two couples living in one bedroom. These two types of households accounted for 13.7 percent of China's total urban households.
Tables 3.2 and 3.3 show the housing distributions among
Table 3.2. Average Per Capita Housing Distribution by Social Groups, Beijing 1986.
Social Groups Average Housing Building Area (Sq.M./Person)
1. Ordinary Workers 3
2. Employees at municipal level 6 3. Employees at the Central government level 9
Source: Zhu, Jienghong, and Wang, Guozen, 1988, Housing-Housing, (in Chinese) Shengyang: Liaoning People's Publishing House, p. 28.
Table 3.3 Average Per Capita Housing Distribution by Social Groups, Shanghai 1982.
Social Groups Average
1. Cadres at and above Branch Level 2. Average-staff
3. Primary- and middle-school teachers 4. Manual Workers
Housing Building Area
Housing Building Area (Sq. M./Person)
8.17 6.22 5.58 4.49
Source: Zhu, Jienghong, and Wang, Guozen, 1988, Housing-Housing, (in Chinese) Shengyang: Liaoning People's Publishing House, p. 25.
social groups in Beijing and Shanghai. According to the data in the two tables, people with higher ranks in the
hierarchical structure have more housing.
In terms of the overall distribution of housing, in 1986, 25.7 percent of China's urban population had a per capita housing building area below 4 square meters, 21 percent above 8 square meters (SSBP, 1987). In order to compare with the wage distribution in China, we assume that the average housing
area received by the bottom 20 percent of population was 3 square meters per capita in 1985, and that received by the top 20 percent was 10 square meters per capita. Then the ratio between the housing received by top 20 percent households and the bottom 20 percent households was 3.3:1, which is much higher than the ratio of wages received by the top 20 percent
and the bottom 20 percent, which is 1.8:1 (see SSBP, 1988). If we further consider the differences in housing quality and facilities, the disparity will be much larger.
To sum up, from the above analysis, we may conclude that the public housing is more unequally distributed among the population than the wages. Public housing does not equalize the overall income distribution, instead, it further increases inequalities in the Chinese society.
Hungary
Housing policy in Hungary is the same as in China in that the state only provides housing for urban population.
Although in the urban areas, the proportion of privately owned dwellings has been increasing, the prevailing form of
dwellings is still state-owned apartment houses. In 1980, the ratio of state-owned dwellings in Budapest was close to 60 percent (Daniel, 1985, p. 392).
In Hungary, due to the dualistic housing system, i.e., the co-existence of public free housing and private housing
market, inequality in public housing distribution has become "one of the most important differentiating factors of the society" (Daniel, 1985, p. 393).
In the late 1960s, Szelenyi and Konrad made a housing survey in two Hungarian cities. Their data show that the state distribution of housing in Hungary systematically
favored the higher income groups, both in quality of housing and rent subsidies. The overwhelming majority of the working class has to house itself by building or buying at market prices. Consequently, "the richer classes get better housing
for less money and effort, while poorer classes get worse housing at the cost of more money or effort, or both"
(Szelenyi, 1983, p. 63).
As Szelenyi further points out, this inequality of
housing distribution is caused by the socialist distribution policy. Because wages are set to reward those with higher
status and position in the social stratification, and wages do not cover the cost of housing and other public goods and
services, then the distribution of housing and other public goods can only be determined by people's position and status. Reward, instead of need, is the basic criteria for housing
distribution.
More recent studies further reveal the inequalities in public housing distribution in Hungary. According to the 1976 household statistics, low-income households not only lived in
low quality housing, but also received much less in rent subsidies than average households. The rent subsidies
received by households in the two lowest income brackets5 were 12% of their low annual income, while the households in the two highest income brackets, covering 8 percent of total
5The population was classified into ten income brackets, according to their household per capita income.
households, received rent subsidies that amount to 13-15
percent of their high annual income, in addition to their high housing qualities, better facilities and more spacious
dwellings. In terms of the absolute amount of the subsidy, households in the second highest income bracket received 7.6
times as much as that received by the households in the lowest bracket (Daniel, 1983, p. 95).
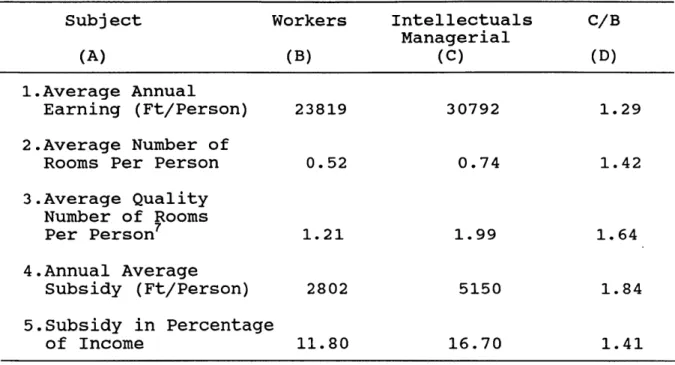
Table 3.4 compares the disparity in the distribution of earnings to that in housing distribution in Hungary. The first line in the table shows the earning difference between "workers" and "intellectuals and managerial," the ratio
between the latter and the former is 1.29:1. The data in the third line indicate that the ratio of housing received by the two groups is 1.64:1, and the data in the next line show that the ratio of rent subsidies received by the two groups is 1.84:1. Apparently the public housing and rent subsidies are more unequally distributed than wages6
6
Some people may argue that the disparities on both wage distribution and housing distribution are not very significant between the two groups. However, we are only comparing two aggregate groups. In fact, the "intellectual and managerial" group includes both low-income rank-and-file workers and
high-income bureaucrats and managers. if we break it down, both the earning disparity and the housing disparity would be much greater. For example, in 1977, the ratio between the average earnings of the top 10% and the bottom 10% household per capita
income groups was 4.1 : 1 (Flakierski, 1986, p. 91). Our purpose here is not to show how unequal the distributions are, but to compare the inequalities in housing distribution to that of wages distribution, and to see which one is more unequally distributed.
Table 3.4 Redistributive To Social Groul
Effects of Rent-subsidies According ps, Hungary, 1980. Workers Intellectuals C/B Managerial (B) (C) (D) 30792 23819 0.52 Subject (A) 1.Average Annual Earning (Ft/Person) 2.Average Number of
Rooms Per Person 3.Average Quality Number of Rooms Per Person7 4.Annual Average Subsidy (Ft/Person)
5.Subsidy in Percentage
of IncomeFt: Frionts.
Source: Daniel, Z., 1983, Central Redistribution 31 (1-2), p. 97. 0.74 1.99 5150 16.70 1.29 1.42 1.64 1.84 1.41"Public Housing, Personal Income and in Hungary," Acta Oeconomica, Vol.
Apparently, the advantaged social group is further better off through the housing subsidies. Then, what is the overall distributional effect? According to the 1976 survey, the ratio of per head household earnings between the highest and the lowest deciles was 4.5:1, with the public housing supply indicator (see the footnote to Table 4.6) taken into account, this ratio rises to 12.5:1 (Ibid). In a separate study,
7 This indicator combines both quantity and quality of dwelling. It expresses quality as an "additional number of rooms," Thus the room of a dwelling with a bathroom is valued
twice as high as a flat without bathroom, and modern heating is worth a further half-room (Daniel, 1983).
31 1.21
2802
Flakierski (1986) also noted the serious inequality in public housing distribution. As Daniel (1985, p. 408) concludes: "The allocation of apartments or flats does not reduce but, on the contrary, increases inequality within our society."
USSR
The public housing policies in the USSR are very similar to those in China. The state takes full responsibility of providing housing for people. During 1981-1985, state capital
investment accounted for more than 70 percent of total housing investment (Sherer, 1987, p. 299). As in all other socialist countries, there is a constant shortage of housing supply. According to Sherer (1987), the Moscow News reported that in 1986 there were 90 million people waiting for housing, which would need 27 million apartments, so people on the waiting list have to wait more than ten years on average for obtaining public housing.
In the Soviet Union, public housing serves as a valuable tool of rewards. The Soviet housing law explicitly states that the authority should give housing priority to people with
outstanding performance, or high skills and any person specifically designated by the government (Dimaio, 1974). Thus, the policy not only justifies unequal distribution, but also give a high degree of flexibility to those in charge of
housing distribution to use housing for patronage purposes. In 1985, for example, the Frunze city executive committee distributed 1862 new public apartments, only 216 of these apartments (11.6%) were available to people on the waiting list, 88.4 percent were distributed through other channels
(Sherer, 1987, p. 299). Matthews (1978) also noted the privileges received by the Soviet elites in housing distribution in the USSR.
To sum up, first, it is very clear that public housing distribution in socialist countries serves as an integral part of socialist distribution. It does not serve the same
function as public housing projects in Western countries, which is to help the poor. On the contrary, in socialist countries, it is the people who have political power and position that tend to have priority in obtaining public
housing, and the poor people tend to live in private housing. Second, in most socialist countries, not only is public
housing very unequally distributed, but also this unequal distribution of housing increases the overall economic inequality.
Chapter 4 Education
Education is the second largest in-kind distribution in socialist countries. In the USSR, the educational fund
amounted to 13.6 percent of total wage bill in 1970 (see Table 2.2). In China, it amounted to 16.5 percent of total wage bill in 1983 (see Table 2.3).
Education is free in all socialist countries. Common wisdom is that free education tends to have a strong
equalizing impact, because it helps the children from low-income families to obtain education. In this chapter, we will test this common belief by examining the education systems in the Soviet Union, China, and other socialist countries. The main question we ask here is whether the educational fund is
more equally distributed than wages, or vice versa.
The Soviet Union
Although education in the Soviet Union is tuition-free, many low-income families still find it an economic burden to let their children to go to school. According to a 1973 general survey of education conducted in six regions of the Soviet Union, half of the first-graders and two-fifths of the eighth-graders reported family per capita monthly incomes of
50 rubles and less, which is less than the amount needed to maintain the minimal standard of living estimated by Soviet
8
economists. Many Soviet families need their children to earn money as early as possible. Contrasted with the tangible
rewards afforded by employment, it is too costly for many families to allow their children for two or three more years of high-school study or five more years of college. Besides this opportunity cost, there is also a direct cost. Although
in recent years, seven out of ten college students received state stipends, and more than half lived in state-subsidized dormitories, most families still have to contribute to their
children's support. If a student received a stipend and lived either in a dormitory or at home, his or her family still has to provide some 15-25 rubles a month to make ends meet
(Dobson, 1988). The burden was considerable for poor families with per capita monthly income below 50 rubles. If the
student did not get a scholarship or had to rent an apartment, the cost become excessive for many.
On the other hand, families in the upper strata can afford these economic costs. To them, not having their children to go to college is a risk too high to take, because in the USSR, as well as in all other socialist countries, to be educated is
8 See Dobson (1988, p. 42). According to him, in the Soviet
six-region survey, the first-graders' teachers collected information on income from the parents, while the eighth-graders were asked to report their families' income themselves. The data are subject to the biases of under-reporting.
the necessary condition for climbing up the social hierarchy, though it may not be a sufficient condition (Lane, 1982).
Consequently, free education in the Soviet Union is not equally distributed among all social groups. The data in Table 4.1 are from the 1973 six-region survey, with which we
find two phenomena. First, the data show different chances of
Table 4.1 USSR Social-occupational Characteristics of
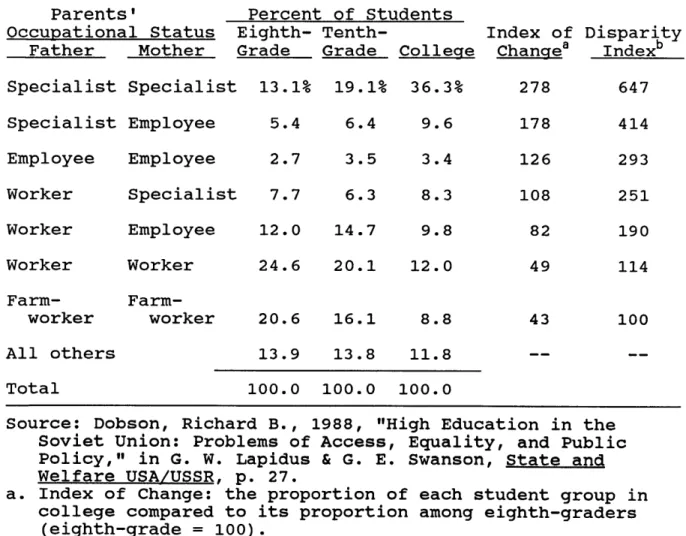
Eighth-graders', Tenth-graders', and College Students' Parents. Six-region Survey, 1973 Parents' Percent of Students
Occupational Status Eighth- Tenth- Index of Disparity Father Mother Grade Grade College Changea Indexb Specialist Specialist 13.1% 19.1% 36.3% 278 647 Specialist Employee 5.4 6.4 9.6 178 414 Employee Employee 2.7 3.5 3.4 126 293 Worker Specialist 7.7 6.3 8.3 108 251 Worker Employee 12.0 14.7 9.8 82 190 Worker Worker 24.6 20.1 12.0 49 114 Farm- Farm-worker worker 20.6 16.1 8.8 43 100 All others 13.9 13.8 11.8 -- --Total 100.0 100.0 100.0
Source: Dobson, Richard B., 1988, "High Education in the Soviet Union: Problems of Access, Equality, and Public Policy," in G. W. Lapidus & G. E. Swanson, State and Welfare USA/USSR, p. 27.
a. Index of Change: the proportion of each student group in college compared to its proportion among eighth-graders
(eighth-grade = 100).
b. Disparity Index: the degree to which the chances for
becoming college students for eighth-graders from various strata when the children of farm workers is taken as the reference point (= 100).
becoming college students for children of different social origins. The "disparity index" reveals that the offspring of both-specialists parents were 5.7 times as likely to enter college as urban manual workers' children at the eighth-grade. Moreover, since the specialists include occupations as diverse as scientists with postgraduate degrees and elementary-school teachers, chief-engineers and rank-and-file technicians,
high-level party officials and minor administrators, a more finely differentiated breakdown would magnify the differences.
Nonetheless, the data clearly reveal the overall unequal
distribution of free education. Second, the table also shows that there were many high school drop-outs in the lower social strata. At the high school level, for example, the proportion of children from farm-families to the total student body
dropped from 20.6 percent at eighth grade to 16.1 percent at tenth grade, and children from workers' families dropped from 24.6 percent to 20.1 percent.
Table 4.2 shows that in the late-1960s the distribution of college education was very unequal among different social groups. The data show that although "specialists" only
accounted for 14.2 percent of the employed population, their children consist of one-third to one-half of the student body of different universities. The children from the working class, which made up some 75 percent of the employed
population, only accounted for about 30 percent of the student
Table 4.2 Occupational Status of Soviet Students in Different Universities, Late 1960s
Occupational % of Employed % of Student
Status of Parents Population Body Index
Specialists 14.2 31.5-51.0 2.17-3.59
Nonspecialist
employees 10.6 9.1-29.5 0.86-2.78
Workers 60.0 25.3-29.4 0.42-0.49
Collective farmers 15.2 0.9- 4.2 0.06-0.28
Source: Yanowich, Murray, 1977, Social and Economic Inequality in the Soviet Union, White Plains, NY: M. E. Sharpe.
pp. 88-89.
9
body of these universities.
In the beginning of this chapter, we mentioned Ofer and Vinokur's study of the distribution of Soviet social
consumption in Table 2.4. Ofer and Vinokur claim that the distribution of education favors low-income groups rather than high-income groups. The ratio between the top and bottom
decile groups in terms of receiving education benefits is 0.49:1, which means that people in the lowest income decile receive twice as many the educational benefits as those in the
9Some people may argue that it is
not necessary for the working people to have college education. However, here what we are interested is the distributive effect of the free education policy, i.e., who gets the most benefits from this free education policy, and whether this policy increases the overall inequalities in society. The free education is actually financed by everybody in the nation. If, as those argued, it is not necessary for working people to go to college, then it is also not necessary and not fair for them to bear the economic burden of the free education.
top income decile. However, from the above analysis the Soviet educational system and the social structure, we would conclude that Ofer and Vinokur's data are very unlikely to be correct.
China
In China, due to the shortages of state education funding, only a small proportion of primary school graduates can go to junior high school, of which a small proportion go to senior high school, and an even smaller proportion to college. The
figures below show the total numbers of students at different levels of education in 1985. From the data, we can see
clearly the serious shortages of educational opportunities in higher levels of education in China (SSBP, 1986).
Primary School students: 133.70 million; Junior high school students: 40.11 million; Senior high school students: 11.56 million; Undergraduate students: 1.70 million; Graduate students: 0.09 million. Another character of China's educational system is that the free education is basically concentrated in urban areas. In the rural areas, the state only provides limited financial support for primary and junior high schools, which basically rely on farmers' collective funding (Ji, 1985). Children of farmers can go to urban areas to attend senior high school, through competitive entrance-examinations. However, many
farmers' children cannot afford to live and study in urban
high schools, so even if they are able to compete with urban
students, the chances of going to senior high school are much
smaller for rural population than for urban population.
Needless to say, the chances of going to universities are even
much lower for farmers' children. In 1984, only 26.5 percent
of undergraduate students in China were from rural areas,
although about 80 percent of total population were farmers
(SSBP, 1986).
Thus, we estimate that more than 70 percent of
state expenditures on education is concentrated in urban
sector.
The education system in China's urban areas has developed
a very complex, elite-promoting hierarchical structure. Even
in the urban areas, the chances of any student in primary
school to go through all the levels to university are very
slim and the competition for education opportunities is very
strong. Consequently, the main criteria for judging the
quality of a school is based on the proportion of its
graduates entering schools of a higher level. The whole
Chinese education system is geared to reward those schools
that have higher rates of graduates entering higher levels of
school (Zhang, 1982).
Take secondary education for example,
in China both junior high and senior high schools are
classified into two different qualities: key schools and
ordinary schools. The key schools usually get more funding,
better facilities, and higher quality teachers, and the
with much less material supports. When students graduate from primary schools, they face two different futures. Those in the upper level can go to key junior high schools, which means they will get higher quality education and much better chances to go to senior high schools; and those in the middle and
lower levels go to ordinary schools, a few in the bottom may not even be admitted. Then, after they graduate from junior high school, this selection procedure happens once more.
Furthermore, within each senior high school, key or ordinary, students are classified into "advanced class" and "slow class" according to their grades in the examinations. The former are those considered more likely to make their way to college, and the latter are those considered to have few chances to go to college (Zhang, 1982).
This hierarchical elite-selecting structure tends to discriminate against children of lower income and lower educated families. One study found that there is a high
correlation between parents' educational levels and students' performances in primary and middle school, and most repeaters were found from manual workers families (Wu, 1984).
According to the author's knowledge, in China, going to school is also considered by many low-income families as an economic burden. Student drop-outs in elementary and middle schools is a well known phenomenon. A study on student drop-outs in junior high schools in the city of Tianjin shows that in 1986 the drop-out rate in junior-high school was 2.8
percent for first-graders, 8.2 percent for second-graders, and 6.0 percent for the third-graders. Most of the drop-outs were from low income workers' families, mainly because their
parents want them to work to help support families (Tianjin Ribao, April 18, 1986).
On the other hand, children from intellectuals' families and from bureaucratic officials' families are much favored by this system. The former usually have a strong family
tradition of higher education, and their children tend to do very well in school; and the latter have privileges of access to school. Elites' children can go to the best high schools that are especially set up for them (Parish, 1981). In a speech in 1982, the Chinese minister of education reported that many cadres used their power to make their not-so-good children get into key schools and "advanced class" (Zhang,
1982).
Given such an elite-selecting structure of secondary school, naturally the college education in China is very
unequally distributed among different social groups. There is strong evidence that children from low social strata are much less represented in college level education. Take a rural county for example, in 1978, 231 college applicants in the county were admitted to colleges and universities. Among them only 48 were from workers' families, and 73 from farmers'
families. Together they represent 52.4 percent of the total applicants being admitted, although over 99 percent of the 1
Table 4.3 Occupational Status of Chinese Students in Colleges and Graduate Schools, 1977-87
Occupational % of Employed % of Undergra. % of Graduate Status of Parents Population Student Body Student Body
Bureaucrats 1.5 26.8 38.6 Intellectuals 2.9 33.8 31.6 Non-manual employees 4.1 11.8 12.3 Manual Workers 16.4 17.3 8.8 Farmers 75.0 10.2 8.8 Total 99.9 99.9 100.1
Source: Column 1: State Statistical Bureau PRC. 1988,
Statistical Yearbook of China 1987, Hong Kong: Longman. Column 2: based on the author's survey.
million population in this county were workers and farmers (Fei, 1978). The data in Table 4.3 are from a survey
conducted by the author, concerning the distribution of
college and graduate education among different social groups (see Appendix). The table shows that the majority of
university students are from bureaucrats and intellectuals families. While bureaucrats and intellectuals only account for less than 5 percent of total employed population, their children make up 60.6percent of total college students and
70.2 percent of total graduate students. Manual workers and
farmers account for 91.4 percent of total employed population, their children only represent 27.5 percent of total
undergraduate students and 17.6 percent of total graduate students.
Other socialist countries
Data on education systems in other socialist countries are very scarce. However, from the limited data available, we can find the same kind of unequal distribution of education. According to Flakierski (1986), for example, in 1970s, the top 10 percent of per capita income households in Hungary received four times more university education than the bottom 10
percent. The children of the managerial and intellectual group received eight times more university education than the children of unskilled workers.
From the above analysis, we may conclude that in
socialist countries, education is not equally distributed. First, because of the low wage and low living standard, for many families in the low social strata, going to school is
still considered to be a burden, instead of a free
opportunity. Second, in terms of distribution of education, there are serious disparities between rural and urban
population and between different occupations. We are not able to make an accurate estimate of size distribution of
educational benefits from data available; however, we can be sure to conclude that the distribution of education is not more equal than the wage distribution.
Chapter 5 Health Care
Perhaps the inequality in health services is the most difficult item to estimate. There is virtually no statistical data available on how the health fund is distributed among population. However, many phenomenon in socialist medical system suggest that there is a very serious unequal
distribution. First hand observations also confirm that the disparities in the access to medical care among different social groups are significant.
In the USSR, in theory there is a unified medical system planned and managed by the Ministry of Health. In reality, several subsystems provide medical care of differing quality to a variety of population groups (Davis 1988). There are six types of legal subsystems of medical care: elite,
departmental, capital city, industrial, provincial city, and rural. This total medical structure corresponds to the
hierarchical social structure. Table 5.1 shows the number of population each of the six subsystems serves. The elite
subsystem is specifically set up to serve the Soviet party and government elites and their families. This subsystem has the highest quality of medicines and equipments and is staffed by the best medical personnel in the USSR. The departmental
Table 5.1 Distribution of Soviet Population Among Six Subsystems of Medical Care in 1975
Number of
Medical Population Percent
Subsystem (Millions) of Total
Elite 1.0 0.4% Departmental 12.7 5.0 Capital city 49.1 19.4 Industrial 20.2 8.0 Provincial city 40.9 16.1 Rural district 129.4 51.1 Total 253.3 100.0
Source: Davis, Christopher M., 1988, "The Organization and Performance of the Contemporary Soviet Health Service," in G. W. Lapidus & G. E. Swanson, State and Welfare
USA/USSR, pp. 95-142.
subsystem serves people affiliated with the controlling
organizations, such as the Ministry of Defence, the secrete police (KGB), the Ministry of Foreign Affairs, and are closed to the public. The level of medical care is higher than the other four public subsystems because the economic and
political power of the controlling organizations ensure better access to available resources. (Davis, 1988, p. 118).
According to Davis, most Soviet citizens receive their medical care in one of the other four subsystems, among which the capital city system is the best. The capital city system are managed by the main administration of public health in capital cities of the Soviet republics, where "institutions are specialized, the quality of the staff is relatively high,
modern equipment and medicines are available, and the urban transportation network facilities home care and emergency aid"
(Davis, 1988, p. 119). The industrial subsystem and the
provincial city subsystem are not as good as the capital city system. They are characterized by low level of specialized hospitals, low quality of personnel, and resource constraints are tighter. Nevertheless, compared to the rural health
subsystem, they are still high in quality. The rural health subsystem is the worst, where the medical care "is still years behind that in the cities" (Davis, 1988, p. 119). This
subsystem is marked by serious shortages of medical personnel, basic medicines and equipments; poorly developed
transportation and public sanitation, and lack of supplemental funding. over a half of total Soviet population receive their medical services from this rural health subsystem.
In general, in 1975 about 25 percent of the Soviet population had access to medical care of a relatively high
standard; another 24 percent obtained decent services in
industrial or provincial city subsystems; 51 percent have only low-quality medical services. Moreover, as Davis found, even within one same system, the accesses to medical care are not
equal.
We are not able to find more specific data on
inequalities in the distribution of medical care. From the above analysis, however, we can at least be safe to conclude that the access to medical services is very unequal among