MITLIBRARIES
3
9080
02618
4587
*
I
\*
LIBRAaiBS
Digitized
by
the
Internet
Archive
in
2011
with
funding
from
Boston
Library
Consortium
IVIember
Libraries
HB31
.M415
Massachusetts
Institute
of
Technology
Department
of
Economics
Working
Paper
Series
DOES
HAZARDOUS
WASTE
MATTER?
EVIDENCE
FROM
THE
HOUSING MARKET
AND
THE
SUPERFUND
PROGRAM
Michael
Greenstone
Justin
Gallagher
Working
Paper
05-27
October
31,
2005
Room
E52-251
50
Memorial
Drive
Cambridge,
MA
021
42
This
paper can
be
downloaded
without
charge
from
the
Social
Science Research
Network Paper
Collection at
MASSACHUSETTS
INSTITUTEOF
TECHNOLOGY
NOV
1 i\ ZUllbDoes
Hazardous Waste
Matter?
Evidence
from
theHousing
Market and
theSuperfund
Program*
Michael
Greenstone
and
JustinGallagher
October
2005
*
We
thankDaron Acemoglu, David
Autor,Maureen
Cropper, Esther Duflo,Dick
Eckhaus, Alex Farreli,Don
Fullerton,Ted
Gayer, Jon Gruber, Jon Guryan, Joe Gyourko, Paul Joskow,Matthew
Kahn.David
Lee,Jim
Poterba, Katherine Probst, Bernard Saianie, Randall Walsh,Rob
Williams, and especiallyTed
Gayer
for insightfulcomments.
The
paperalso benefited from thecomments
of seminarparticipants atASSA,
BYU,
UC-Berkeley,UC-Davis. UC-Santa
Barbara,CEMFI,
Colorado, Columbia,HEC
Montreal.Kentucky,
LSE,
MIT,
NBER,
Rand, Resources for the Future, SITE, Stanford, Syracuse, Texas, andUCLA.
Leila Agha, Brian Goodness, ElizabethGreenwood,
Rose
Kontak, William Li, and JonathanUrsprung
providedoutstanding research assistance.We
especiallythankKatherineProbst forgenerouslysharing dataon the costs ofSuperfund clean-ups. Funding from the Center for Integrating Statistical and
Environmental Scienceatthe UniversityofChicago andtheCenterfor
Energy
and Environmental PolicyDoes
Hazardous
Waste
Matter?
Evidence
from
theHousing
Market
and
theSuperfund
Program
Abstract
Approximately $30
billion(2000$) has been spent on Superfundclean-ups of hazardous wastesites, andremediation efforts are incomplete at roughly halfofthe 1,500 Superfundsites. This study estimates the
effectof Superfund clean-ups on local housingprice appreciation.
We
compare
housing pricegrowth intheareas surroundingthe first
400
hazardous waste sitesto becleanedup
throughthe Superfiindprogram
to the areas surrounding the
290
sites that narrowly missed qualifying for these clean-ups.We
cannotrejectthat the clean-ups had no effecton local housing price growth, nearly
two
decades afterthese sitesbecame
eligible for them. This finding is robust to a series of specification checks, including theapplication ofa quasi-experimental regression discontinuity design based on
knowledge
ofthe selectionrule. Overall, the preferred estimates suggest that the benefits of Superfund clean-ups as
measured
through the housing market are substantially lowerthan the $43 million
mean
cost ofSuperfundclean-ups.
Michael Greenstone Justin Gallagher
MIT,
Department
ofEconomics
Department
ofEconomics
50
Memorial
Drive,E52-359
549
Evans
Hall,MC
3880
Cambridge,
MA
02142-1347
UC
Berkeleyand
NBER
' Berkeley,CA
94720-3880
Introduction
The
estimation of individuals' valuations of environmental amenities with revealed preferencemethods
has been an active area ofresearch formore
than three decades.Numerous
theoreticalmodels
outlining revealed preference
methods
to recover economically welldefmed
measures ofwillingness topay have been developed. In principle, these
methods
can be used in a variety ofsettings, includinghousingmarkets, recreational choices, health outcomes, andthe
consumption
ofgoods designedtoprotectindividuals against adverse environmentally-induced outcomes.'
The
application of these approaches,however, is often
accompanied
by seemingly valid concerns about misspecification thatundermine
thecredibility ofany findings. Consequently,
many
are skeptical that markets can be used to determineindividuals" valuation of environmental amenities. Further, the increasing reliance on stated preference
techniques to value enviromnental amenities is surely related to dissatisfaction with the performance of
revealed preference techniques.^
Hazardous
wastesites are anexample
of an environmental disamenity that provokes greatpublicconcern.
The
1980Comprehensive
Environmental Response, Compensation, and Liability Act,which
became
known
as Superfund, aims to address this concern.The
Act gave theEPA
the right to initiateremedial clean-ups at sites
where
a release or significant threat ofa release ofa hazardous substanceposes an
imminent
andsubstantial dangertopublic welfare andtheenvironment. Sincethepassage oftheSuperfund legislation,
more
than 1,500 sites have been placed on the National Priorities List (NPL),qualifyingthose sites forfederally financedremediation.
As
of 2000, approximately$30
billion (2000$)has been spent on clean-ups,
and
remediation efforts are incomplete atroughly halfofthesites. Despitethese past and future expenditures, there has not been a systematic accounting of the benefits of
Superfund clean-ups of hazardous wastesites.
As
aresult,Superfundis a controversialprogram.^This paper estimates the effect ofSuperfund sponsored clean-ups of hazardous waste sites on
SeeFreeman(2003) and
Champ,
Boyle,andBrown
(2003)forreviews."See
Hanemann
(1994))andDiamond
andHausman
(1994)fordiscussionsofstatedpreference techniques.
^ In March 1995 in Congressional testimony, Katharine Probst ofResources for the Future said, "Although the
program hasbeenin existenceforover 14years,
we
stillknow
very littleaboutthebenefitsofsite cleanuporabouttheassociated costs." Atthesame hearing,JohnShanahan oftheHeritageFoundationsaid,"Superfund...iswidely regardedas a wastetlilandineffectiveprogram indireneedofsubstantive reform."
housingprice appreciation in areassurrounding the sites.
The
empirical challenge isthatthe evolution ofhousing prices proximate to the Superfund sites in the absence of the clean-ups is
unknown.
The
development ofa valid counterfactual is likely to be especially challenging, because thesites assigned to
the
NPL
are themost
polluted ones in the US. Thus, itseems
reasonable toassume
that prices in theseareas are determined by a different process than prices in the remainder of the country for reasons
unrelatedtothe clean-ups. For example,
what
would
havehappened
to housingpricesinLove
Canal,NY,
intheabsenceofthe
famous
clean-upthere?To
solve this problem,we
implement
a quasi-experiment basedon knowledge
ofthe selectionrule thatthe
EPA
usedto developthefirstNPL.
Nearly 15,000 siteswere
referredtotheEPA
aspotentialNPL
sites in 1980-1, but theEPA's
budget could onlyaccommodate
400
clean-ups. Consequently, theyinitially
winnowed
the list to the690
worst sites and then developed theHazardous
Ranking
System
(HRS).
The
HRS
was
used to assign each sitea scorefrom to 100 based on the risk itposed, with 100being the
most
dangerous.The
EPA
placedthe400
sites withHRS
scores exceeding28.5on
the initialNPL
in 1983,making them
eligible for Superfund remedialclean-ups.Our
empirical strategy exploits this selection process by focusing on the areas surrounding the690 hazardous waste sitesthat
were
finalists forthe initialNPL.
We
compare
theevolutionofresidentialproperty values inthe areasnearsitesthat had initial
HRS
scores exceeding28.5 totheareasproximatetosites that had
HRS
scoresbelow
the 28.5 threshold.The
assumption is that the evolution of housingprices in the areas surrounding the sites with scores
below
28.5 form a valid counterfactual for priceappreciation in areas near sites with
HRS
scores above the threshold.We
alsoimplement
aquasi-experimental regression discontinuitydesign
(Cook
andCampbell
1979) to focus the comparisons inthe"neighborhood" ofthecut-off
The
implementation of thisHRS
based research design suggests that the placement of ahazardous wastesite on the
NPL
is associated witheconomically small andstatistically indistinguishablefrom zero gains in residential property values. Thisfindingholdswhetherthe growth in housing prices is
measured
7 or 17 years after the sites' placement on theNP.
Moreover, it is robust to a variety' ofspecification checks, including the regression discontinuity approach.
The
validity of these results isfurther supported by the finding that observable ex-ante determinants ofhousing price appreciation are
well balanced
among
census tracts containing sites withHRS
scoresabove
andbelow
28.5, especiallynear the cut-off Overall, these findings suggest that the
mean
benefits of a Superfund clean-up asmeasured
through the housing market are substantially lower than the $43 millionmean
cost of aSuperfundclean-up.
A
few
otherresults fromtheHRS
research design are noteworthy. There is little evidencethat asite's placement on the
NPL
causes an immediate decline in rental rates or housing prices,which
undermines the popular stigma hypothesis (e.g., Harris 1999). Additionally,
we
cannot reject that theclean-ups fail to cause changes in the fractions of minorities, children or other
demographic
characteristics ofthe population inthe areassurroundingthe sites."* Finally, there is
modest
evidencethattheclean-ups are associated with population increasesinthecensustracts containing thesites.
The
conventional hedonic approach uses ordinary least squares to estimate the effect ofa site'splacement on the
NPL
on
housing price appreciation.The
basis ofthis approach is a comparison oftheareas surrounding
NPL
sites with the remainder oftheUS.
In contrastto theHRS
research design, theconventional approach produces estimates that suggest that gains in property values exceed the
mean
costs ofclean-up.
However,
these regressions also produce anumber
ofpuzzling resultsthatundennine
confidence in the approach's validity. Further, the ex-ante determinants ofchanges in housing prices
differdramatically
between
areassurroundingNPL
sitesandthe restofthe country.These
latterfindingsunderscore the importance of the
HRS
research design as a potential solution to the misspecificationproblems that have plagued the conventional implementation ofthe hedonic approach in other settings
and appearto
undermine
ithere.In addition to the availability ofthe
HRS
research design, this study hastwo
other appealingfeatures. Firsttoconductthestudy,
we
assembledthemost
comprehensivedatafile ever compiled bytheEPA
or other researchers on the Superfundprogram
and its effects.The
resulting database hasSee Banzhafand Walsh (2005) and Cameron and
McConnaha
(2005) for evidence of migration induced byinformationon all Superfund hazardous wastesites,the sitesthat narrowly missed placement
on
the initialNPL,
and census-tractlevel housingprices for 1980, 1990, and 2000.The
data filealso contains awealthof information aboutthehazardous wastesites,includingtheirprecise location,
HRS
scores, expectedandactual
(when
remediation is complete) costs ofclean-up, size in acres, and dates they achieved variousmilestones (including completion of remediation). Consequently, this study is a substantial departure
from
the previous Superfund/hazardous waste site hedonic literature,which
is entirely comprised ofexaminations ofa singlesite orhandful ofthem.^
Second,
we
utilize consumers' reveled preferences andassume
thatthey transmittheirvaluationsofthe clean-upsthrough the housing market. Ifthe housing market isoperating correctly, pricechanges
will capture the healthand aestheticbenefits ofclean-ups. Further, hedonic theory can be used to relate
theresults tothetheoreticallycorrect welfare
measure
ofwillingness to pay. Thus,thisapproach freesusfrom a relying
on
state preference techniques or the notoriously poor laboratory estimates of risk tohuman
health associated with the thousands of chemicals present at the sites and assumptions aboutthecorrect valueofastatistical life.*
The
paper proceeds as follows. Section I provides background on the Superfimdprogram
andhow
its initial implementation provides a research design thatmay
allow for credible estimation oftheeffects ofSuperfundclean-ups
on
priceappreciation. SectionII reviewsthe hedonicmethod
theoreticallyand empirically and uses it to provide an
economic
interpretation for the results from theHRS
researchdesign. Section III details the data sources and provides
some
summary
statistics. SectionsIV
andV
reports onthe econometric
methods
andempirical findings, respectively. Section VI interprets theresultsanddiscussesthepolicy implications, while VII concludes.
I.
The
Superfund
Program
and
aNew
Research Design
'
A
partiallistofprevious Superfund/hazardous wastesitehedonicstudiesincludesSchmalenseeetal.(1975), Smith and Michael (1990), Kohlhase (1991), Kiel (1995), Gayer Hamilton, and Viscusi (2000, 2002), Kiel and Zabel
(2001),McCluskey and Rausser(2003), Ihlanfeldtand Taylor(2004),Messeretal.(2004),and Farrell(2004).
'Viscusiand Hamilton (1999)
use
EPA
providedestimates ofthe probabilityofcancer cases atasubsample ofsitesand find that at themedian site expenditure the average cost per cancer case averted by the clean-up exceeds S6
A. Histoiy
and
Broad
Progi-amGoalsBefore the regulation ofthe disposal of hazardous wastes by the Toxic Substances Control and
Resource
Conservation andRecovery
Acts of 1976, industrial firms frequently disposed of wastes byburying
them
in the ground.Love
Canal,NY
is perhaps themost
infamousexample
ofthese disposalpractices.
Throughout
the 1940s and 1950s, this areawas
a landfill for industrial waste andmore
than21,000 tons ofchemical wastes
were
ultimately depositedthere.The
landfill closed in the early 1950sand overthe next
two
decades acommunity
developed in that area. Inthe 1970s,Love
Canal residentsbegan
tocomplain of high rates ofhealth problems, such as cancer, birth defects, miscarriages, and skinailments. After
New
York
state investigators found high concentrations of dangerous chemicals in theair
and
soil, concerns about the safety of this areaprompted
President Carter to declare a state ofemergency
that led to therelocation ofthe900
residents ofthis area.The Love
Canal incidenthelpedtogalvanize support for addressing the legacy of industrial waste and this led to the creation of the
Superfund
program
in 1980.The
centerpiece ofthe Superfund program, andthispaper's focus, isthe long-run remediation ofhazardous waste sites.^
These
multi-year remediation effortsaim
to reducepermanently the serious, butnot imminently life-threatening, dangers caused by hazardous substances.
As
of 2000, roughly 1,500sites
have
been placedon theNPL
andthereby chosen forthese long-run clean-ups.The
nextsubsectiondescribes the selection process,
which
formsthebasisof ourresearch design.B. SiteAssessment
&
SuperfundClean-Ups
ProcessesAs
of 1996,more
than 40,000 hazardous waste sites had been referred to theEPA
for possibleinclusion on the
NPL.
The
EPA
follows a multi-step process to determinewhich
ofthese sites posethegreatest danger to
humans
and the environment.The
assessment process involves determiningwhich
'
EPA
(2000)claimsthat56%
ofthe childrenbom
inLoveCanal between 1974 and 1978 hadbirthdefects.The Superfund program also funds immediate removals. These clean-ups are responses to environmental emergencies and are generally short-term actions aimed at diminishing an immediate threat. Examples ofsuch
actions including cleaningup wastespilledfromcontainers and constructing fencesaround dangeroussites. These
actions are not intended to remediatethe underlying environmental problem and accountfor a small proportion of Superfundactivities. Importantly, they areadministeredathazardous wastesitesthatareandarenotonthe
NPL.
hazardous chemicals arepresentatthesiteandthe overall risk level.
The
final step ofthe assessment process is the application of theHazardous
Ranking
System
(HRS), which
is reserved for themost
dangerous sites.The
EPA
developed theHRS
in 1982 as astandardized approach to quantify
and
compare
thehuman
health and environmental riskamong
sitestoidentify the ones that pose the greatest threat.
The
originalHRS
evaluated the risk for exposure tochemical pollutants alongthreemigration 'pathways'; groundwater, surface water, and air.'
The
toxicityand concentration ofchemicals, the likelihoodof exposure and proximity to
humans,
andthe populationthatcould be affected are themajor determinants ofriskalong eachpathway.
The non-human
impactthatchemicals
may
have is considered during the process ofevaluating the site but plays aminor
role indeterminingthe
HRS
score.The
HRS
produces a score for each site that ranges from to 100, with 100 being the highestlevel ofrisk.
From
1982-1995,theEPA
assigned all hazardous waste sites with aHRS
score of28.5 orgreaterto theNPL.'"
These
sitesarethe onlyonesthatare eligible forSuperfund remedialclean-up.The
Data
Appendix
provides furtherdetails onthedeterminationofHRS
test scores.Once
a site is placedon
theNPL,
itgenerally takesmany
years until clean-up is complete.The
first step is a further study ofthe extentofthe environmental
problem
and
how
best toremedy
it. Thisassessment is
summarized
intheRecord
of Decision(ROD), which
also outlinesthe clean-up actionsthatare planned for the site.
The
site receives the "construction complete" designation once the physicalconstructionofall clean-upremedies iscomplete,theimmediate threats tohealthhave been removed, and
thelong-run threatsare"undercontrol."
The
final stepisthesite's deletion fromtheNPL.
'In
1990,the
EPA
revised theHRS
testsothatitalsoconsiderssoilasanadditionalpathway.'°
In 1980 every statereceived the right to placeone site onthe
NPL
withoutthe sitehaving toscore at orabove28.5 on the
HRS
test. As of 2003, 38 states have used theirexception. It isunknown
whether these sites wouldhavereceived a
HRS
scoreabove28.5.In 1995 thecriteriafor placement on the
NPL
were altered sothat asite musthave aHRS
score greater than 28.5and thegovernor ofthestate inwhichthesite islocatedmust approvetheplacement. Therearecurrentlyanumber
ofpotential
NPL
siteswithHRS
scores greaterthan 28.5 that have not been proposed forNPL
placementdue toknown
state political opposition.We
do notknow
the precise number of these sites because our Freedom ofC.
1982
HRS
Scoresas theBasisof
aNew
ResearchDesign
This paper's goal is to obtain reliableestimates ofthe effectofSuperfund sponsoredclean-upsof
hazardous waste sites on housing price appreciation in areas surrounding the sites.
The
empiricalchallenge isthat
NPL
sites are themost
polluted intheUS,
so the evolution of housing prices near thesesites
may
not becomparable
to that of the remainder of theUS,
even conditional on observablecovariates.
To
avoid confounding the effects oftheclean-ups with unobserved variables, it is necessaryto develop a valid counterfactual for the evolutionofproperty valuesat Superfundsites in theabsenceof
thosesites' placement on the
NPL
andeventual clean-up.A
featureoftheinitialNPL
assignmentprocess thathas notbeen notedpreviously byresearchersmay
provide a credible solution to the likely omitted variables problem. In the first year after thelegislation's passage in 1980, 14,697 sites
were
referred to theEPA
and investigated as potentialcandidates forremedial action.
Through
the assessment process, theEPA
winnowed
this listto the690
most
dangerous sites.Although
the Superfund legislation directed theEPA
to develop aNPL
of "atleasf
400
sites(Section 105(8)(B) ofCERCLA),
budgetary considerations caused theEPA
to set a goalofplacing exactly
400
sitesontheNPL.
The
EPA
developed theHRS
to determine scientifically the400
out ofthe 690 sites that posedthe greatestrisk. Pressured to initiatethe clean-ups quickly,the
EPA
developedtheHRS
in aboutayear.The
HRS
testwas
appliedtothe690
worst sites, andtheirscoreswere
ordered fromhighesttolowest.A
scoreof28.5 divided
numbers 400
and401, so the initialNPL
published inSeptember
1983was
limitedtosites with
HRS
scores exceeding28.5."The
central roleoftheHRS
scoreprovides acompelling basis fora research designthatcompares
outcomes
atsites with initial scoresabove
andbelow
the28.5 cut-offforat leastthreereasons. First, it isunlikelythat sites'
HRS
scoreswere
manipulated toaffect their placementon theNPL,
becausethe 28.5threshold
was
established after the testing ofthe690
siteswas
completed.The
HRS
scores therefore" Exactly 400 ofthe sites on the initial
NPL
hadHRS
scores exceeding 28.5. The original Superfund legislationgave each statethe right to placeone siteon the
NPL
without going through the usual evaluation process. Sixofthese"state priority sites"wereincludedontheoriginal
NPL
released in 1983. Thus, the original listcontainedthereflected the
EPA's
assessment ofthehuman
health and environmental risks posed by each siteand were
notbasedontheexpected costsor benefitsofclean-up.
Second,the
HRS
scores werenoisy measures ofrisk,so it ispossiblethat true riskswere
similarabove and
below
the threshold. This noisinesswas
a consequence ofthe scientific uncertainty aboutthehealth consequences of exposure to the tens of thousands of chemicals present at these sites.'" Further,
the threshold
was
not selected basedon
evidence thatHRS
scoresbelow
28.5 sites posed little risk tohealth. In fact,theFederal Registerspecifically reportedthatthe
"EPA
has notmade
a determinationthatsites scoring less than 28.50 do not present a significant risk to
human
health, welfare, or theenvironment"(FederalRegister 1984, Section IV)
and
thatamore
informativetestwould
require "greatertimeand funds"
(EPA
1982).'^Third, the selection rule that determinedthe placement
on
theNPL
isa highly nonlinear functionofthe
HRS
score. Thisnaturally lends itselfto acomparison ofoutcomes
at sites "near" the 28.5 cut-offIfthe unobservables are similar around the regulatory threshold, then a comparison ofthese sites will
control for all omitted factors correlated with the outcomes. This test has the features of a
quasi-experimentalregression-discontinuity design
(Cook
andCampbell
1979).'''An
additional feature ofthe analysis is that an initial score above 28.5 is highly correlated witheventual
NPL
status butis not a perfect predictorofit. Thisis becausesome
siteswere
rescored,withthe'"
A
recent
summary
ofSuperfund'shistorymakesthispoint. "AttheinceptionofEPA's Superfund program,therewas
much
to be learnedabout industrial wastesandtheir potential forcausingpublic health problems. Beforethisproblem could be addressed on the program level, the types of wastes most often found at sites needed to be
determined, andtheirhealtheffects studied. Identifyingand quantiiyingriskstohealthandtheenvironmentforthe
extremelybroad range ofconditions,chemicals,andthreatsatuncontrolledhazardous wastessitesposed formidable
problems.
Many
ofthese problems stemmed from the lack ofinformation concerning the toxicities ofthe over 65,000 different industrial chemicals listedas having been in commercial production since 1945" (EP.A 2000, p. 3-2).'^
One way
tomeasurethecnidenatureoftheinitialHRS
test isbythedetailoftheguidelinesusedfordeterminingthe
HRS
score. TheguidelinesusedtodeveloptheinitialHRS
siteswerecollectedina30 page manual. Today,theanalogousmanual ismorethan500pages.
'''
The research design ofcomparing sites with
HRS
scores "near" the 28.5 is unlikely to be valid for sites thatreceived an initial
HRS
score after 1982. This is because once the 28.5 cut-offwas set, theHRS
testers wereencouraged to minimize testingcosts and simply determine whether asite exceeded the threshold. Consequently,
testers generally stop scoring pathways once enough pathways are scoredto produce a score above thethreshold.
When
only someofthepathways are scored,thefullHRS
scoreisunknown
andthequasi-experimental regression discontinuitydesign isinappropriate.laterscoresdetermining whetherthey
ended
up onthe NPL.'^The
subsequentanalysis uses an indicatorvariable forwhetherasite's initial (i.e., 1982)
HRS
scorewas
above28.5 asan instrumental variable forwhetherasite
was
ontheNPL
into purgethepotentiallyendogenous
variation inNPL
status.Finally, it importantto
emphasize
that sites that failed to qualify for theNPL
were
ineligible forSuperfund remediations.
We
investigated whether these siteswere
cleaned-up under state or localprograms and foundthatthey
were
frequentlyleft untouched.Among
thesitesthatwere
targetedby theseprograms, atypical solution
was
to put a fence around thesite and place signs indicating thepresence ofhealth hazards.
The
point is thatthe remediation activities atNPL
sites drastically exceededtheclean-upactivitiesat
non-NPL
sitesbothinscopeandcost.-y' ' '
..
11.
The Hedonic
Method
and
How
ItCan
Be Used
toInterprettheHRS
Research Design
ResultsA. The
Hedonic
Method and
ItsEconometric
IdentificationProblems
An
explicit market for a clean local environment does not exist.The
hedonic pricemethod
iscommonly
used to estimate theeconomic
value of non-market amenities like environmental quality toindividuals. It is based on the insight thatthe utility associated with the
consumption
ofa differentiatedproduct, such as housing, is determined by the utility associated with the good's characteristics. For
example, hedonic theory predicts thatan
economic
bad, such as proximity toahazardous waste site, willbe negatively correlated with housing prices, holding all other characteristics constant. This section
reviews the hedonic
method
and describes the econometric identification problems associated with itsimplementation.
Economists have estimated the association
between
housing prices and environmental amenitiesat least since Ridker (1967) and Ridker and
Henning
(1967).However, Rosen
(1974) andFreeman
(1974)
were
the first to give this correlation aneconomic
interpretation. In theRosen
formulation, adifferentiated
good
can bedescribedby a vectorofitscharacteristics,Q
=
(qi, q^,..., qn)- Inthecase ofa'^
As
an example, 144 sites with initial scoresabove 28.5 were rescored and this led to 7 sites receiving revised scores belowthecut-off. Further,complaints by citizensandothers led torescoring ata numberofsites below the cut-off. Althoughthere hasbeensubstantialresearch onthequestionofwhichsitesontheNPL
arecleaned-upfirst (see, e.g.,Sigman2001),we
areunawareofanyresearchonthedeterminantsofasitebeingrescored.house, these characteristics
may
include structural attributes (e.g.,number
ofbedrooms), neighborhoodpublic services (e.g., local school quality), and local environmental amenities (e.g., distance from a
hazardous wastesite). Thus,the price ofthei"' house can be written as:
(1) Pi
=
P(q,,q2,...,q„).The
partial derivative ofP(») with respect tothe n"' characteristic, d?/dq„, is referredto as the marginalimplicit price. Itisthemarginalprice ofthe n"'characteristic implicitin the overall priceofthehouse.
In a competitive market, the locus
between
housing pricesand
a characteristic, or the hedonicpriceschedule(HPS), isdetermined by the equilibrium interactionsof
consumers
andproducers.'* Inthehedonicmodel, the
HPS
isformed
by
tangenciesbetween
consumers' bidand suppliers' offerfunctions.The
gradient ofthe implicit price function with respect to the health risk associated with proximity tohazardous waste sites gives the equilibrium differential that compensates individuals for accepting the
increased healthrisk. Put another
way,
areas withelevated healthrisksmust
have lower housingprices toattract potential
homeowners
andtheHPS
reveals the price that allocates individualsacross locations. Inprinciple, the price differential associated with proximity to hazardous waste sites reflects both
individuals' valuations ofthegreater health riskand anyeffecton neighborhoodaesthetics.'^
At
each point on theHPS,
the marginal price of a housing characteristic is equal to anindividual's marginal willingness to pay
(MWTP)
for that characteristic and an individual supplier'smarginal cost ofproducing it. Sincethe
HPS
reveals theMWTP
at agiven point, itcan be usedto inferthe welfare effects ofa marginal
change
in a characteristic.The
overall slope oftheHPS
provides anestimate ofthe average
MWTP
across all consumers. In principle,the hedonicmethod
can also be usedto recover individuals'
demand
orMWTP
functions,which would
beoftremendous
practical importancebecausethese functionsallow forthe calculationofthewelfareeffectsofnonmarginal changes.'*
Our
focus is limited to the successful estimation ofequation (1),which
is the foundation for"^ SeeRosen
( 1974),Freeman(1993), and Palmquist( 1991)for details.
"
Thehedonic approach cannot accountforaestheticbenefitsthataccruetononresidents that, forexample,engageinrecreationalactivitiesnear thesite. Thehealtheffectsapproachhasthissamelimitation.
'* Rosen
(1974) proposed a 2-step approach for estimating the
MWTP
function, as well as the supply curve. Inrecentwork, Ekeland,
Heckman
and Nesheim(2004)outline theassumptions necessaryto identifythedemand(andwelfarecalculations of both marginal
and
non-marginal changes. Consistent estimationmay
be difficultsinceit islikelythatthereareunobserved factors thatcovary with both proximity tohazardous wastesites
and housing prices.
Although
this possibility cannot be directly tested, it is notable that proximity to ahazardous waste site is associated with a
number
ofimportant observable predictors of housing prices.For
example
compared
to the rest ofthe country, areas with hazardous waste sites nearby tend to havelower population densitiesand mobile
homes
comprisea higher proportionofthe housingstock.Consequently, cross-sectional estimates ofthe association
between
housing prices and proximityto a hazardous waste site
may
be severely biased due to omitted variables.'^In fact, the cross-sectional
estimation ofthe
HPS
has exhibited signs ofmisspecification in anumber
ofothersettings, including therelationships
between
land prices and school quality, totalsuspended
particulates air pollution, andclimate variables (Black 1999;
Deschenes
and Greenstone 2004;Chay
and Greenstone 2005)."" Small(1975) recognizedthe consequences ofthemisspecificationof equation(1) just one yearafterpublication
ofthe
Rosen
andFreeman
papers:I have entirely avoided...the important question ofwhether the empirical difficulties, especially correlation
between
pollution andunmeasured neighborhood
characteristics,areso
overwhelming
as to render theentiremethod
useless. Ihope
that...futurework
canproceed to solving these practical problems....
The
degree of attention devoted to this[problem]...is
what
will reallydetermine whetherthemethod
stands orfalls..." [p. 107].Rosen
himself recognized the problemand
expressed skepticism that the hedonicmethod
could beimplemented
successfully in a cross-sectional setting."' Yet, in the intervening years, thisproblem
ofmisspecification has received little attention from empirical researchers.
One
ofthis paper's aims is todemonstratethatit
may
be possibletoobtainreliablehedonicestimates witha credibleresearch design.B.
Using
Hedonic
TheorytoInterpret theResultsfrom
the1982
HRS
Research Design
"
Incorrect choice offunctional form is an alternative source ofmisspecification ofthe HPS. See HalvorsenandPoilakowski (1981) and Cropperetal.(1988)fordiscussionsofthis issue.
"°
Similarproblemsarise
when
estimatingcompensatingwagedifferentialsforjobcharacteristics, suchastheriskofinjuryor death. Theregression-adjusted associationbetweenwagesand
many
job amenitiesisweak
and oftenhas a counterintuitive sign(Smith 1979; Black and Kneisner2003).^' Rosen
(1986) wrote, "Itis clearthat nothing can be learnedaboutthe structure ofpreferences in asingle cross-section..."(p. 658),and
"On
theempirical sideofthese questions, the greatestpotential forfiirther progress rests indevelopingmoresuitablesourcesofdataonthe natureofselectionand matching..."(p.
The
hedonicmodel
describes amarket in equilibrium and ismost
readily conceivedofin across-sectional setting.
However,
our research design assesses the effect of Superfund remediations ofhazardous waste sites nearly
two
decades after the release oftheNPL.
Consequently, this subsectiondiscusses the interpretationoftheestimableparameters fromthe
HRS
research design.^^To
fix thoughts, defineR
as the monetary value ofthe stream ofservices provided by a houseoveraperiod oftime, ortherental rate.
We
assume
R
is a functionof an index ofindividuals' disutilityassociated with living near a hazardous waste site.
The
index is denoted asH
and is a function oftheexpected health risks and any aesthetic disamenities.
dRI
dH
<
0, because, for example, individuals'willingnesstopayto rentahouse is decreasinginthe health riskassociatedwithresiding in it.
Now,
considerhow
H
changesforindividualsthat live near ahazardous wastesite placedon
theinitial
NPL
asthesiteprogressesthroughthedifferentstagesofthe Superfundprocess:(2)
Ho =
Index Before SuperfundProgram
Initiated(e.g., 1980)Hi
=
Index AfterSitePlacedon theNPL
H2
=
IndexOnce
ROD
Published/Clean-Upis InitiatedH3
=
IndexOnce
"ConstructionComplete"
orDeletedfrom
NPL.
Notably, the clean-up process is slow. For example, the
median
timebetween
NPL
listingand
achievement oftheconstructioncompletemilestone is
more
than 12years.It
seems
reasonabletopresume
thatHo
>
H:, sothatR(H3)
>
R(Ho), because clean-ups reducethehealth risks and likely increase the aesthetic value of proximityto the site. It is not evident
whether
Hiand H2 aregreaterthan, less than, orequal toHq. Itis frequentlyarguedthatthe
announcement
thata siteis eligible for Superfund remediation causes
H
to increase, because placement on theNPL
may
causeresidentsto revise
upwards
their expectationofthehealthrisk.^^""*
^"
An
alternative valuation approach is toplace amonetary value on any health improvements associated with thecleaning-up ofa hazardous waste site. This approach involves four non-trivial steps. Specifically, itentails the determinationof: thetoxicspresentateachsiteandthepathwayswheretheyarefound(e.g., air, soil,groundwater); the healthrisksassociatedwithtoxicandpathway pair(thisisespecially difficultbecausetherehave beenmorethan
65,000 chemicals inproductioninthe
US
sinceWorldWar
IIand duetotheinfeasibilityoftestingofhumans
duetovalid ethical concerns); knowledge about thesize oftheaffected population and their pathway-specific exposure
(see Hamilton and Viscusi 1999 on the associated challenges); and willingness to pay to avoid mortality' (Viscusi 1993; Ashenfelterand Greenstone 2004a, 2004b). In lightofthe substantial scientific, empirical, and data quality
concerns with eachofthesesteps,ourview isthatat presentthis approach isunlikelyto producecredibleestimates
ofthebenefitsofSuperfijnd clean-ups. Furtherby itsverynature, itcannotaccountforany aesthetic benefits.
"^ The
stigmahypothesis is arelated idea. Itstates thatevenafter remediation individuals will assume incorrectly
thatproperties near Superfundsites have anelevated health risk, relative to risk beliefsbefore itsplacementon the
We
cannow
writethe constantdollarmean
price of houses in the vicinity ofthe hazardous wastesites considered for placement on the initial
NPL.
We
begin with the price ofhouses withHRS
scoresexceeding28.5
(measured
aftertheNPL
listing):^3^p//«s>285
^^
l(H,
= H,)5'R(H,)+l(H, = H2)5'R(H2)+l(H, =
H3)5'R(H3).'=0
Inthis equation, the indicator variables 1() equal 1
when
the enclosed statement is true in periodtand 6is adiscount factorbasedon the rate of timepreference.
The
equation demonstrates thatupon
placement on theNPL,
P, ' reflects the expectedevolution ofH
throughouttheclean-upprocess. Further,it isevident that it varies withthestageofthe Superfund clean-up atthetime (i.e.,t) that it is observed. For
example, [P, '*"
| H,
=
H3]>
[P,^
I
H,
=
H|] because theyears ofrelativelylow
rental rates havepassed.
The
constant dollarmean
price ofhouses locatednear thehazardous wastesites withHRS
scoresbelow
28.5 is:^4^p///is<28.5
^
^
6'R(Ho).'=0
We
assume
thatH
isunchanged
forthe sites thatnarrowly missed being placed on theNPL
duetoHRS
scores
below
28.5. If this assumption is valid (if, for example, these sites are never cleaned up), thenP
, *" isidentical inall periods.It is
now
possible to define local residents'mean
willingness to pay forthe listingof an existinghazardous waste site
on
the initialNPL.
This quantity isthe difference between (3) and (4). It shouldbemeasured
immediately afterthe sites areplaced on theNPL
sothatmeasurement
isamong
afixed setofindividuals' bid functions. Further,thistimingofthe
measurement
will ensurethatitwill account fortheinfluence ofthe
NPL
lisfingon
the value of housing services in all potentially affected years. Formally,we
define the theoretically correctmeasure
ofwillingnessto pay(WTP)
as:NPL.
Thus,thereis apermanent negativeeffectonproperty values. Harris(1999) provides areviewofthestigmaliterature.
^^McCluskey
and Rausser (2003) and Messer,Schulze, Hackett,Cameron,andMcClelland (2004) provide evidence
thatpricesdecline immediatelyaftertheannouncementthatalocalsite hasbeenplacedonthe
NPL.
Theintuition isthatresidents
knew
thatproximitytothesitewasundesirable buthad underestimatedtherisks.'
(5)AwTP=[Pf^''"'^^ -Pf'*-''''=^^'|t
=
October 1983].A\vTP
must
bemeasured
in October 1983, because this is immediately subsequent to the releaseof
theinitial
NPL.
Notice,Awtp
depends on the time required to complete each stage of the clean-up, thediscountrate,andthe
change
inH
ateachstage. IfH|,H2 <
Ho, then the signofA\vtpisambiguous.Since data from 1983 are unavailable and our data
on
housing pricescome
from the decennialcensuses,
we
estimate:(6)A|5c,o„r2ooo=[Pr^'''' -
P
f'^""''1 1=
1990
or 2000].This is the
mean
difference in housing prices nearNPL
andnon-NPL
sitesmeasured
in either 1990 or2000.
The
differencebetween
(5)and
(6) isthat the latterismeasured
either7 or 17 years laterthan theformer.
This delay in measuringthedifference in housingprices is likely tocauses Ai990or2ooo to exceed
the preferred
measure
ofAwtp
fortwo
reasons. First,many
ofthelow
rental rate yearswhere
Ht=
H|have passed by 1990 and 2000. Second,
enough
time has elapsedbetween
NPL
listing and theobservation on prices so that individuals can sort in responseto the
NPL
listing and/or clean-up. Thus,efforts to estimate willingness to pay functions are unlikely to be convincing, leaving successful
estimation of the
HPS
as the empirical goal. Further, Superfund remediations intend to cause largechangesin environmental quality.
The
factthattheHPS
isweakly
greaterthaneach individual's relevantbid function
combined
withthe non-marginal nature ofthe clean-ups is another reasonthat Ai990or2ooo islikelytobe an overestimate of
Awtp-III.
Data Sources
and
Summary
StatisticsA.
Data
SourcesTo
implement
the analysis,we
constructed themost
comprehensive datafileevercompiled ontheSuperfiind program.
The
datafile contains detailed informationon all hazardous wastesitesplacedon
theNPL
by 2000, aswell asthe hazardous waste sites with 1982HRS
scoresbelow
28.5.We
alsocompiledhousing price, housing characteristic,
and
neighborhooddemographic
information for the areassurroundingthesesites.
These
datacome
from Geolytics'sNeighborhood
Change
Database,which
includes informationfromthe 1970, 1980, 1990, and
2000
Censuses. Importantly, the 1980data predate the publication ofthefirst
NPL
in 1983.We
use these data to form a panel of census tracts basedon 2000
census tractboundaries,
which
aredrawn
sothatthey include approximately 4,000 people in 2000.Census
tracts arethe smallest geographic unit that can be
matched
across the 1970-2000 Censuses.''We
restrict theanalysis to the 48,246 out ofthe 65,443
2000
census tracts that have non-missing housing price data in1980 (beforetheSuperfund legislation
was
passed), 1990,and 2000.We
spentconsiderableeffortcollecting precise locationdata(e.g.,longitudeand
latitude)foreachofthe
NPL
sites and hazardous waste sites with initialHRS
scoresbelow
28.5. This informationwas
usedto place thesesites in unique census tracts.
We
also usedGIS
softwareto identify thecensus tractsthat share a border with the tracts with the sites. Additionally,
we
create separate observations for theportion oftracts that fall within circles of varying radii (e.g., 1, 2, and 3 miles) around the sites.
The
subsequent analysis tests for price effects in all three ofthese groupings oftracts.
The
DataAppendix
providesfurther detailson
how we
definedthesegroups oftracts.The
1982HRS
composite scores are a crucialcomponent
ofthe analysis.We
collected thesescores forthe
690
hazardous waste sites considered forplacement on the initialNPL
from various issuesofthe FederalRegister.
We
also obtainedthegroundwater, surface water, and airpathway
scoresfrom
the
same
source.We
collected anumber
of other variables for theNPL
sites. Various issues of the FederalRegister
were
used to determine the dates ofNPL
listing.The
EPA
provided us with a data file thatreports the dates of release of the
ROD,
initiation of clean-up, completion of remediation (i.e.,construction complete), and deletion from the
NPL
for sites that achieved these milestones.We
alsocollected data on the expected costs of clean-up before remediation
was
initiatedand
estimates oftheactual costs for the sites that reached the construction complete stage."^ "^
We
obtained information on"^
SeetheDataAppendix foradescriptionof
how
1980 and 1990 censustracts wereadjusted tofit2000censustractboundaries.
The
EPA
dividessome
sites into separate operatingunitsand issues separateRODs
forthem.We
calculated the cost variables asthesum
acrossalloperating units. Further,we
reserved the constructioncompletedesignation forthe on the size (measured in acres) ofthe
NPL
hazardous waste sitesfrom
theRODs.
See the DataAppendix
formore
detailsonthese variables and oursources.B.
Summary
StatisticsThe
analysis is conducted withtwo
datasamples.We
refer tothe firstasthe "AllNPL
Sample,"and it includes the 1,398hazardous wastesites inthe 50
US
states andthe DistrictofColumbia
thatwere
placed on the
NPL
by January 1, 2000.The
second is labeled the"1982
HRS
Sample," and it iscomprised ofthehazardous wastesites tested forinclusion ontheinitial
NPL,
regardlessoftheireventualNPL
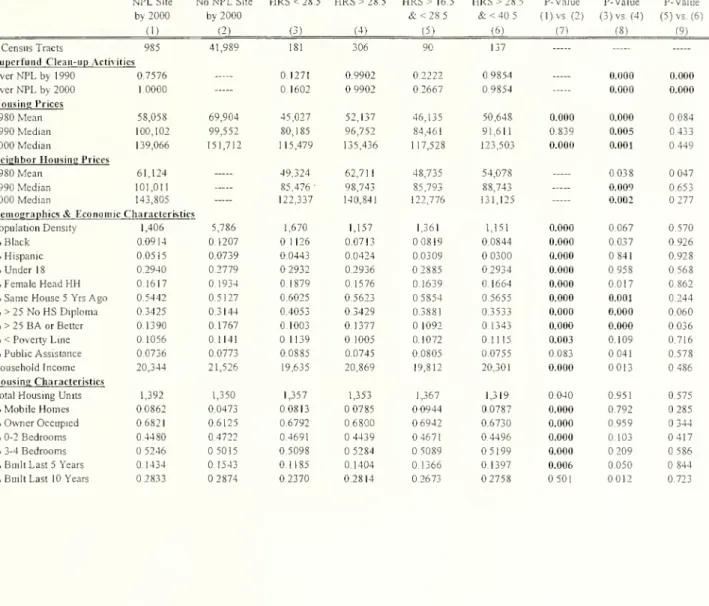
status.^*Table 1 presents
summary
statistics on the hazardous wastesitesin thesesamples.The
entries incolumn
(I) are fromthe AllNPL
Sample and
are limited to sites ina censustract forwhich
thereisnon-missing housingprice data in 1980, 1990, and 2000. After thesesample restrictions, there are 985 sites,
which
ismore
than70%
ofthe sites placed on theNPL
by 2000.Columns
(2) and(3) reportdatafrom
the 1982
HRS
Sample.The column
(2) entries are basedon the487
sitesthatwe
placedin acensus tractwith complete housingpricedata.
Column
(3) reports onthe remaining 189 sites locatedin census tractswith incomplete housingprice data (generally dueto missing 1980 data).
The
14 sites locatedoutside ofthecontinentalUnitedStates
were
dropped fromthe sample.Panel
A
reports onthetimingofthe sites' placementon theNPL.
Column
(1)revealsthat about75%
ofallNPL
sitesreceived this designation in the 1980s. Together,columns
(2) and (3) demonstratethat 443 ofthe
676
sites in the 1982HRS
sample eventuallywere
placed on theNPL.
Thisnumber
exceedsthe
400
sitesthat Congresssetasanexplicit goal,because,aswe
havediscussed,some
sites withinitial scores
below
28.5were
rescored and then received scoresabove
the threshold.Most
of thissiteswherethe
EPA
declaredremediationtobe completeatalloperatingunits."
We
measureactual costasthesum
ofgovernment outlaysandestimates ofthecostsoftheremediationthatwerepaid for by non-governmentalresponsible parties across. The actual outlaysby theseparties are unavailabletothe public and the EPA, so these parties' estimated outlays
come
fromEPA
engineers' estimates of the costs of completingtherequiredremediation. SeetheDataAppendix forfurther details. ProbstandKonisky (2001) provide acomprehensive accounting ofpastcostsonSuperfundremediationsanddetailed projectionsaboutfuture costs.'^
Federal facilities wereprohibited from inclusion on the
NPL
until 1984. Consequently, the 1982HRS
sample doesnot containanyfederalfacilities.rescoring occurred in the 1986-1989 period. Panel
B
providesmean
HRS
scores, conditioned on scoresabove
andbelow
28.5. Notably,themeans
aresimilar across thecolumns.Panel
C
reportson
the size ofthe hazardous waste sitesmeasured
in acres. This variable is onlyavailable for
NPL
sites since it is derived from theRODs.
In the three columns, themedian
site sizeranges
between
25 and 35 acres.The means
are substantially larger dueto afew
very large sites.The
modest
size ofmost
sites suggests that any expected effectson
property valuesmay
be confined torelativelysmallgeographicareas.
Panel
D
provides evidence on the timerequired for the achievement ofthe clean-up milestones.The
median
time until the different milestones are achieved is reported, rather than the mean, becausemany
sites havenotreached allofthe milestones yet.As
an example, only 16oftheNPL
sites incolumn
(2)receivedeithertheconstructioncomplete ordeleteddesignationby 1990. Thus,
when
we
measure
theeffect of
NPL
status on 1990 housing prices, this effect will almost entirely be driven by siteswhere
remediation activities are unfinished.
By
2000, thenumber
ofsites inthe construction complete/deletedcategoryinthis
column
had increased dramatically to 198. Incolumn
(1), thenumbers
ofsitesthatwere
constructioncomplete
by 2000
(1990)is478
(22).Panel
E
reportstheexpectedcosts ofclean-up forNPL
sites. This informationwas
obtainedfrom
the sites'
RODs
and provides ameasure
ofthe expected costs (2000 $'s) ofthe clean-up before anyremediation activities have begun."'
They
include all costs expected to be incurred during the activeclean-up phase, as well as the expected costs during the operation
and
maintenance phase that issubsequenttothe assignment oftheconstructioncomplete designation.
In the All
NPL
Sample, the estimated cost datais available for753 ofthe985
NPL
sites.The
mean
andmedian
expectedcosts of clean-upare $28.3 millionand
$11 million.The
largermean
reflectsthe high cost ofa
few
clean-ups—
for example, the 95"' percentile expectedcost is $89.6 million. In the1982
HRS
Sample
incolumn
(2),themean
andmedian
are$27.5 millionand
$15.0 million.The
final panel reports estimated and actual costs for thesubsample
ofconstruction complete^'
Allmonetaryfiguresarereportedin2000$'s,unlessotherwise noted.
'
sites
where
both costmeasures are available.To
the best of our knowledge, theestimatedand
actual costdata have not been brought together before.
The
conventionalwisdom
is that the actual costs greatlyexceed the estimated costsofclean-up, andthistable providesthe first opportunityto test this view.
The
data support the conventional
wisdom
as themean
actual costs are35%-55%
higher than themean
expectedcosts across the threecolumns.
The
findings aresimilarformedian
actual and expectedcosts.A
comparison ofcolumns
(2) and (3) across the panels reveals that the sites with and withoutcomplete housing price dataare similaron a
number
of dimensions. For example,themean
HRS
scoresconditional on scoring
above
and below 28.5 are remarkably similar. Further, themedian
sizeand
various cost variables are
comparable
inthetwo
columns. Consequently, itseems
reasonable toconcludethat the sites without complete housing price data are similar to the
column
(2) sites, suggesting thesubsequentresults
may
berepresentativeforthe entire 1982HRS
Sample.Additionally, the sites in
column
(1) are similarto the sites incolumn
(2) and(3) insizeand
thetwo
costvariables.The
mean
HRS
scoresare afew
points lower, butthis comparison is not meaningfulduetothechanges inthe testover timeandchanges in the
how
the scoringwas
conducted.''" Overall, thesimilarityofthe
column
(1)sites withtheothersitessuggeststhatitmay
bereasonabletoassume
thattheresultsfrom the application ofthe
HRS
researchdesigntothe 1982HRS
sampleare informativeabouttheeffectsofthe otherSuperfundclean-ups.
We
now
graphicallysummarize
some
other features ofthetwo
samples. Figure 1 displays thegeographicdistribution ofthe
985
hazardous wastesites in the AllNPL
Sample. There areNPL
sites in45 of the 48 continental states, demonstrating that Superfund is genuinely a national program.
The
highest proportion ofsites, however, is inthe Northeast and
Midwest
(i.e., the "Rust Belt") that reflectsthe historicalconcentrationof
heavy
industry inthese regions.Figures 2
A
and
2B
present the geographic distribution of the 1982HRS
sample. Figure2A
displays thedistributionofsiteswith 1982
HRS
scoresexceeding28.5, whilethose withscoresbelow
this'"
Furtheroncethe28.5 cut-offwasset,the
HRS
testerswereencouraged tominimizetestingcostsand simply determinewhetherasiteexceededthe threshold. Consequently,testersgenerally stopscoringpathways onceenoughpathwaysarescoredtoproduceascoreabovethe threshold.
threshold aredepictedin 2B.
The
sites in both categories arespreadthroughout the UnitedStates, but thebelow
28.5 sites are in fewer states. For example, there are not anybelow
28.5 sites in Minnesota,Florida, and Delaware.
The
unequal distribution of sites across the countiy in thesetwo
groups is apotential
problem
for identification in the presence of local shocks,which
are a major feature of thehousingmarket.
To
mitigateconcerns aboutthese shocks,we
emphasize
econometricmodels
that includestatefixedeffectsforchanges inhousingprices.
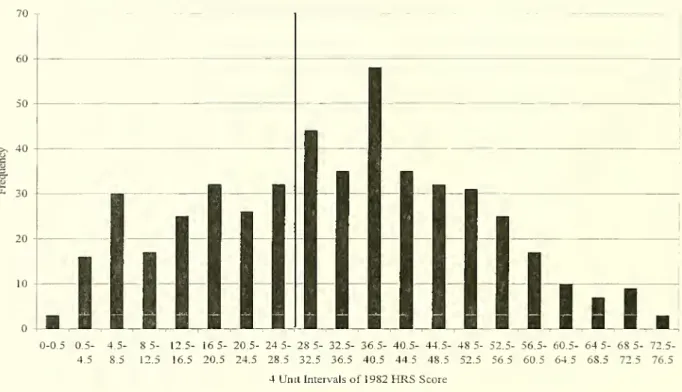
Figure 3 reports the distribution of
HRS
scoresamong
the487
sites in the 1982HRS
Sample.The
figure is a histogramwhere
the bins are 4HRS
points wide.The
distribution looks approximatelynormal, with the
modal
bin covering the 36.5-40.5 range. Importantly,227
sites haveHRS
scoresbetween
16.5and
40.5. Thissetiscenteredonthe regulatory thresholdof28.5 thatdetermines placementon the
NPL
andconstitutestheregression discontinuitysamplethatwe
exploit inthesubsequent analysis.Figure4 plotsthe
mean
estimated costsof remediation by 4-unit intervals (solid line), along withthe fractionofsitesin each interval withnon-missingcostdata (dotted line).
The
vertical linedenotesthe28.5 threshold.
The
non-zeromean
costsbelow
thethreshold are calculatedfrom
the sitesthatreceived ascore greater than 28.5
upon
rescoring and latermade
it onto theNPL.
The
estimated costs ofremediation appear to be increasing in the
HRS
score. This finding suggests that despite its widelyacknowledged
noisiness, the 1982HRS
scoresmay
be informative about relative risks. In theneighborhood of28.5,however, estimated costs areroughly constant,providing
some
evidencethatrisksareroughlyequal
among
thesites inthe regressiondiscontinuitysample.IV.
Econometric
Methods
A.LeastSquares Estimation with
Data from
the Entire U.S.Here,
we
discuss a conventional econometric approach to estimating the relationshipbetween
housingprices
and
NPL
listing. This approachis laidout inthe followingsystem ofequations:(7) yc2000
~
1(l^PLc200o)+
Xcl98o'P+
Ec2000,(8) 1(NPLc2000)
=
Xci98o'n+
ric2000,where
yc2ooo is the log of themedian
property value in census tract c in 2000.The
indicatorvariable l(NPLc2ooo) equals 1 only forobservations from census tractsthat contain ahazardous waste site
that has been placed on the
NPL
by 2000. Thus, this variable takes on a value of 1 forany
oftheSuperfund sites in
column
(1)ofTable 1, notjustthosethatwere
onthe initialNPL
list.The
vectorXci98oincludes determinants of housing prices
measured
in 1980, and Ec2oooand
ric2ooo are the unobservabiedeterminants of housing prices and
NPL
status, respectively.We
are also interested inthe effect ofNPL
statusin 1990,andtheyear 1990versionsoftheseequations aredirectlyanalogous.
A
few
features oftheX
vector are noteworthy. First,we
restrictthis vectorto 1980 valuesofthevariables to avoid confounding the effectof
NPL
status with "post-treatment" changes in these variablesthat
may
be due toNPL
status. Second,we
include the 1980
value ofthe dependent variable, ycso inXci98o, to adjust for permanent differences in housing prices across tracts and the possibility of
mean
reversionin housingprices. Seethe
Data
Appendix
forthefullsetofcovariates.Third in
many
applications ofRosen's model, the vector ofcontrols,denoted by X, is limited tohousing
and
neighborhood characteristics (e.g.,number
ofbedrooms, school quality, and air quality).Income
and other similar variables are generally excluded onthegrounds thatthey are"demand
shifters"andare
needed
toobtain consistent estimatesoftheMWTP
function.The
exclusion restrictionis invalidhowever
ifindividualstreatwealthy neighbors asan amenity (or disamenity). In thesubsequent analysis,we
are agnostic aboutwhich
variables belong in theX
vector and report estimates that are adjusted fordifferentcombinationsofthe variables available inthe
Census
data.The
coefficient 6 measurestheeffectofNPL
status on2000
property values aftercontrolling for1980
mean
property values and the other covariates. Ittests for differential housing price appreciation incensus tracts with sites placedon the
NPL.
Ifthere areunobservedpermanent
or transitory determinantsof housing prices that covary with
NPL
status,thenthe leastsquares estimator of9 will be biased.More
formally, consistent estimation of6 requires E[ec2oooTlc2ooo]
=
0.To
account for local shocks to housingmarkets,
we
emphasizeresultsfrom specificationsthatinclude afijll setofstatefixedeffects.Ultimately, theconventionalapproach described in thissubsectionrelies on a
comparison
ofNPL
sitesto the rest ofthe country. Its validity rests on the assumptionthat linearadjustment controls for all
determinants of housing price growth
between
census tracts with and without aNPL
site, besides theeffectofthesite'splacement onthe
NPL.
B.
A
Quasi-ExperimentalApproach based on
the1982
HRS
ResearchDesignHere,
we
discuss our preferred identification strategy that hastwo
Icey differences with theone
described above. First,
we
limit thesample
to the subset of census tracts containing the487
sites thatwere
considered for placementon
the initialNPL
and have complete housing price data. Thus, allobservations are
from
censustracts with hazardous wastesites thatwere
judged to beamong
the nation'smost
dangerous by theEPA
in 1982. If, for example, the P's differ across tracts with and withouthazardous waste sites or there are differential trends in housing prices in tracts with and without these
sites, thenthis approach is
more
likely toproduce
consistent estimates. Second,we
use atwo-stageleastsquares
(2SLS)
strategytoaccountforthepossibilityofendogenous
rescoringofsites.More
formally,we
replaceequation(8)with:(9) 1(NPLe2000)
=
Xcl980'n+
5 1(HRSc82>
28.5)+
TleZOOO,"
^
-where
I(HRSc82>
28.5) serves as an instrumental variable. This indicator function equals 1 for censustracts with a site that has a 1982
HRS
score exceeding the 28.5 threshold.We
then substitute thepredicted value ofl(NPLc2ooo)
from
theestimation ofequation (9) inthe fitting of(7) to obtain 92sls- Inthis
2SLS
framework, B2sls is identifiedfrom
the variation inNPL
status that is due to a site having a1982
HRS
scorethatexceeds28.5.For BjsLs to provide a consistent estimate ofthe
HPS
gradient, the instrumental variablemust
affect the probability of
NPL
listing, without having a direct effect on housing prices.The
next sectionwill demonstratethatthefirstcondition clearly holds.
The
secondcondition requiresthatthe unobserveddeterminants of
2000
housing prices are orthogonal tothe portion ofthenonlinear function ofthe 1982HRS
score that is not explainedby
Xcigso- In the simplest case, the2SLS
estimator is consistent ifE[l(HRSc82>28.5)e,2ooo]=0.
We
also obtain2SLS
estimates anotherway
that allows for the possibility that E[l(HRSc82>
28.5) ec2ooo] ^^ over the entire 1982
HRS
sample. In particular,we
exploit the regression discontinuitydesign implicit in the !(•) function that determines
NPL
eligibility in three separate ways. In the first.
'
approach, a quadratic in tlie 1982
HRS
score is included in Xcigso to partial out any correlationbetween
residual housingprices and the indicator fora 1982
HRS
score exceeding28.5. This approach does notrequirethatthedeterminantsof housingprices areconstant across therangeof 1982
HRS
scores. Instead,it relies on the plausible assumption that residual determinants of housing price growth do not
change
discontinuouslyat
HRS
scoresjustabove
28.5.The
second regression discontinuityapproach involves implementing our2SLS
estimator on theregression discontinuity
sample
of227
censustracts. Recall,thissample
is limitedtotractswithsitesthathave
1982HRS
scoresbetween
16.5 and 40.5. Here, the identifying assumption is that all else is heldequal in the "neighborhood" of the regulatory threshold.
More
formally, it is E[l(HRSc82>
28.5)£c2ooo|16.5
<
1982HRS
<
40.5]=
0. Recall, theHRS
score is a nonlinear function ofthe ground water,surface water, and air migration
pathway
scores.The
third regression discontinuitymethod
exploitsknowledge
ofthis function by including the individualpathway
scores in the vector Xdgso. All oftheseregression discontinuity approaches are
demanding
ofthe dataand
this will be reflected in the samplingerrors.
V. Empirical Results
A. Balancing
of
Observable CovariatesThis subsection
examines
the quality of the comparisons that underlie the subsequent leastsquaresand quasi-experimental
2SLS
estimatesoftheeffectofNPL
statuson housing price growth.We
beginby examining whether
NPL
status andthe l(HRSc82>
28.5) instrumental variable areorthogonaltotheobservablepredictorsof housingprices. Formal tests forthe presenceof omitted variables bias are as
always unavailable, but it
seems
reasonable topresume
thatresearch designs that balancethe observablecovariates across
NPL
status or l(HRSc82>
28.5)may
sufferfrom
smalleromitted variables bias. First,these designs
may
bemore
likely to balancethe unobservabies(Altonji, Elder, andTaber 2000).Second
ifthe observablesarebalanced, then consistent inferencedoes not
depend
onfunctional form assumptionsonthe relations betweenthe observable confounders
and
housingprices. Estimatorsthat misspecity' thesefunctional forms (e.g., linear regression adjustment