Volume 40(3)
Summer/été 2014
Things I Have Learned about Meta-‐Analysis Since 1990: Reducing Bias in
Search of “The Big Picture”
Ce que j’ai appris sur la méta-‐analyse depuis 1990 : réduire les partis pris en
quête d’une vue d’ensemble
Robert M. Bernard, Concordia University
Abstract
This paper examines sources of potential bias in systematic reviews and meta-analyses which can distort their findings, leading to problems with interpretation and application by practitioners and policymakers. It follows from an article that was published in the Canadian Journal of Communication in 1990, “Integrating Research into Instructional Practice: The Use and Abuse of Meta-analysis,” which introduced meta-analysis as a means for estimating population parameters and summarizing quantitative research around instructional research questions. This paper begins by examining two cases where multiple meta-analyses disagree. It then goes on to describe substantive and methodological aspects of meta-analysis where various kinds of bias can influence the outcomes and suggests measures that can be taken to avoid them. The intention is to improve the reliability and accuracy of reviews so that practitioners can trust the results and use them more effectively.
Résumé
Cet article examine les sources des partis pris potentiels dans les synthèses systématiques et les méta-analyses qui peuvent déformer les conclusions, ce qui peut causer des problèmes
d’interprétation et d’application par les praticiens et les responsables des politiques. Il fait suite à un article publié dans le Canadian Journal of Communication en 1990, intitulé « Integrating Research into Instructional Practice: The Use and Abuse of Meta-analysis », qui présentait la méta-analyse comme moyen d’estimer les paramètres relatifs à la population et de résumer la recherche quantitative sur les questions de recherche pédagogique. L’article commence avec l’examen de deux cas dans lesquels de nombreuses méta-analyses sont en désaccord. Il décrit ensuite les aspects substantifs et méthodologiques des méta-analyses dans lesquels divers types de partis pris peuvent influencer les résultats et suggère des mesures qui peuvent être adoptées pour éviter ces partis pris. L’intention est d’améliorer la fiabilité et l’exactitude des synthèses afin que les praticiens puissent compter sur les résultats et les utiliser plus efficacement.
Introduction
In the Canadian Journal of Educational Communication (the forerunner of this journal) 1990, volume 19, number 3 (pages 171-195), Som Naidu, then a doctoral candidate in Educational Technology at Concordia University, and I co-authored an article entitled “Integrating Research into Instructional Practice: The Use and Abuse of Meta-analysis.” We hadn’t actually conducted a meta-analysis at that point, but we had read extensively about the methodology and drew examples from a variety of meta-analyses of that era, especially around the ongoing debate concerning the efficacy of mastery learning compared to regular classroom instruction. In that article, we wondered how two prominent meta-analyses (Lysakowski & Walberg, 1982; Guskey & Gates, 1986) and a “best evidence synthesis” by Robert Slavin (1987) could provide such different answers to the very same research question: “Does mastery learning produce better achievement outcomes than traditional group-based classroom instruction?” Lysakowski and Walberg reported an average effect size of around d+ = 0.94 (i.e., about one standard deviation difference between mastery learning and regular classroom) for k = 94 (i.e., 94 individual effect sizes) from 54 studies, while the Guskey and Gates meta-analysis reported a median effect size of between 0.40–0.60 for 25 studies by using more conservative methodological quality criteria than Lysakowski and Walberg. By contrast, Slavin found a median effect size of 0.0 for four studies using even more conservative inclusion criteria. Guskey and Gates also found wide variability among effect sizes, ranging from d = 0.02 to d = 1.70, suggesting the presence of variables (e.g., time-on-task) that might moderate the overall findings. Debate over the effects of mastery learning continued until behaviorist approaches to classroom instruction in public education lost favor in the late 1980s.
It occurred to me at that time that meta-analysis might not be an ideal way to provide teachers with instructional guidance (hence the word abuse in the title), since it could produce such seemingly conflicting advice. Based on Lysakowski and Walberg, it was full speed ahead for mastery leaning, but according to Slavin, mastery learning was not worth the extra effort. The Guskey and Gates results were more equivocal. As it turns out, it is likely that the major source of discrepancy was in the literature selected by each reviewer (i.e., not a great deal of overlap) and the major differences in the inclusion/exclusion criteria applied by each (see Slavin for a detailed discussion of both of these issues).
In retrospect, after conducting meta-analyses myself for almost 20 years, I am now convinced that there is no better means for synthesizing quantitative evidence—it is the best game in town, so to speak—so the rest of this paper will not be an attempt to discredit or debunk the notion of meta-analysis. Instead, it will describe the potential methodological pitfalls that may lead to biased results and the remedies that can lead to more reliable and possibly more consistent
results across meta-analyses. At the same time, I will attempt to provide consumers with hints for spotting bias in the various steps and procedures involved in conducting a meta-analysis. As a caveat to this, it should be recognized that the published results of a meta-analysis—like any other report of research—might not include enough information for even the knowledgeable consumer to judge whether serious forms of bias are present or not. So what might appear to be a hint of bias might simply be poor reporting.
Bias is systematic inaccuracy in data due to characteristics of the processes employed in its collection, manipulation, analysis, and/or presentation.
Variability among meta-analyses on a common topic, while not usually as dramatic as the case of mastery learning just described, is not that uncommon. An example that is closer to home
involves the effectiveness of technology use in classrooms compared with no technology use, a topic of lively debate over the years (e.g., Clark, 1983, 1994). Rana Tamim and her colleagues at the Centre for the Study of Learning and Performance (Tamim, Bernard, Borokhovski, Abrami & Schmid, 2011) published a second-order meta-analysis on technology integration in education entitled “What forty years of research says about the impact of technology on learning: A
second-order meta-analysis and validation study.” John Hattie does something very similar over a very wide range of educational variables in his 2009 book entitled Visible Learning: A
Synthesis of over 800 Meta-Analyses Relating to Achievement. In the Tamim et al. study, 25 meta-analyses were selected from a larger number of meta-analyses comparing technology use in the treatment to no technology use in the control. Meta-analyses were selected using two criteria: 1) moderate and high-quality meta-analyses; and 2) those with minimal overlap of primary studies. Across the 25 meta-analyses, average effect sizes ranged from a high of d+ = +1.12 to a low of d+ = –0.09, more than a 1.0sd difference. The average weighted effect size across all 25 meta-analyses was d+ = 0.35, a modest but significant result.
Tamim’s study included all years from 1986 to 2008, all grade levels, all content areas and all types of technology, but as Table 1 shows, even in a set of meta-analyses limited to K-12 math and science content with general technology use, there is still a range of outcomes. Studies from 2005 to 2010 are fairly consistent, but in 2012 and 2013 there is a dip, presumably because these two reviews are best evidence syntheses. In terms of percentage of increase between the
technology treatment group and the no technology control group, the range is fairly dramatic: from 1.6% at the lowest to 18.4% at the highest. Careful reading of these studies would be required to discern the sources of inconsistency among them, but on the surface it is hard to judge whether technology is fundamental or peripheral to teaching math and science in K-12 education. This is just one of many examples of disagreement among meta-analyses which may lead to confusion over the true effectiveness of technology or other instructional interventions applied within classroom settings.
Table 1:
Meta-analyses since 2005 of achievement outcomes in science and/or math education.
Date Meta-Analysis (technology focus) Level Area(s) Number of
Effects/Studies
Average
ES
2005 Liao et al. (computer-based instruction) E & S1 Science &
Math 21 ES 0.52
2007 Schroeder et al. (instructional technology) E & S Science 15 studies 0.48 2007 Rosen & Salomon (technology-intensive) E & S Math 32 studies 0.46 2010 Li & Ma (general technology) E & S Math 85 ES 0.28 2012 Slavin et al. (general technology) E Science 17 studies 0.04-0.37 2013 Cheung & Slavin (technology applications) E & S Math 74 studies 0.15 1E = Elementary, S = Secondary.
While it is arguable that Tamim et al.’s result of d+ = 0.35 represents a reasonable average of these six studies, as well as the entire collection of 25, two things are lost in a second-order meta-analysis: precision and detail. Precision is lost because averaging always reduces a set of data to a single number, especially when it is an average of averages. Considering variability (i.e., a standard deviation in the case of primary data) helps add back some detail (i.e., how wide the bulk of values is), but this is problematic in a second-order meta-analysis since variability is a function of sample size and there are two “sample sizes.” The number of primary studies per meta-analysis produces an underestimate of variability, and the number of individual participants per meta-analysis (i.e., the sum of all of the individual people) produces an overestimate of variability.
Detail is lost because, across a set of meta-analyses, there are few common moderator variables that can add texture to the analysis or to a more precise breakdown of what works and does not work under different conditions (i.e., levels of moderator variables). Only first-order meta-analyses can produce this detail from primary studies. The reduced precision and detail in
second-order meta-analyses diminishes their effectiveness as vehicles for providing real evidence of effectiveness. John Hattie’s second-order meta-analyses referred to earlier also suffer from these same limitations.
This leads me to my first conclusion about meta-analysis:
Multiple systematic reviews/meta-analyses around a single research question can lead to considerable disagreement about the population they represent and the true state of the research question they are designed to answer. It is up to both creators and consumers to understand why this happens and to guard against misrepresentation and
over-interpretation. In this respect, meta-analysis is no different from other forms of research. As a final note to this section, there is considerable evidence that decisions regarding the choice and use of technology, or policy-making and practice in other important areas of education, are not based on research findings from meta-analyses or other sources (Lysenko, Abrami, Bernard, Dagenais, & Janosz, in press). Many educational decisions are based on a variety of factors— cost, usability, politics, values, expert opinion, etc.—but research evidence is often not a major consideration. However, it should be as important, if not the most important, element in this mix. This, of course, is only the case when meta-analyses and other sources of evidence are carefully conducted and contain little bias.
Types of Bias and How They Can Affect the Results of a Review
Meta-analysis in education is about the study of research questions within populations of students, teachers, schools, school districts, or whatever unit of analysis is appropriate to the question. Thus, meta-analysis does explicitly what primary research intends to do inferentially: provide information about the population. Gene Glass invented (or reintroduced, see Pearson, 1904) the methodology in the 1970s (Glass, 1976) to meet what many had come to perceive as a growing problem in educational research (actually in all research), namely the exponential proliferation of primary quantitative research and the limitations of the prevailing methods to summarize it. Since then, meta-analysis has become the standard way of summarizing and synthesizing quantitative research in a variety of areas, especially the health sciences. Meta-analysis has solved many of the problems associated with the supposed subjectivity of narrative
reviews (e.g., the kind often found in the literature review of a dissertation or thesis) and the statistical bias associated with vote count methodology (Jackson, 1980). However, many challenges remain to ensure that meta-analysis itself is free of bias that can distort results and mislead practitioners.
All researchers know that no methodology is completely immune to bias, but bias emanates from practice, not from conception. In other words, it is fairly easy to design a near perfect
experimental study (Campbell & Stanley, 1963), but it is quite difficult to maintain its integrity while conducting it. A host of largely situational threats to internal validity can compromise the derivation of a causal connection between an independent and dependent variable. The same is true for meta-analysis—as a conception it is a significant advance over prior methodologies aimed at understanding the state of a population around a given question. But in practice, meta-analysis can suffer from bias, usually unintended, from its onset to its completion. The second lesson I have learned since 1990 is about sources of bias.
Every step in a systematic review/meta-analysis must be scrutinized for potential bias, from the formulation of the research question to the interpretation and discussion of the
results, to ensure the quality and applied value of the final product. In the following sections, roughly based on the steps and procedures described by Cooper (2010), I will describe some of the sources of bias and how to reduce them, thereby increasing the odds that the final product will represent a fair assessment of the research question and that the result will be an accurate representation of the average effects and variability within the target population.
Before moving on, I would like to clarify the terms systematic review and meta-analysis, as they are not necessarily synonymous. Within current thinking, all reviews should be systematic, whether they culminate in a meta-analysis or not. A systematic review is a summary of the research literature, either quantitative or qualitative, which 1) uses explicit, replicable methods to identify relevant studies, and 2) uses objective and replicable techniques to analyze and
summarize those studies. The goal of any systematic review is to limit bias in the identification, evaluation and synthesis of the body of relevant studies that address a specific research question. Some researchers use the term “meta-analysis” to refer only to the quantitative summaries used in a systematic review, while others use it more broadly. Therefore, a systematic review need not include a meta-analysis or quantitative synthesis, but to be inclusive, a meta-analysis should emanate from a systematic review. A systematic review could conceivably include qualitative studies along with quantitative studies, so some of the stages I will describe apply to both forms of data. However, since this paper is really about reaching statistical conclusions, I will use the terms systematic review and meta-analysis interchangeably.
Formulating the problem. The questions posed in a systematic review help to focus attention on the goals of the research endeavor, the important variables that will be addressed and their relationship to one another. It is not necessary that a new systematic review conform to the questions that have been asked in previous efforts to synthesize literature, but it is important that an analyst specify how a new review departs from, updates, or goes beyond previous reviews. For instance, a review of the effects of laptop programs on achievement in 2nd and 3rd graders
may not necessarily represent similar treatment conditions summarized across other grade levels. Failure to clarify this distinction is not necessarily evidence of bias, but from the consumer’s perspective, it may lead to confusion and misapplication of the results.
Similarly, inclusion/exclusion may differ from synthesis to synthesis and this may lead to divergent results. As an example, a study that admits very short duration studies (e.g., lab-based true experiments lasting less than one day) may produce very different results from one that excludes short studies and admits only standard-length courses (e.g., quasi-experimental one-semester field studies). Neither is right nor wrong, they are just different. One way of examining these issues for potential bias is to compare the operational definitions across meta-analyses, if the researchers provide them. If they are not provided and the study is at variance with similar studies, buyer beware.
In a carefully crafted systematic review, the problem statement and subsidiary inclusion/exclusion criteria should be clear and precise so that the reader will know
if the procedures that follow will likely produce biased results. Searching the literature. This is arguably one of the most important aspects of
conducting a systematic review/meta-analysis and may be compared to the data collection phase of a primary study. Considerable bias can be introduced at this stage. Common problems include: 1) selective searches that ignore large bodies of potentially relevant literature (e.g., by using published articles only); 2) searches that use very different key words or that ignore the fact that some databases use specialized terms or controlled vocabulary; and 3) searches that are clearly at odds with the research question and/or the operational definitions that form the basis for
including or excluding studies. It seems almost too obvious to state, but studies that are not found in searches, for whatever reason, cannot be selected for inclusion, so it is always preferable to over-search than to under-search.
Publication bias is considered by some (e.g., Rothstein, Sutton & Borenstein, 2005) to be one of the most distorting aspects of systematic reviews. Publication bias occurs when there is
systematic selection, usually unintentional, of studies that reside primarily at the positive end of the effect size continuum. It has long been recognized that research journals tend to publish more studies that find differences than studies that do not, especially differences that favor the research hypothesis. Since a systematic review aims to characterize the entire literature fairly, it is
desirable to also find studies that produce no effect as well as studies that contain findings that are contrary to the anticipated outcomes of experimental paradigms (i.e., results that favor the control condition). There may be no such studies in the literature, but the odds suggest that there are, and if they are not found and included, the estimate of effect will tend to be biased.
There are a number of graphical and statistical tools available to help judge publication bias (e.g., Borenstein, Hedges, Higgins & Rothstein, 2009), but it is often possible to read the search
criteria and inclusion/exclusion rules in order to judge whether this form of bias is likely. A carefully crafted systematic review (meta-analysis) always contains multiple classes
of publication type—journal articles, gray literature (e.g., conference proceedings), dissertations, and theses, etc.—so as to avoid publication bias as much as possible.
Extracting effect sizes and coding study features. Effect size extraction is the process of locating and documenting descriptive or statistical test data (e.g., t-ratios) that will form the quantitative basis for effect size calculation. The basic equation for calculating an effect size is
fairly straightforward di= XTreatment − XControl SDPooled ⎛ ⎝⎜ ⎞
⎠⎟ , but the array of decisions that must be made about which effect sizes should be calculated and how they should be treated is challenging and takes a considerable amount of time and expertise. Research manuscripts are usually not as straightforward as one might expect. While they generally follow the same form (introduction, method, results, and discussion), complications almost always exist and often many extremely complex decisions need to be made. Here are just a few of the questions that arise that must be answered:
Is there at least one comparison that fits the treatment/control definition? Is there at least one measure that meets the outcome definition?
Are there enough available data to calculate an effect size? Are all sample sizes provided?
Is a calculation equation available for these data?
Are there pretest/posttests gain scores for which a correlation coefficient is needed? Can multiple effect sizes be calculated that are independent in terms of sample used? The following point is important. Dependency may arise out of repeated use of data from the same sample of participants when either multiple treatment and/or control conditions are present in the same study or when several outcome types (especially, with various measures for the same outcome type) are reported (Scammacca, Roberts, & Stuebing, 2013). Quite often, primary empirical research features more than one treatment condition, thus allowing for more than one comparison for effect size extraction. To avoid potential bias, an analyst should resist the temptation to uncritically make multiple comparisons, and instead choose one of the following three solutions: 1) select a comparison that is most representative of the research question; 2) calculate average effect sizes that derive from multiple comparisons; or 3) use several
comparisons while statistically adjusting each resulting effect size (e.g., proportionally reducing the sample size of the group used repeatedly). A related concern exists for multiple assessments of the same outcome type (e.g., several exams or assignments) reported in the same study. Similar measures could be taken in that case with the obvious exception of option 3) above. No adjustment could possibly prevent bias associated with multiple effect sizes that are derived from the same participants assessed with several analogous but different tests. The other important issue is related to dealing with different types of outcomes in various primary studies included in a review. Surprisingly, there is an alarming tendency for some researchers to combine into a single average effect size outcomes that should not be aggregated, for example, achievement and attitude. This is just plain wrong. Whatever solution an analyst opts for to avoid dependency, it should be transparent and should be applied consistently across studies within the same review. One thing to look for in a review is the biasing effect of extreme effect sizes, both positive and negative. There are several possible reasons for unreasonably large effect sizes (i.e., generally
ones over ±3.0sd difference between the treatment and control means). First, data extracted from primary studies may contain errors caused either by the author of the original study or by the review coders. Second, effect sizes derived from pretest-posttest designs (sometimes called gain or change scores) can be too large if a pretest-posttest correlation is not available or cannot be estimated, or if the pretest is not used as a covariate to produce adjusted posttest means.
Here is an example of the potentially distorting influence of outlying effect sizes drawn from the distance education literature (Shachar and Neumann, 2003). When it was published, this meta-analysis was clearly at odds with other meta-analyses in that timeframe (Cavanaugh, 2013, see Table 11.1 on page 171). For the comparison between classroom instruction and distance education instructional conditions, they found an average effect size of d+ = 0.37 (k = 86) when other meta-analyses of that era were finding an average of around g+ = 0.00 (e.g., Bernard, Abrami, Lou, Borokhovski et al., 2004). As it turns out, Shachar & Neuman included an effect size of d = 2.87, not an outrageously large effect size, but much larger than the next six largest effect sizes, which ranged between d = 1.08 and d = 1.35. This anomalously large effect size may have contributed to the unusually high average effect size, but another unusual situation in their data might have played an even bigger role. This will be discussed in the up-and-coming section on synthesizing effect sizes.
To illustrate the characteristics of a distribution of effect sizes without outliers, Figure 1 shows the collection (k = 879) from a recent meta-analysis of technology applications in higher education (Schmid, Bernard, Borokhovski, Tamim et al., 2014). Notice that effect sizes range between d = ±2.5, with no outlying effect sizes. The distribution is nearly normal, not overly skewed (skewness = 0.28) but slightly leptokurtic (kurtosis = 1.21). The unweighted mean is 0.28 with a standard deviation of 0.56. The median and the mode are about 0.25. Seven outlying effect sizes between d = +2.68 and d = +8.95 were removed to achieve this level of symmetry. The basic principle here is to err on the side of conservatism so as to present results that are not skewed either positively or negatively and to know how the meta-analysis fits into the literature of previous meta-analyses.
Study features, as the name suggests, are characteristics occurring across many studies in a review, which can be used as moderator variables as the analyst attempts to explain variability found among studies in the larger collection. As with other aspects of a review, study features should be aligned with the purposes of the research question and with the unique characteristics of the literature under review. Study features can be either categorical (e.g., subject matter) or continuous (e.g., year of publication) and generally fall into four major categories: publication features (e.g., publication source), methodological features (e.g., research design), demographic features (e.g., grade level) and/or substantive features (e.g., technology type, instructional technique).
While the previous discussion about coding errors in effect size extraction applies to study features, as the analyst moves into the analysis phase, another aspect of potential bias arises: bias due to confounding of different moderator variables (Lipsey, 2003). Confounding has the same general meaning here as it does with respect to primary studies—elements of one moderator variable that overlap another moderator variable so as to cloud the interpretation of both. However, in meta-analysis, confounding is more insidious because it cannot be controlled for and is undetectable unless there is sufficient statistical power to conduct the equivalent of
multi-way analysis of variance or multiple regression. A significant interaction term signals the presence of bias due to confounding.
Effect Size
Figure 1. Histogram of 879 unweighted effect sizes based on achievement outcomes. From Schmid, Bernard, Borokhovski, Tamim et al. (2014) Computers & Education.
Consider this situation: the levels of two moderator variables, research design and length of treatment, are both significantly greater that zero. The tendency might be to interpret each of these independently, but upon conducting a two-way analysis, it is found that the average effect size for true experimental short-term studies (e.g., less than a month long) is significantly higher than the average effect size for quasi-experimental long-term studies (e.g., full semester).
Knowing about this relationship (i.e., confound), the analyst can no longer argue for the
significant differences in the variables treated independently. Unfortunately, there may be many such confounds in a meta-analysis with many coded moderator variables and not enough
statistical power to investigate them all in the way just described.
Errors in effect size extraction and study feature coding, made repeatedly over an entire meta-analysis, can lead to a significant degree of systematic bias.
Carefully designed extraction and coding rules can help prevent this, but applying the rules consistently is of utmost importance.
Three additional recommendations are directed towards researchers of primary studies who wish to have their research included in meta-analyses: 1) describe both the treatment and control conditions as thoroughly as possible; 2) describe methodological, demographic and substantive
characteristics as thoroughly as possible so that they can be coded as moderator variables; and 3) if requested and if it is available, supply missing information to meta-analysts. Remember that a analyst is a “prisoner of the past” and therefore unable to include information in a meta-analysis that is not in the primary literature.
Methodological quality. The What Works Clearinghouse (WWC, U.S. Department of Education) has among the highest evidence standards, admitting only true experiments and high-quality quasi-experimental studies into its recommendations to practitioners. For the WWC, controlling bias resulting from threats to internal validity is a predominant concern, nearly to the point of obsession. Internal validity—controlling for sources of bias that create plausible
alternatives to the research hypotheses—trumps external validity (i.e., matching the conditions that are extant in practice so that results can be generalized). However, it is arguable in education that a more balanced approach is desirable, and failure to consider whether primary studies map onto real instructional conditions is a form of bias in itself. If highly controlled results from laboratory studies say nothing about the expectations of practitioners working in real classrooms, such results will tend to misrepresent reality.
Abrami and Bernard (2006) argued that carefully constructed “field experiments” represent the best hope for balancing internal validity and external validity. In a subsequent article, Abrami & Bernard (2013) further argued that recognizing the potentially biasing methodological flaws in field experiments does not necessarily mean that they cannot be dealt with in meta-analysis. Primary studies can be rated on quality scales, such as Valentine & Cooper’s 2008 Study DIAD (Study Design and Implementation Assessment Device), and then either tested for bias or adjusted statistically to minimize bias. Methodological study quality, then, is treated as a
moderator variable rather than an exclusion criterion. An example of statistical adjustment of this type can be found in Bernard et al.’s 2009 study of interaction treatments in distance education.
Concerns about bias introduced by compromises to methodological study quality should be balanced against similar concerns about the non-representativeness
of research findings derived from highly controlled “laboratory” studies, which itself is a form of bias.
Synthesizing effect sizes. It is at the quantitative synthesis stage that a systematic review truly becomes a meta-analysis. Synthesis here refers to combining a set of effect sizes around a given research question using a measure of central tendency (usually a mean or median) and variability (measure of heterogeneity). It is entirely possible that an analyst might conclude that studies in a collection are so different that they cannot be synthesized, in which case a narrative review might be undertaken. Generally speaking, however, the intent is to provide a single overall estimate of the average effect size in the population.
Two analytical models, the fixed effect model and the random effects model, are appropriate for different circumstances. The fixed model is best used when all of the studies in the population are known and under scrutiny and are more alike than different in terms of question, sample, methodology, etc. The average, then, is a fixed-point estimate that is a true representation of the population parameter. The fixed model is used most commonly in health science reviews (e.g., drug testing) where all studies around a question are known and relatively uniform.
Heterogeneity analysis is then conducted to determine if the average weighted effect size is a good fit to the data.
By contrast, the random model is appropriate when only a portion of the studies that make up the population can be included and the characteristics of the studies differ considerably, even though they are asking and answering the same question. Each study is then judged to be a random representative of a micro-population of like studies (Borenstein, Hedges, Higgins, & Rothstein, 2009). This is almost always the case in the social sciences, including education, with the possible exception of so-called branded educational interventions, such as a set of replications conducted on a single educational product.
The difference in the two models relates to how each deals with the relationship between within- and between-study variability. In the fixed model, only within-study variance (VWithin) is included
in the weights that are applied to each study during synthesis
Wi = 1 VWithin ⎛ ⎝⎜ ⎞ ⎠⎟ . In the random model, both within- (VWithin) and average between-study variability (VBetween) are included in the
weights Wi = 1 VWithin+VBetween ⎛ ⎝⎜ ⎞
⎠⎟ . Under the fixed model, between-group variability is summed as Cochrane’s QTotal (i.e., sum of squares) and tested for heterogeneity using the χ
2
(chi square) distribution with k – 1 degrees of freedom. Under the random model, this between-study
variability is resolved into the weights so that no test of heterogeneity is performed. When there is no heterogeneity in the fixed model (QTotal ≈ 0), the two models produce the same result.
However, under certain conditions, the differences can be striking.
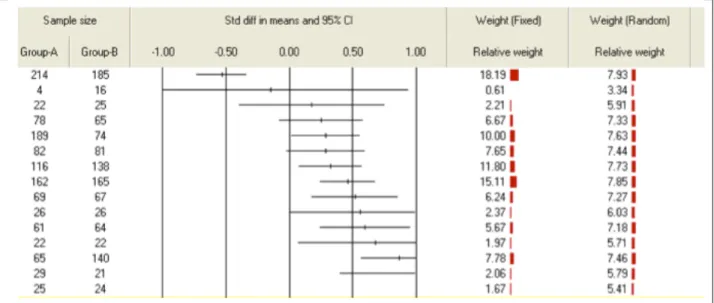
Here is an example of poor model selection. Under the fixed model, a large-sample high negative effect size brings the overall average effect size down, while the random model provides a more reasonable solution. A forest plot of data from a study of technology treatments in higher education is shown in Figure 2. Group A is the treatment condition and Group B is the control condition. There are 15 effect sizes and their sample sizes are shown on the left side of the figure. In the center, the horizontal lines mark the upper and lower boundaries of the 95th
confidence interval (notice that larger samples have shorter lines and smaller samples have longer lines) and the dot in the center is the effect size for each study. The 0.00-point marks “no effect” and effect sizes on the left are negative and those on the right are positive. The relative weights under the fixed and random analytical models are on the right side of the graphic. Look at the topmost study. It is a relatively large study and its effect size is negative (< -0.50). Because it has the largest sample size, it gets the largest weight of all of the studies (18.19% under the fixed model and 7.93% under the random model) and its influence produces a fixed effect average weighted effect size of d+ = 0.30, compared with d+ = 0.45 under the random model. If the analyst had incorrectly applied the fixed effect model, the average weighted effect size would have been 0.12sd lower compared with the random model. In other words, because of that very large-sample negative effect size (sometimes referred to as a high-leverage study), the fixed model underestimates the effect of the treatment.
Figure 2. Forest plot showing the biasing effect of a large sample study with a large negative effect size.
Returning to the Shachar and Neumann study described earlier, we see the reverse of the
example just presented. One of the contributors to the unusually high average effect size of d+ = 0.37 in the Shachar & Neumann meta-analysis is a primary study with an effect size of d = 1.22, not especially large compared to three other studies of that magnitude, but possessing a very large sample size of more than 2,000 participants. As in the previous example, this study is likely to have exerted a large influence on the outcome, except in a positive direction. Since Shachar and Neumann used the fixed effect model, this over-influential study is amplified in the final result.
Selecting and applying the right synthesis model in meta-analysis is important for correctly estimating the average effect size in the population.
Even when the random effects model is used, heterogeneity should be reported. Interpreting and discussing the results. It is nearly axiomatic that if the results are biased then the interpretation and discussion of them will be biased. However, it is also the case that the discussion can be biased even if the results are not. Perhaps the most common form of this is the result of selectivity: focusing on results that demonstrate points of interest to the analyst, while ignoring or downplaying results that might be of greater interest to the reader. For instance, in a particular meta-analysis that finds an overall average effect size of d+ = 0.15 for 50 studies, the author focuses on the results of a moderator analysis that finds an average effect size of d+ = 0.48 for 10 short-duration studies, but an average effect size of d+ = 0.05 for the
remaining 40 studies conducted in one-semester classrooms. To focus primarily on the short-term studies to the exclusion of the longer-short-term studies would be misleading.
Another potential distortion of interpretation is to attribute either too much or too little
importance to average effect sizes. For instance, it comes as no surprise that introducing a laptop program to an entire school district is expensive, requiring considerable support and training at additional expense. But what if the average effect size related to such an introduction is d+ = 0.30, a modest increase in achievement outcomes? While this average effect would likely be
significantly different from zero and possibly judged to be of importance to the analyst,
policymakers might rightly question whether the modest improvement justifies the expense. By contrast, the same average effect size for the introduction of a relatively inexpensive treatment, such as a new computer-based early literacy software application, might be heralded as an important and affordable addition to the curriculum.
Dissemination and publication of results. In my view, there is—or should be—a code of ethics that applies to the publication of meta-analyses. This code begins with the analyst and stretches beyond to journal editors and then to journal reviewers, who should also be
knowledgeable of these methodologies. A biased meta-analysis may enter the literature simply because editors and reviewers are unaware of best methodological practices and therefore unable to spot aspects of the meta-analysis that might contribute to this bias.
Meta-analysts must not work in a vacuum. They should be fully aware of the meta-analyses that have preceded theirs, the scope of the literature, the important methodological and substantive issues, and the previous results achieved before they embark on a new effort. Unless there are methodological issues with a prior review, and the new review is intended to clarify or supersede that work, a mere replication of a previous meta-analysis is a waste of time and effort. This does not apply to updates or extensions of existing work, especially in rapidly evolving fields such as educational technology, because these can serve to move the field forward and inform practice. In other words, a new meta-analysis should have something new to contribute.
Conclusion
Perhaps the most insidious bias that can exist is found in high-impact areas of study where economic, political, social, or scientific persuasion or other agendas can influence the primary literature that is the basis for a review and hence its results and interpretation. This is sometimes called agenda-driven bias and is most likely to occur when someone or some group (e.g., company, political party) has a considerable stake in the results. The most commonly recommended antidote to this form of biased persuasion is full disclosure of any conflicts of interest, but the results of a 2011 study described by the Cochrane Collaboration
( http://www.cochrane.org/news/blog/how-well-do-meta-analyses-disclose-conflicts-interests-underlying-research-studies) found that this is rarely done in medical research. This is indeed discouraging, but is not likely to be a great problem in education, since public granting/
contracting agencies or private foundations support most funded reviews. However, it is worth noting that when all or a preponderance of studies in a review come from the same research team, which is also performing the meta-analysis, agenda-driven bias must at least be considered. Even systematic reviews that examine studies in the qualitative literature (e.g., meta-syntheses) should be scrutinized for potential sources of bias. Attempts to synthesize this literature are relatively new, compared to meta-analysis (Bethel & Bernard, 2010), and so methodologies are not as well developed and there is not as much consensus on the standards for rigor as in the quantitative literature. There is, however, a substantial methodological literature for primary qualitative studies, detailed in many methods books (e.g., Cresswell, 2009), which should have something to contribute to the conduct and evaluation of meta-syntheses. As for literatures that contain both quantitative and qualitative primary research, there have been several attempts (e.g., Abrami, Bernard, & Wade, 2006; Pettigrew & Roberts, 2003) to create hybrid or mixed review
methodologies. However, synthesizing quantitative and qualitative results is by no means an easy or straightforward task.
There is a convincing case to be made for the exercise of due diligence by analysts, journal editors, reviewers and consumers alike. Serious bias can occur and in fact sometimes skews the results in important topic areas. Since meta-analyses are given more weight than individual studies, biased results can represent a significant setback to theory and/or practice in important areas of education. It would be naïve to suggest that all reviews around a given topic should concur, but whether they do or do not, we should strive to ensure that the review methods, the report of results, and their final interpretation and discussion are as unassailable as possible.
Acknowledgements:
The author expresses gratitude to the following individuals: Dr. Som Naidu1 (co-author of the original article), Dr. Richard A. Schwier2 (Editor of CJEC in 1990), Dr. Eugene Borokhovski3 for help with this manuscript, and Lucie Ranger for assistance with editing and proofreading. I also thank an anonymous CJLT reviewer for insightful comments and suggestions for
improvement. The author wishes to acknowledge the support of the Social Sciences and
Humanities Research Council of Canada for grants that have supported parts of this work over the years.
References
Abrami, P. C., & Bernard, R. M. (2006). Research on distance education: In defense of field experiments. Distance Education, 27(1), 5-26. doi:10.1080/01587910600653082
Abrami, P. C., & Bernard, R. M. (2013). Statistical control versus classification of study quality in meta-analysis. Effective Education, 4(1), 43-72. doi: 10.1080/19415532.2012.761889 Abrami, P. C., Bernard, R. M., & Wade, C. A. (2006). Affecting policy and practice: Issues
involved in developing an Argument Catalogue. Evidence & Policy: A Journal of Research, Debate and Practice, 2(4), 417–437. doi: 10.1332/174426406778881737 Bethel, E. C., & Bernard, R. M. (2010). Developments and trends in synthesizing diverse forms
of evidence: Beyond comparisons between distance education and classroom instruction. Distance Education, 31(3), 231-256. doi:10.1080/01587919.2010.513950
1 Dr. Som Naidu is Principal Associate for Technology, Education and Design Associates (an independent consulting firm) and Executive Editor of the Taylor and Francis journal Distance Education.
2 Dr. Richard Schwier is a Professor and Head in the Department of Curriculum Studies at the University of Saskatchewan.
3 Dr. Eugene Borokhovski is Manager of the Systematic Review Team, Centre for the Study of Learning and Performance, Concordia University.
Bernard, R. M., Abrami, P. C., Borokhovski, E., Wade, A., Tamim, R., Surkes, M., & Bethel, E. C. (2009). A meta-analysis of three interaction treatments in distance education. Review of Educational Research, 79(3) 1243-1289. doi: 10.3102/0034654309333844
Bernard, R. M., Abrami, P. C., Lou, Y., Borokhovski, E., Wade, A., Wozney, L., Wallet, P. A., Fiset, M., & Huang, B. (2004). How does distance education compare to classroom instruction? A Meta-analysis of the empirical literature. Review of Educational Research, 74(3), 379-439. doi: 10.3102/00346543074003379
Bernard, R. M., & Naidu, S. (1990). Integrating research into instructional practice: The use and abuse of meta-analysis. Canadian Journal of Educational Communication, 19(3), 171-195. Retrieved from http://www.cjlt.ca/index.php/cjlt/article/view/277/211
Borenstein, M., Hedges, L. V., Higgins, J. P. T., & Rothstein, H. R. (2009). Introduction to meta-analysis. Chichester, UK: Wiley.
Campbell, D., & Stanley, J. C. (1963). Experimental and quasi-experimental designs for research. Chicago, IL: Rand McNally.
Cavanaugh, C. (2013). Student achievement in elementary and high school. In M. G. Moore (Ed.) Handbook of Distance Education, Third Edition (pp. 170-184). New York, NY: Routledge.
Cheung, A. C., & Slavin, R. E. (2013). The effectiveness of educational technology applications for enhancing mathematics achievement in K-12 classrooms: A meta-analysis. Educational Research Review, 9, 88-113. doi:10.1016/j.edurev.2013.01.001
Clark, R. E. (1983). Reconsidering research on learning from media, Review of Educational Research, 53(4), 445–459. doi:10.3102/00346543053004445
Clark, R. E. (1994). Media will never influence learning. Educational Technology Research & Development, 42(2), 21–29. doi:10.1007/BF02299088
Cresswell, J. R. (2009). Qualitative inquiry and research design: Choosing among five approaches (Third Edition). San Francisco, CA: Sage.
Glass, G. V. (1976). Primary, secondary and meta-analysis of research. Educational Researcher, 5(10), 3-8. 10.3102/0013189X005010003
Guskey, T. R., & Gates, S. L. (1986). Synthesis of research on the effects of mastery learning in elementary and secondary schools. Educational Leadership, 43(8), 73-80. Retrieved from
http://www.ascd.org/ASCD/pdf/journals/ed_lead/el_198605_guskey.pdf
Jackson, G. B. (1980). Methods for integrative reviews. Review of Educational Research, 50, 438-460. doi: 10.3102/00346543050003438
Li, Q., & Ma, X. (2010). A meta-analysis of the effects of computer technology on school students’ mathematics learning. Educational Psychology Review, 22, 215-243. doi: 10.1007/s10648- 010-9125-8
Liao, Y-l., & Chen, Y-w. (2005). Computer simulation and students' achievement in Taiwan: A meta-analysis. In P. Kommers & G. Richards (Eds.). Proceedings of World Conference on Educational Multimedia, Hypermedia and Telecommunications (pp. 40-46). Chesapeake, VA: AACE.
Lipsey, M. W. (2003). Those confounded moderators in meta-analysis: Good, bad, and ugly. The ANNALS of the American Academy of Political and Social Science, 587, 69-81. doi:
10.1177/000271620225079
Lysakowski, R. S., & Walberg, H. J. (1982). Instructional effects of cues, participation, and corrective feedback: A quantitative synthesis. American Educational Research Journal, 19(4), 559-578. doi: 10.3102/00028312019004559
Pearson K. (1904). Report on certain enteric fever inoculation statistics, British Medical Journal, 3, 1243-1246.
Petticrew, M., & Roberts, H. (2003). Evidence, hierarchies, and typologies: Horses for courses. British Medical Journal, 57(7), 527–529. doi: 10.1136/jech.57.7.52
Rosen, Y., & Salomon, G. (2007). The differential learning achievements of constructivist technology-intensive learning environments as compared with traditional ones: A meta-analysis. Journal of Educational Computing Research, 36(1), 1-14. doi: 10.2190/R8M4-7762-282U-445J
Rothstein, H. R., Sutton, A. J., & Borenstein, M. (Eds.) (2005). Publication bias in meta-analysis – Prevention, assessment and adjustments. Chichester, UK: Wiley.
Scammacca, N., Roberts, Greg, & Stuebing, K. K. (2013). Meta-analysis with complex research designs: Dealing with dependence from multiple measures and multiple group
comparisons. Review of Educational Research, Online First. doi: 10.3102/0034654313500826
Schmid, R. F., Bernard, R. M., Borokhovski, E., Tamim, R. M., Abrami, P. C., Surkes, M. A., Wade, C. A., & Woods, J. (2014). The effects of technology use in postsecondary education: A meta-analysis of classroom applications, Computers & Education, 72, 271-291. doi: 10.1016/j.compedu.2013.11.002
Schroeder, C. M., Scott, T. P., Tolson, H., Huang, T., & Lee, Y. (2007). A meta-analysis of national research: The effects of teaching strategies on student achievement in science. Journal of Research in Science Teaching, 44, 1436-1460. doi: 10.1002/tea.20212 Shachar, M., Neumann, Y. (2003). Differences between traditional and distance education
academic performance: A meta-analytic approach. International Review of Research in Open and Distance Learning, 4(2). Retrieved from
http://www.irrodl.org/index.php/irrodl/article/view/153/704
Slavin, R. E. (1987). Mastery learning reconsidered. Review of Educational Research, 57(2), 175-213. doi:10.3102/00346543057002175
Slavin, R. E., Lake, C., Hanley, P., & Thurston, A. (2012). Effective programs for elementary science: A best-evidence synthesis. Baltimore, MD: Center for Research and Reform in Education. Retrieved from
http://www.bestevidence.org/word/elem_science_Jun_13_2012.pdf
Tamim, R. M., Bernard, R. M., Borokhovski, E., Abrami, P. C. & Schmid, R. F. (2011). What forty years of research says about the impact of technology on learning: A second-order meta-analysis and validation study. Review of Educational Research. 81(3), 4-28. doi: 10.3102/0034654310393361.
Valentine, J. C. & Cooper, H. (2008). A systematic and transparent approach for assessing the methodological quality of intervention effectiveness research: The Study Design and Implementation Assessment Device (Study DIAD). Psychological Methods, 13(2), 130-149. doi: 10.1037/1082-989X.13.2.130
What Works Clearinghouse. (2014). WWC procedures and standards handbook (version 3.0). Princeton, NJ: US Department of Education, Institute of Education Sciences. Available at
http://ies.ed.gov/ncee/wwc/DocumentSum.aspx?sid=19
Author
Robert M. Bernard Ph.D. is professor of education and Systematic Review Team Leader for the Centre for the Study of Learning and Performance (CSLP) at Concordia University. His research interests include distance and online learning and instructional technology. His methodological expertise is in the areas of research design, statistics and meta-analysis.
The CSLP systematic review team has published four meta-analyses in Review of Educational Research since 2004, six additional meta-analyses and systematic reviews in major research journals plus more than a dozen articles on various aspects of research and meta-analysis
methodology. Members of the team have also conducted seminars, workshops and short courses for the Campbell Collaboration and in a number of research centers and universities in Canada, the United States and Europe and received awards for their outstanding contributions to research in educational technology. Email: bernard@education.concordia.ca.