M. Filippini, F. Heimsch, G. Masiero
Antibiotic consumption and the role of
dispensing physicians
Antibiotic consumption and the role of dispensing
physicians
M. Filippini
F. Heimsch
yG. Masiero
zMarch 2013
Abstract
Regulation of prescription and dispensing of antibiotics has a twin purpose: to enhance access to antibiotic treatment and to reduce inappropriate use of drugs. Nev-ertheless, incentives on antibiotics to dispensing physicians may lead to ine¢ ciencies. We model the interaction between competing physicians (with and without dispensing of drugs) and patients exposed to bacterial infections when antibiotic treatment gen-erates spatial consumption externalities. Then, we empirically investigate the impact of dispensing practices on antibiotic consumption by means of combined spatial-lag and spatial-error econometric estimators for panel data (SARAR). The investigation exploits data from small geographic areas in a country where both regimes - with and without dispensing physicians - are possible. We …nd evidence that dispensing prac-tices increase antibiotic use after controlling for determinants of demand and access, and spatial e¤ects. This suggests that health authorities have a margin to adjust economic incentives on dispensing practices in order to reduce antibiotic misuse.
JEL classi…cation: I11; I18; D12; D21; D43; D81; D82
Keywords: Physician dispensing, Prescribing behaviour, Antibiotic use.
Department of Economics, University of Lugano; ETH, Zurich, Switzerland.
yETH, Zurich, Switzerland.
zUniversity of Bergamo, Italy; Department of Economics, University of Lugano, Switzerland.
Corre-sponding author. Tel.: +41 058 666 4731; fax: +41 058 666 4733. E-mail address : [email protected]. Support from the Swiss National Science Foundation is acknowledged. We are grateful to Karine Moschetti for invaluable collaboration on early stages of this research. We also thank IMS Health Switzerland for providing data on antibiotic sales.
1
Introduction
Prescribing and dispensing of drugs are the two primary aspects of access to primary health care. In most developed countries, the main role of family physicians is to prescribe drugs without direct dispensing. Doctors are not allowed to sell drugs directly to their patients in several OECD countries such as Italy, Germany and Scandinavian countries. Still, di-rect dispensing of drugs is possible within some countries. For instance, one Scottish region (Highland) includes almost 20% of the total number of dispensing doctors in Scotland (Infor-mation Services Division of the National Health System in Scotland, 2006). In Switzerland, physicians are allowed to sell drugs directly to their patients in most cantons, with some exceptions across the country.
The reason for separating drug prescribing and dispensing is to optimise drug treat-ment by avoiding a con‡ict of interest for the prescriber and by ensuring good practice in dispensing (Trap and Hansen, 2003). Since dispensing physicians may have an incen-tive to induce drug consumption in order to increase their revenues, it is suggested that a regulatory policy that allows physicians to sell drugs directly to the patient may lead to sub-optimal levels of drug consumption (Chou et al., 2003; Holloway, 2005; Morton-Jones and Pringle, 1993; Nelson, 1987). Abood (1989) shows that dispensing doctors charge higher retail prices, whereas Rischatsch and Trottmann (2009) suggest that dispensing physicians have a greater probability of prescribing drugs that o¤er high margin, when compared with non-dispensing physicians.
Nevertheless, the bene…ts of separating drug prescribing and dispensing are still unclear. Direct dispensing of drugs may increase patients’ bene…ts because of improved access to drug treatment in areas where geographical barriers represent a problem. Moreover, there are important external e¤ects of consumption which a¤ect, in particular, the optimal use of anti-infective drugs. Among these drugs, consumption externalities are certainly relevant for antibiotics. These externalities can be summarized by the e¤ect of bacterial resistance, which reduces antibiotic e¤ectiveness, and the e¤ect of infection prevention, which extends bene…ts from antibiotic use to other individuals (Rudholm, 2002). The recent literature on antibiotic manufacturers suggests, for instance, that incentives for pharmaceutical …rms to minimise resistance are not optimal since companies enjoy a too short period of monopoly bene…ts from their antibiotic e¤ectiveness (Herrmann, 2010). As with respect to the re-tailing market, the bene…ts of good prescribing practices and low levels of resistance to antibiotics generated by the separation of drug prescribing and dispensing must be weighed
against the costs of limited access and low levels of infection prevention.
The purpose of this article is to explore the role of practice regulation in enhancing access to antibiotic treatment and in reducing inappropriate use of antibiotics. We …rst propose a theoretical model to investigate the behaviour of di¤erent types of general prac-titioners in a competitive environment with imperfect information on the nature of patient infections. The goal of the theoretical model is to provide some insights and hypothesis on the prescribing behaviour of dispensing and not dispensing practices. For this reason we propose a full theoretical model rather than a reduced form model that can be directly estimated afterwards. The hypothesis derived by the theoretical model are then tested empirically.
We apply an in…nite-periods horizontal product di¤erentiation model (Hotelling, 1929) to the market for community antibiotic treatment by incorporating imperfect information about the type of infection, diagnosis errors and alternative treatments under a fee-for-service remuneration scheme for physicians. The market for outpatient antibiotic treatment we have in mind applies, for instance, to Switzerland where doctors receive a consultation fee which varies depending on the time allocated to the patient and the diagnostic tests performed. In such a case, dispensing doctors may include additional costs for drugs avail-able with them in stock and gain a margin on antibiotics sold to the patient. We show that the interaction between imperfect information on the nature of a patient’s infection and economic incentives to dispensing practices may increase the likelihood of antibiotic prescriptions, ceteris paribus. The rationale is that self-dispensing physicians may increase their revenue by selling more antibiotics under uncertainty on the nature of a patient’s infection. To some extent, this e¤ect may overcome the opposite e¤ect of restrictions on antibiotic use due to di¢ culties in access to health care treatment in areas where the density of providers is relatively poor.
In the health economics literature, we are not aware of any theoretical approach to the behaviour of dispensing practices that considers competition among physicians under un-certainty on the nature of patient’s infection and spatial aspects of drug consumption. Two studies (Liu et al., 2009; Rischatsch and Trottmann, 2009) investigate physician prescrib-ing decisions in the choice between generic and brand-name drugs. Though, these studies assume that physicians act as monopolists and spatial aspects are neglected. Recently, Brekke, Holmas and Straume (2011) applied a vertical di¤erentiation model to analyze the impact of regulation on prices and market shares of brand-names and generic drugs.
empirically, we use a demand model which takes into account the main determinants of antibiotic use. Moreover, we consider spatial aspects of consumption by means of an ap-propriate econometric estimator. We exploit data from small geographical areas in a country (Switzerland) where two regimes - prescribing physicians and dispensing physicians - are possible, which provides the ground for a natural experiment. Related to this exercise is the study by Windmeijer et al. (2006) who investigate the impact of promotional activities by pharmaceutical companies on GP prescription behaviours. The authors suggest that prescriptions are positively a¤ected by promotion expenditure but do not consider di¤er-ent types of practices and focus on the market of anti-hyperthensives and anti-depressant. Also, Trap and Hansen (2002) examine di¤erences in the rationality of the prescription in relation to diagnosis and symptoms between dispensing and non dispensing doctors for one antibiotic substance (cotrimoxazole). Since dispensing doctors are found to prescribe an antibiotic 2.5 times more frequently than non dispensing doctors, the authors conclude that dispensing practices may lead to increasing health hazards and bacterial resistance. The authors do not account for access and consumption externalities.
Two previous empirical papers on the consumption of antibiotics relate to the current study, primarily because they exploit the same dataset although they address di¤erent research questions. Filippini et al. (2009a) investigate socioeconomic determinants of out-patient antibiotics across small areas in Switzerland. However, this paper neglects the prescribing behaviour of di¤erent types of practices, which is the focus of the present pa-per. Filippini et al. (2009b) model the demand for di¤erent antibiotic classes used for respiratory infections rather than the demand for total antibiotic consumption. The au-thors investigate elasticities to socioeconomic determinants of consumption and own- and cross-price elasticities between di¤erent groups of antibiotics.
Although one can hardly identify the socially optimal level of antibiotics empirically, it is advisable to adjust for external e¤ects when investigating the behaviour of di¤erent types of practices. Spatial aspects of consumption are generally disregarded in empirical studies on drug prescription and consumption. Nonetheless, antibiotic drugs are generally used to treat respiratory and gastrointestinal infections which are among the most common infectious diseases acquired in the community. As discussed by Hess et al. (2002), these infections are characterized by a spreading process across regions, i.e. the infection initiates in one region and then spreads across other regions. As an example of the spatial spread of an infection see, for instance, Werneck et al. (2002). Spatial-econometric estimators in health economics have been recently applied by Lachaud (2007), Moscone et al. (2007),
and Moscone and Tosetti (2010a, 2010b). Moscone et al. (2007) and Moscone and Tosetti (2010a, 2010b) empirically investigate the determinants of regional health expenditures in the US and in England using panel data. Both studies suggest the importance of taking spatial aspects into account when modelling the utilization of health care services. We are aware of only one study investigating spillover e¤ects of antibiotic consumption using Italian regional data (González Ortiz and Masiero, 2013).
The remaining of the article is organized as follows. In Section 2 we sketch the model and derive the equilibrium levels of antibiotic use for dispensing and non dispensing practices. Section 3 empirically investigates the impact of dispensing practices on antibiotic use and discusses the results. Section 4 concludes.
2
The theoretical framework: antibiotic treatment in general
practice
Our model of the market for antibiotic treatment provided by primary care physicians (GPs) is an application of the standard Hotelling product di¤erentiation model (Hotelling, 1929; Gravelle, 1999) in an in…nite-period framework. We incorporate new features, such as im-perfect information about the nature of the infection, doctor’s diagnosis errors, alternative types of treatment, and antibiotic consumption externalities. We focus on the interaction between patients and general practitioners in an in…nite-period model when anti-infective treatment is needed.1
At the beginning of each period, nature assigns a health problem (e. g. mild respiratory or gastro-intestinal infection), i 2 fb; vg, to each of the 2 individuals uniformly distributed along a unit line, where b is a bacterial infection and v represents a viral infection.2 Con-sumers initially observe a symptom but cannot infer the type of infection they su¤er from. To simplify the presentation, we assume that both types of infections are equally likely. Hence, the probability of having a bacterial infection is p = p[i = b] = p[i = v] 1=2. Each generation of consumers lives for two periods. Therefore, in each period there is a mass of 2 consumers: a mass y composed of young consumers and a mass o composed of old consumers. The proportion of young consumers entering the market and the proportion of old consumers leaving the market in each period are the same, with y = o = . As an
1
Anti-infective is a general term that encompasses antibacterials, antibiotics, antifungals, antiprotozoans and antivirals. In this paper we focus on the choice between antibacterials and antivirals and the terms antibacterials and antibiotics are used interchangeably.
2
Dichotomous health problems are considered, for instance, in Jelovac (2001) where patients have the same probability of su¤ering from a “mild” illness as well as from a “severe” one.
exception, in the …rst period there is only one generation of consumers, , and all of them are young.
Individuals maximise their expected utility from consulting a doctor. In the market there are 2 general practice …rms (GP j, with j 2 [l; r]) of equal size, located at the two extreme points of the distance. General practitioners can either be allowed to sell drugs directly to their patients or not, depending on the legislative frame set by the health au-thority. In the latter case patients need to purchase the prescribed drugs from a pharmacy, which is located equidistantly from each practice, i.e. at d = 1=2.3
Patient’s choice of a doctor depends on the perceived level of diagnosis accuracy. Pa-tients di¤er with respect to their location and the type of infection. Hence, a patient is located at distance dl from practice l and at distance dr = 1 dl from practice r. The
di¤erentiation parameter d can either be interpreted as a geographical distance between the individual and the provider location, it could be the distance between the individual’s preferences and the characteristics of the provider that maximises his utility.
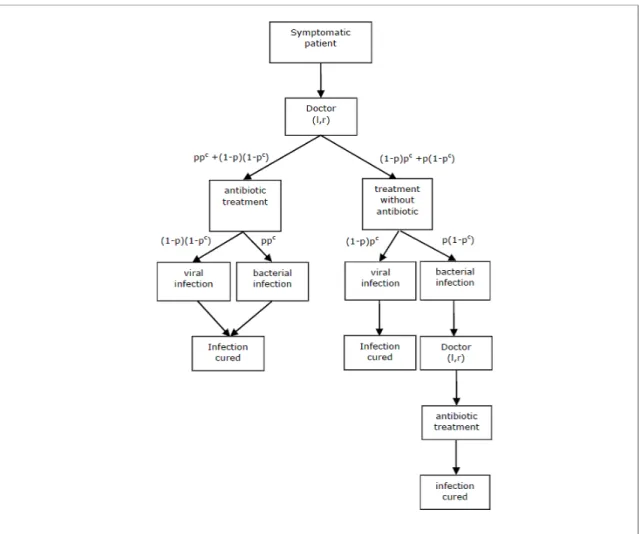
Following patients’choice of a practice, doctors make prescriptions based on a diagnosis signal. However, patients recover naturally from viral infections soon after a consultation. The scenario is illustrated in Figure 1. This scenario applies, for instance, to mild respiratory tract infections in the community, such as colds, rhynofaringites, mild pneumonia and otitis. In these cases, a treatment undertaken using healing drugs, suitable for instance to reduce body temperature (e.g. antipyretic or anti-in‡ammatory), cough (e.g. syrup) or nose constipation (e.g. spray), generally decreases the cost of illness because it o¤ers quicker recovery and/or less discomfort. This type of treatment (NA) is usually prescribed and is independent of any antibiotic treatment. Conversely, treatment with antibiotics (A) is necessary to recover from a bacterial infection. However, antibiotics do not provide any bene…t against viral infections. Since a doctor’s diagnosis may not be initially correct, a second consultation is required later if the patient su¤ers from a bacterial infection and an antibiotic was not previously prescribed.
2.1 Information structure
The accuracy of a GP’s prescription is related to the level of diagnostic services provided. We de…ne pcj 2 [0; 1] as the probability of a correct diagnosis by GP j. More diagnostic services increase the probability of a correct diagnosis through the following simple
rela-3This implies that patients do not incur additional costs of transportation to buy drugs after a
tionship pc
j(ej) = ej, where ej represents the level of diagnostic services provided by the
practice and 2 [0; 1] is a parameter. Consequently, the probability that the diagnosis is a bacterial infection and an antibiotic is correctly prescribed is ppcj = 12 ej. The probability
of mistaken diagnosis will then be 12(1 ej). We assume that doctors rely on diagnostic
tests to decide upon the type of treatment to be prescribed. Alternatively, we could assume that doctors share the results of diagnostic tests with patients and cannot cheat on this information.
Patients are imperfectly informed about the level of diagnostic services (ej) provided
by the practice. They assume that the level of diagnostic services is ej 2 emin; emax ,
with emin and emaxequally likely. Consequently, patients expect an average level of services ^
ej = 12emin+ 12emax e. We normalise ej to 1= and set emin = 0 and emax= 1= .
Patients are aware that higher intensity of diagnostic services increases the probability of a correct prescription but don’t know the true level of ej. They ask for a second consultation
if they do not recover within some time from the initial consultation.
2.2 Expected net bene…ts of care
Primary health care services are covered by compulsory health insurance contracts and patients pay only a small fraction ( ) of the total cost of care. General practitioners are paid under a pure fee-for-service scheme. The health care system we have in mind is akin to the Swiss market for outpatient care. In this system, a consultation with a doctor is usually characterized by a …xed fee (f ) plus the cost of any prescribed drugs. Treatment with antipyretic/anti-in‡ammatory drugs is assumed not to vary with the type of infection; the cost of this treatment is set to zero. On the other hand, a course of treatment with antibiotics has a …xed cost of z (z < f ). In Switzerland, patients copayments depends upon the type of insurance plan chosen since di¤erent deductible schemes are available. However, to simplify the analysis, we assume that the level of patients cost sharing does not vary across patients.
Patients incur distance costs tdj to purchase services from provider j, where t is the unit
cost of distance. We summarise the costs implied by alternative treatments conditional upon the type of infection in Table 1. A treatment without antibiotics is denoted by N A. For instance, consider a patient with a viral infection consulting doctor j. If the GP decides to prescribe an antipyretic/anti-in‡ammatory without an antibiotic, the total cost of treatment includes the partial cost of a consultation ( f ), plus the cost of distance (tdj). This gives
of treatment increases by z since an antibiotic is prescribed (second row of Table 1). The total cost will then be (f + z) + tdj.
A fully recovered patient has utility uh> 0 de…ned in monetary terms. Consumers are myopic in that only diagnosis e¤ort in the current period is considered. Using Table 1 we can write the expected net bene…ts from choosing doctor j as
^ uj = uh 1 2 e^j( f + tdj + t x) 1 2 e^j( f + z + tdj+ t x) 1 2(1 e^j) ( f + z + tdj+ t x) 1 2(1 e^j) (2 f + z + 2tdj+ 2t x) = uh 1 2[(3 e) ( f + tdj+ t x) + (2 e) z] . (1)
The terms inside the brackets of equation (1) indicate the costs of treatment when a viral infection is correctly diagnosed (…rst term), a bacterial infection is correctly diag-nosed (second term), a viral infection is wrongly diagdiag-nosed and an antibiotic is prescribed (third term), and a bacterial infection is wrongly diagnosed so that patients need a sec-ond consultation (fourth term).4 Since patients purchase drugs from the pharmacy located halfway from the two GP practices, patients bear the additional cost of distance t x, where x =j xj xP HAj= 1=2 is the distance that patients need to travel from the chosen practice
j to the pharmacy (P HA). When patients need a second consultation because of wrong diagnosis, the cost of distance to the pharmacy doubles (2t x). Finally, x = 0 when GP practices are allowed to dispense drugs directly to the patients.
2.3 Demand for GP consultations by young patients
The structure of patients’ information implies that a patient’s choice of practice is based upon costly distance.5 Patients at distance dl 1=2 from GP l will prefer to consult GP l
instead of GP r. Similarly, patients with distance dl> 1=2 will choose GP r.
4
Note that patients do not consider the possibility of switching to an alternative practice when a bacterial infection is wrongly diagnosed. The fourth term of equation (1) indicates that patients consult the same doctor twice if needed. This assumption seems plausible given the very short period between two sequential consultations (see footnote 8 for further details). Many spatial papers (e.g. Brekke et al., 2010) neglect switchings among …rms when their implications are beyond the scope of the analysis. Also, patients are assumed to be myopic in the sense that they maximise utility to recover from current infections only and do not take future choices into account.
5Brekke, Nuscheler and Straume (2006, 2007) assume that a proportion of patients is uninformed and
chooses a doctor according to distance. Gravelle and Masiero (2000) assume that patients observe practice quality with an error and then learn by experience. These models focus on capitated systems rather than fee-for service. Our assumption is useful to simplify the model and to focus on a patient’s alternative strategies rather than the e¤ects of competition among providers. We then ignore the impact of a patient’s information structure on the choice of practice.
Doctor j’s initial demand for consultations by young patients in period t is then =2. Note that one implicit assumption of this demand is that the market is always covered. This requires that the expected net bene…ts in (1) are positive for those patients located halfway from the two practices, whatever the level of diagnosis accuracy. We then hypothesize that uh is large enough to ensure ^u(d = 1=2; e 0) > 0.6
Patients with a bacterial infection who receive a wrong diagnosis need an additional consultation to switch to antibiotic treatment. These patients realise that the infection has not been cured at some time after the …rst consultation. All these patients have now strong preference for antibiotic treatment. Total demand for consultations of GP l by young consumers in each period is then derived by adding the number of patients who need a second consultation to the initial number of consultations:7
Dylt(elt) =
2 1 + 1
2(1 elt) , (2)
where 12(1 elt) is the proportion of patients with a bacterial infection who need a second
consultation because of wrong diagnosis. Similarly, we can write the demand for GP r as Dyrt(ert) = [1 + (1 ert)=2] =2.
2.4 Prevention and bacterial resistance externalities
At the beginning of each period, nature assigns a health problem to old patients in the mar-ket, like for young patients. However, old patients present a lower probability of infection because they have been exposed to antibiotics prescribed in the previous period. As a con-sequence, they bene…t from the preventive e¤ect of antibiotic use (Ellison and Hellerstein, 1999). We assume that the number of old patients with an infection decreases by a propor-tion 2 [0; 1] of the number of young patients (now the old patients) receiving antibiotics in the previous period (from both practices). This can be derived from (2) considering that only half of the initial number of consultations by young patients from each GP lead even-tually to an antibiotic prescription and some of the young patients also receive antibiotics because of wrong diagnosis. The number of young patients receiving antibiotics from both
6The assumption is quite realistic for the Swiss market for primary care, where the costs of access in
rural areas are not such as to exclude some individuals from receiving antibiotic treatment. Even though the costs of access may generate some delay in receiving prompt treatment, individuals with bacterial infections must consult a general practitioner to purchase antibiotics and recover.
7
Patients may be disappointed because of health complications or loss of revenue due to antibiotic treatment delay. However, dissatisfaction does not lead patients to switch practices. The rationale is that patients are still sick and now expect to receive antibiotic treatment from any practice. Consequently, expected utility from any practice is the same and switching costs associated to time and trouble to leave a doctor and …nd another are higher than zero.
practices in the previous period is Dt 1Ay(elt 1; ert 1) = DAylt 1+DAyrt 1= D y lt 1+D
y
rt 1 =2.8
Consequently, a proportion of individuals Dt 1Ay is healthy in the second period and does not need to consult a doctor.
Total demand for consultations for GP l in each period t can then be written by summing up the demand for consultations by young and old patients as
Dlt(elt; elt 1; ert 1) = Dylt+ 2 D Ay t 1 1 + 1 2(1 elt) : (3)
The term 12(1 elt) within the squared brackets in (3) is the fraction of old patients with
a bacterial infection who need a second consultation because of wrong diagnosis. Note that diagnosis e¤ort in period t 1 a¤ects demand in the following period through Dylt 1. Total second-period demand for GP r can be derived similarly as above.
Note that dissatisfaction with antibiotic treatment delay does not lead patients to switch practices when old. Patients switching to alternative practices because of dissatisfaction is not an issue in our model. This seems plausible given the set of information available to the patient. Patients can hardly disentangle whether antibiotic treatment delay was due to a wrong diagnosis or to the need to avoid unnecessary treatment and bacterial resistance. Under uncertainty, practitioners can easily argue that their initial prescription was the most appropriate. Hence, we focus on the impact of key features of antibiotic consumption, i.e. externalities due to prevention and bacterial resistance.
The use of antibiotics in period t 1 reduces the e¤ectiveness of antibiotic treatment in the following period because bacterial resistance causes a negative externality. We capture this e¤ect by assuming that practices face increasing costs to cure patients with resistant bacteria. Bacterial resistance a¤ects antibiotic e¤ectiveness in the following period and depends on patients previously treated with antibiotics. We summarise the total costs of bacterial resistance for GP l as Dt 1Ay = Dylt 1+ Dyrt 1 =2 , where is the cost generated by each young patient treated with antibiotics in the previous period.9
8
Adding the number of patients with a viral infection who receive an antibiotic because of wrong diagnosis,
2 1
2(1 ejt 1), to the total number of young patients with a bacterial infection, =2, we get (D y
jt 1 =4).
Considering both GPs, l and r, the total number of young patients receiving antibiotics is then (Dlty 1 =4) + (Dyrt 1 =4).
9The parameter can also be interpreted as the value of providing good care to patients. Indeed, better
diagnostic services in t 1 reduce inappropriate antibiotic prescriptions and, consequently, reduce future risks for patients.
2.5 The physician’s objective function
The general practitioner has an objective function which depends upon the bene…ts and costs of diagnostic services provided in each period and the costs generated by the re-duced antibiotic e¤ectiveness due to bacterial resistance. Using (3) we can write GP l’s intertemporal pro…t at time t as
Vlt = 1 X t=k t k lt(elt; elt 1; ert 1) (4) = 1 X t=k t kh(f c) D lt(elt; elt 1; ert 1) Dt 1Ay (elt 1; ert 1) e2lt i ,
where 2 (0; 1] is the discount factor for future pro…ts, c is the …xed marginal cost of a consultation (c < f ) and is the marginal cost of diagnostic services. Note that Dl1= Dl1y
since there are only young consumers in the market, and Dl0y = 0.
Dispensing physicians may di¤er from other practitioners for at least two reasons. Doc-tors may incur some costs when keeping drugs on stock. In this sense they are more similar to a pharmacy than to non-dispensing practices. A shortage of stock implies risks in case patients are unable to receive the required treatment when needed. On the other hand, large stocks of drugs that have been hoarded increase the risk of getting closer to the expiry date. Unsold drugs may imply some costs for the practice.
In Switzerland, dispensing physicians get a mark-up on drugs prescribed. Obviously, dispensing doctors are subject to pressure from pharmaceutical companies to increase pre-scriptions to the same extent as other doctors.10
We modify the objective function of the general practitioner de…ned by (4) to include the expected costs and bene…ts of self-dispensing as
Vltd = 1 X t=k t k (f c) D lt(elt; elt 1; ert 1) + (z ) DAlt(elt; elt 1; ert 1)+ (5) DAyt 1(elt 1; ert 1) e2lt i ,
where DAlt = Dlt ( Dt 1Ay)=2 is the number of antibiotic treatments in period t. The
number of antibiotic treatments sold is obtained by summing up the number of young and old patients with a bacterial infection (correctly diagnosed) plus the number of individuals with a viral infection with a wrong diagnosis, and the number of patients who require a
1 0
Windmeijer et al. (2006) …nd that GP prescription behaviour is a¤ected by pharmaceutical promotion but the magnitude of this e¤ect is not assessed separately for dispensing and prescribing doctors.
second consultation because a bacterial infection was not initially diagnosed.11 z is the unit
price of drugs dispensed to the patient and z represents the unit cost of drugs on stock. We simplify equations (4) and (5) by setting c = 0 and = 0. This is a convenient normalization to ease the discussion of the results in the following section without losing any substance.
2.6 Market equilibrium and the e¤ect of dispensing practices
Practice …rms can change their e¤ort strategies over time. They take their competitors’ strategies as given and non-cooperatively maximize their pro…ts by choosing the level of diagnostic services. When choosing diagnosis e¤ort …rms not only take into account the e¤ects on their current period pro…ts but also on their demand and costs (bacterial re-sistance) in the following periods. This dependence needs to be taken into account when solving the model for the equilibrium levels of diagnostic e¤orts. Pro…ts in period t depends upon diagnostic services in period t 1 by both GPs. Also, the value function represented by the ‡ow of all future pro…ts depends on all future levels of diagnosis e¤ort. Conse-quently, an equilibrium has to ensure that deviations from current period levels of e¤ort in the future are not convenient. We require a perfect equilibrium, i.e. each GP selects the diagnosis e¤ort that maximizes its intertemporal pro…t given the subsequent strategies of the other GP and itself, whose strategies depend only on the payo¤-relevant history (Maskin and Tirole, 1988). Our pair of reaction functions (Rl and Rr) form a Markov
perfect equilibrium if elt = Rl(ert 1) maximizes GP l’s intertemporal pro…t at any time,
given ert 1 and assuming that GP l will move according to Rl, and the same holds for
GP r. To solve for a Markov perfect equilibrium, let Vld(er) be the present discounted
value of GP l’s pro…ts given that last period GP r played er and that from this time
forth both GPs play optimally, i.e. according to their Markov strategies, and let Vd l (el) be
the present discounted value of GP l’s pro…ts given that last period GP l played el and
that hereafter both GPs play optimally. Vrd(el) and Vrd(er) are symmetric. Given that
GP j’s choice of ej is restricted to a bounded set, the following are necessary and su¢
-cient conditions for the reaction and value functions to be consistent and correspond to an equilibrium: Vd l (er) = maxe l d l(el; er) + Vld(el) = dl(Rl(er); er) + Vld(Rl(er)) and Vld(el) = dl(el; Rr(el)) + Vld(Rr(el)). 1 1
From total demand for consultations, Dlt, we subtract the number of patients with a correct diagnosis
not treated with antibiotics. These are =4 young patients with viral infections and =2 DAyt 1 =2old
Because diagnosis e¤ort a¤ects pro…ts in two subsequent periods and expected pro…ts are the sum of concave functions in elt, we can write the following …rst-order conditions for
GP l - the dynamic reaction function - using (5) as:
@Vltd @elt = @ d lt(elt; elt 1; ert 1) @elt + @ d lt+1(elt+1; elt; ert) @elt (6) = f " @Dlt elt; elt 1; ert 1 @elt + @Dlt+1 elt+1; elt; ert @elt # + + z " @DltA elt; elt 1; ert 1 @elt + @D A lt+1 elt+1; elt; ert @elt # + @DtAy(elt; ert) @elt 2 elt= 0
and symmetrically for GP r.12 Substituting for @Dlt=@elt, @Dlt+1=@elt, @DAlt=@elt, @Dlt+1A =@elt,
and @DtAy=@eltin (6) and solving for the level of diagnostic services assuming for simplicity
= 1 and imposing @Vd
lt=@elt= @Vlt+1d =@elt+1 = 0 and @Vrtd=@ert = @Vrt+1d =@ert+1 = 0, we
then get13
Proposition 1 A symmetric Markov perfect equilibrium in the level of diagnostic services is de…ned by el = er = 7 4 1 f + 1 2 (1 3 2 )z 3 4 (f + z) + 4 . (7)
As expected, the equilibrium level of diagnostic services decreases with the marginal cost of e¤ort ( ). Diagnostic services may decrease or increase with the fee for the consultation (f ), depending on the magnitude of the prevention e¤ect of antibiotic consumption ( ). Without positive externalities from antibiotic consumption ( = 0), the equilibrium level of diagnostic services decreases with the fee for the consultation. This is because a higher fee increases the marginal gains from consultations. Consequently, there are more incentives to reduce the diagnosis e¤ort, which reduces diagnosis accuracy and increases the number of consultations.
The impact of positive and negative externalities from antibiotic consumption deserve some comments. Note that negative externalities caused by bacterial resistance ( ) increase
1 2The second-order conditions are @Vlt2
@2elt = 2 < 0. 1 3Using (2) and (3) we get @Dlt
@elt = 2 D Ay t 1 = 2 1 1 4 (elt 1+ ert 1) and @Dlt+1 @elt = 1 +12(1 elt+1) @DAyt @elt . Since @DAyt @elt = 4 we then get @Dlt+1 @elt = 4 1 + 1 2(1 elt+1) . We have @DA lt @elt = @Dlt @elt and @DAlt+1 @elt = @Dlt+1 @elt 1 2 @DtAy @elt = 4 1 2elt+1 .
the equilibrium level of diagnostic services. If the cost of treating patients increases because of resistant bacteria, a higher level of diagnostic services is required to reduce the number of misdiagnosed viral infection and, consequently, the amount of antibiotic prescriptions in previous periods. An increase in diagnosis accuracy lowers the amount of inappropriate prescriptions that contribute to the generation of resistant bacteria. Note also that positive externalities of antibiotic use that decrease the fraction of infected patients in period t + 1 have a two-fold e¤ect. First, decreases the demand for consultations in period t + 1. As a consequence, a higher level of diagnostic services is required to reduce the number of antibiotic prescriptions in period t that generate a negative e¤ect on doctor’s revenues in period t + 1 (the numerator of equation (7)). But second, an increase in also decreases the fraction of misdiagnosed infections in period t + 1, ceteris paribus, which leads to lower prescriptions of antibiotics and reduced gains. To o¤set this e¤ect, doctors must reduce their level of diagnosis accuracy (the denominator of equation (7)). Note, however, that the marginal impact of at the numerator of (7) is larger than the marginal impact at the denominator. Hence, we have @e =@ > 0.
Dispensing practices have an e¤ect on the equilibrium level of diagnosis accuracy through the price of drugs dispensed, measured by z. Note, however, that this e¤ect depends on the magnitude of positive externalities from antibiotic consumption ( ), and the e¢ ciency of services provided ( ), which a¤ects the denominator of (7). The result is not completely straightforward. Dispensing practices generally reduce the equilibrium level of diagnostic services as compared to not dispensing practices, provided that < 2=3. The rationale is that a reduced level of services increases the number of antibiotic prescriptions in period t with relatively low impact on consultations in period t + 1 and, consequently, the gains from antibiotic sales are higher. This e¤ect is magni…ed by the reduced incentive to pro-vide accurate diagnosis (at the denominator of (7)) when there are gains from antibiotic sales. However, this result may not hold with strong prevention e¤ects ( > 2=3) and low e¢ ciency of diagnostic services ( ! 0). This is because the marginal impact of z at the numerator (7) becomes positive and prevails over the e¤ect at the denominator.
Using the equilibrium level of diagnostic services in (7), we can derive the amount of antibiotic prescriptions per patient. The total number of antibiotic treatments in equilib-rium in period t is 2DAt = 2hDt ( DAyt 1)=2i. Substituting for Dt and DAyt 1 and dividing by the total number of patients (2 ), we get the per capita antibiotic use as
a = 1
Whether or not dispensing practices lead to higher levels of antibiotic use compared to not dispensing practices clearly depends upon the combined e¤ect of …nancial incentives from antibiotic sales and externalities from antibiotic consumption. With negligible preven-tion e¤ects ( ! 0) antibiotic prescriptions per capita are higher for dispensing practices as compared to not dispensing practices. Note that the second term between brackets of equation (8) tends to 1, whereas the …rst term increases since @e =@z > 0 when ! 0. Conversely, when prevention e¤ects are strong ( ! 1) the result is less straightforward. Note that the …rst and the second terms may move in opposite directions. Consequently, the hypothesis that dispensing practices increase antibiotic consumption through a reduced e¤ort in diagnostic services does not follow straightforwardly from our theoretical results and will then be empirically investigated in the following section.
3
Empirical analysis
3.1 Econometric speci…cation
To investigate further the impact of dispensing practices we now propose an empirical approach that exploits panel data from a country with a fee-for-service remuneration scheme for doctors and variations in the regime of dispensing drugs across the country. The e¤ects of antibiotic consumption externalities are captured by means of a combined spatial-lag and spatial error econometric approach. As mentioned in the Introduction section, the goal of the theoretical model presented in Section 2 is to formulate some hypothesis on the prescribing behaviour of the practice rather than to derive a reduced form model to be directly estimated.
The theoretical framework (equation 7) suggests that the consumption of antibiotics is in‡uenced by factors such as the price of antibiotics and the price of a consultation, the …nancial incentives attached to direct dispensing of drugs, and positive and negative externalities of antibiotic consumption that also exhibit a spatial dimension. Moreover, it is important to underline that the demand equation (8) has been derived for a market characterised by individuals with homogeneous socioeconomic variables such as income, age, and cultural factors.
The theoretical model may also suggest the need for some dynamic speci…cation in the econometric approach. However, data at our disposal cover a relatively short period of time and the estimation of a dynamic model with spatial econometrics methods is not
straightforward. For this reason, we focus on static models.14
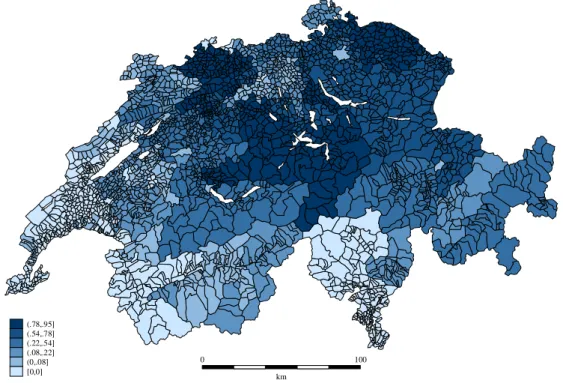
We have Swiss quarterly data on antibiotic consumption for the year 2002, disaggre-gated by 240 small geographic areas.15 Switzerland exhibits relatively low levels of antibiotic consumption compared to neighbouring European countries. The number of de…ned daily doses per 1000 inhabitants (DID) in 2002 is 32:05 in France, 24:38 in Italy, 13:76 in Ger-many, 11:75 in Austria, and only 9:00 in Switzerland (Masiero et al., 2010; Filippini et al., 2006). Nevertheless, as shown in Figure 2, the country is characterized by high heterogene-ity in consumption across small areas. Latin regions (French- and italian-speaking regions) generally exhibit higher levels of antibiotic consumption as compared to German-speaking regions.
To investigate the relationship between antibiotic consumption and dispensing practices we adopt a representative consumer approach, namely for each area we de…ne the dependent variable as the per capita antibiotic consumption. Further, the econometric speci…cation of the demand for antibiotics includes some socioeconomic variables that vary across the areas.16
In order to estimate the impact of dispensing and not dispensing physicians on antibiotic consumption, the empirical model includes variables representing the di¤erence in practice styles and incentives attached to the possibility of direct dispensing of drugs. We use a log-log functional form and, therefore, the estimated coe¢ cients can be interpreted as elasticities.
We initially specify the following model:
ln DIDjt = 0+ 1ln Yjt+ 2ln P OP1jt+ 3ln P OP2jt+ 4ln P OP4jt (9)
+ 5ln P OP5jt+ 6ln IN Fjt+ 7ln DP HYjt+ 8ln DP HAjt
+ 9ln P Ajt+ 10ln P Cjt+ 11DBORjt+ 12DLATjt
+ 13DHOSjt+ 14N ODISPjt+ 15DISP 50jt+ "jt:
1 4
For a dynamic approach to antibiotic consumption we refer the reader to a recent paper by Filippini and Masiero (2012).
1 5Switzerland is a federal state made of 26 cantons (states) with remarkable di¤erences in terms of
orga-nization of the health care system and health care policy. Generally, a canton is made up of between 10 and 20small areas. The population varies between 4,980 and 125,275 inhabitants per area. Each area has at least 4 pharmacies and/or drugstores. Direct dispensing is not allowed in some cantons like Geneva, Vaud, Balle ville, Ticino and Aargau. In some areas of the other cantons direct dispensing is permitted.
1 6The literature on determinants of the demand for physician’s services emphasises the role of
socioeco-nomic characteristics of the population and practice styles (Hunt-McCool et al., 1994; Carlsen and Grytten 1998; Grytten and Sorensen, 2003). More closely to antibiotics, the literature suggests that cultural aspects may in‡uence the use of antibiotics. For instance, Italian children receive more courses of antibiotics than Danish children (Resi et al. 2003; Thrane et al., 2003).
DIDjt is the per capita outpatient antibiotic use in the jth market area (j = 1; ::; J )
mea-sured in de…ned daily doses per 1000 inhabitants, and "jt is the usual error term that will
be speci…ed later.17 DP HYjt and DP HAjt are respectively the density of physicians and
pharmacies in the area; and P Ajt is the price of a de…ned daily dose of antibiotic and P Cjt
represents the price of a standard consultation with a general practitioner de…ned at can-tonal level and captured by the point values (weights) calculated for the reimbursement of services provided by general practitioners in 2001.18 P OPljt is the percentage of population
in the l age range and IN Fjt is the incidence of bacterial infections (campylobacter and
salmonella).19 The latter variable is a proxy for the probability of a correct diagnosis. We do not have more precise information, for instance, on potential need. Diagnosis accuracy improves when the incidence of bacterial infections is high since the probability to prescribe an antibiotic when it is not needed is lower. In the empirical speci…cation we use the average incidence of bacterial infections calculated over the years 1999-2001.
Further, the model (9) considers some explanatory variables not explicitly de…ned in the theoretical model (8). Yjt is the average income in the area; DBORjt, DLATjt, and
DHOSjt are dummy variables. The …rst one captures any borderland e¤ect with
neigh-bouring countries. The second considers whether an area is characterised by Latin culture (French- and Italian-speaking), or German culture. The third dummy accounts for at least one hospital in the area.
In order to capture the presence of practices that can sell drugs directly to their patients, we use two approaches. The …rst approach is based on dummy variables and is speci…ed in equation (9). In this case, two dummy variables, N ODISPjtand DISP 50jt, are introduced
in the model to capture the impact of direct dispensing of drugs. N ODISPjt takes value
equal to 1 if there are no dispensing practices in the area, 0 otherwise; DISP 50jttakes value
equal to 1 if the proportion of dispensing practices in the area is greater than 50%. The intermediate case where the proportion of dispensing practices is greater than 0 and lower
1 7
Clearly, the model does not allow to disentagle the possible mismatch between antibiotic prescriptions, antibiotic sales and antibiotic use since detailed data on these …gures are not available. We assume patient’s non-compliance to be a negligible factor.
1 8
In Switzerland, a detailed fee-for-service system with more than 4600 items is applied for the reimburse-ment of health care providers. A given number of points is assigned to each type of service according to time, complexity and facilities. The cantons apply di¤erent values to the basic point, which re‡ects the heterogeneity in the costs of services across the country. Therefore, the point value can be interpreted as a proxy for the price of a consultation.
1 9These are the leading causes of gastrointestinal infections. Since data are not available at local level,
than 50% represents our benchmark.20 As for the second approach, we use a continuous
variable (DISPjt) that represents the rate of dispensing practice. Following this approach,
the two previous dummy variables, N ODISPjt and DISP 50jt, are substituted for DISPjt
in equation (9). Dispensing variables should capture the presence of a positive mark-up on antibiotic prescriptions gained by dispensing practices as compared to not dispensing practices.
In Figure 3 we show the proportion of dispensing practices in small areas across the country. Note that the association between antibiotic consumption depicted in the previous map 2 and the presence of dispensing practices does not appear as straightforward as probably expected.
To check whether there is an interaction between GPs monopoly power and the inte-gration of prescribing and dispensing, we also test interaction terms between the density of physicians and dispensing variables in equation (9). The results are discussed in the following section 3.2 together with other …ndings.
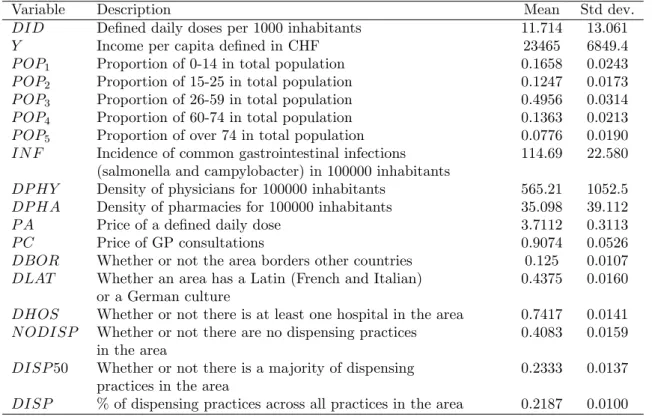
For the estimation of equation (9) we have quarterly data for the dependent variable -per capita antibiotic use - and for one independent variable - the price of a daily dose -, whereas for the remaining explanatory variables only yearly data are available.21 Therefore, we resolve to estimate equation (9) on a quarterly basis. A summary statistics of variables used in the empirical analysis is provided in Table 2.
The correct econometric approach to the estimation of equation (9) has to deal with three main issues: the possible endogeneity of price, the presence of unobserved heterogene-ity variables, such as infection variables, and the possible spatial correlation of antibiotic consumption across regions. Although the price of each antibiotic product does not vary across geographic areas in Switzerland, the average price for a daily dose of antibiotics di¤ers because geographic regions vary in the consumption mix of di¤erent antibiotic cat-egories. Consequently, the price for a daily dose can be endogenous. Although both the Wu-Hausman F-test and the Durbin-Wu-Hausman 2-test do not clearly reject the null hypothesis of price exogeneity, we deal with this potential endogeneity problem by treating the price as an endogenous variable and instrument it with the lagged value of price and the exogenous regressors.
2 0To investigate the robustness of our estimations, we also considered alternative coding choices. A dummy
variable that takes value equal to 1 if there are dispensing practices in the area, and 0 otherwise, is used to overcome the possible critique of setting an arbitrary threshold to 50%. The results are con…rmed.
2 1It is worh noting that the quarterly variation of most explanatory variables, such as income per capita
One additional argument that should be clari…ed is the potential reverse causality be-tween the presence of dispensing practices and the consumption of antibiotics. If areas with a majority of dispensing practices are signi…cantly di¤erent in terms of antibiotic consump-tion, we assume that causality runs from dispensing to antibiotic consumption. Although regulators allow for dispensing because of need, there are at least two reasons why causality cannot run from consumption to dispensing. First, the institutional decision to allow for direct dispensing of antibiotics is not a short-run intervention. This relates to the structure of the primary care market in di¤erent geographical areas, which is relatively stable over time, and, consequently, can be treated as exogenous as with respect to the consumption of antibiotics. Second, in Switzerland, the decision to allow for direct dispensing is not a federal competence. Regional regulators independently decide on the organization of the primary care market. Direct dispensing of drugs requires parliament approval, that is a national law has to be passed and is subject to a referendum.
With regard to choice of the econometric approach, we decided to follow a two step approach. In the …rst stage, we used classical non spatial econometric models for panel data, whereas in the second stage, we applied spatial panel data models.
It should be noted that in the econometric literature on panel data, we can …nd var-ious types of models. Generally, we can distinguish the following estimators: the OLS, the between (BE), the …xed e¤ects (FE) and the random e¤ects (RE).22 To account for unobserved heterogeneity, the best approaches are to econometrically specify the model (12) with either market area-speci…c …xed e¤ects (FE) or with market area-speci…c random e¤ects (RE).
FE models lend themselves well to situations with unobserved characteristics that re-main relatively stable over time. RE models do not impose that heterogeneity be approxi-mately constant within a unit over time, but have another important limitation. Speci…cally, they assume that the state-speci…c individual e¤ects are assumed to be uncorrelated with the explanatory variables. In practice, the state-speci…c term may contain unobserved fac-tors that are correlated with the explanatory variables. If so, the resulting RE coe¢ cients are biased. By contrast, the preferred estimation technique with FE, yields unbiased es-timated coe¢ cients even in the presence of such correlations. In order to choose between the …xed-e¤ects model and the random-e¤ects model we applied the Hausman test. This test checks the null hypothesis that the explanatory variables and the individual-speci…c
2 2
For a detailed presentation of the econometric methods that have been used to analyses panel data, Greene (2008) and Baltagi (2006).
error terms are uncorrelated. The result of the test shows that the di¤erences in coe¢ cients between the two models are not systematic, thus implying that the random e¤ects model is to be preferred. Moreover, the within variation of the majority of the variables included in the model is low and this could imply a low statistical e¢ ciency of the …xed e¤ects model. Therefore, model (12) has been estimated using a RE model. Further, given the fact that we are estimating model (12) using quarterly data where the majority of the explanatory variables do not vary over time, we decided to use, for comparison purposes and to check the robustness of the results, also the BE estimator. In this case, the estimation of model (12) using quarterly data only for 2002 is equivalent to the estimation of model (12) using cross-sectional data for 2002. Generally, the results are very similar to the random e¤ects model and, therefore, we do not show them in the tables that report the empirical results. As for spatial aspects, it is worth noting that regional antibiotic consumption may be a¤ected by individuals’ and physicians’ attitudes towards antibiotic consumption as well as the presence of infection disease in adjacent regions. The implications of spillover e¤ects in antibiotic consumption have been recently investigated by González Ortiz and Masiero (2013) using Italian data. Spatial externality problems can be taken into account by means of adequate spatial econometrics estimators.23 To incorporate spatial e¤ects into our regression model we can follow two approaches: the lag model and the spatial-error model or, as proposed by Kapoor et al. (2007), an econometric model that combine these two models. In this paper we adopt the random e¤ects spatial error and spatial lag models.24 As suggested by Moscone and Knapp (2005), the spatial error model is relevant
when the distribution of residuals in di¤erent regions displays spatial correlation. Residual may be spatially correlated if aggregated shocks hit regional health authorities or there are unobservable risk factors concentrated across the areas. In our case, this e¤ect may be due, for instance, to an infectious disease breakdown spreading across the country.
We expect the spatial error coe¢ cient to be positive, because infectious disease break-down in the neighbourhood of area j will determine an increase of antibiotic consumption
2 3
For a general introduction and discussion of spatial econometrics, see Anselin (1988, 2001). For an application of spatial econometric methods in health economics see Moscone and Knapp (2005), Moscone, Knapp and Tosetti (2007), Costa-Font and Moscone (2008), Filippini et. al. (2009a, 2009b).
2 4
In order to test the presence of spatial autocorrelation we considered several preliminary tests. The Moran’s I statistic as described by Kelejian and Prucha (2001) were applied to check for spatial correlation in the residuals. We also employed the testing procedure described in Baltagi et al. (2007). Both tests reject the null hypothesis of no spatial correlation in the residuals at 1% signi…cance level (p-value 0.01). In order to test for spatial correlation in the dependent variable, we applied the test described in Baltagi and Long (2008). The test rejects the null hypothesis of no spatial correlation in the dependent variable at less than 5% signi…cance level (p-value = 0.018).
in the area. On the other side, we expect the spatial lag coe¢ cient to be negative, because of the presence of spatial spillovers. A general increase of the consumption of antibiotics in a neighborhood area decreases the need to consume antibiotics because the probability of contagions decreases.
The econometric speci…cation of the RE model for panel data with J cross-sectional units observed over T time periods including spatial e¤ects, also referred as SARAR model and proposed by Kapoor et al. (2007), is de…ned as
DID = (W IT) DID + X + u (10)
u = (M IT) u + " (11)
" = eT + (12)
where DID is a J x1 vector of observations on antibiotic consumption per capita; X is the J xQ matrix of explanatory variables; is the vector of regression parameters; W and M are the matrix of spatial weights; u is a vector of spatially lagged residuals; is a vector of individual e¤ects and is a vector of i.i.d. residuals; …nally and are the spatial lag and spatial error respectively.
Concerning ", following assumptions are made:
" = eT + v (13) E( ) = 0 (14) E( 0) = 2 IJ (15) E(v) = 0 (16) E(v v0) = 2v IJ T (17) E(v0 ( eT)) = 0 (18)
where is a (J x1) vector of individual (random) e¤ects with zero mean, zero covariance and variance 2. Further, j and jt are i.i.d. with …nite fourth moments. It is assumed
that the matrices IJ W and IJ M are invertible (non-singular) and that , are
bounded in absolute value.
As expected the Wu-Hausman F-test rejects the null hypothesis of exogeneity of the spatially lagged dependent variable at less than 0.1% signi…cance level. To deal with en-dogeneity, we also treat the spatially lagged dependent variable as endogenous, together with price, and instrument it with the spatially lagged exogenous regressors and lagged price. Note that we can only use three quarters for our estimations since the lagged price
is included as an instrument. First-stage regressions on the instruments yield signi…cant joint F-tests. Moreover, the p-value of the Sargan-test statistics does not reject the null hypothesis and concludes that the overidentifying restriction is valid.
For the estimation of the spatial econometric models above we follow the approach suggested by Kapoor et al. (2007), and use a generalized moment estimator. Moreover, since current STATA commands do not combine the estimation of lag and spatial-error models, we developed additional STATA codes to estimate our models.
3.2 Estimation results
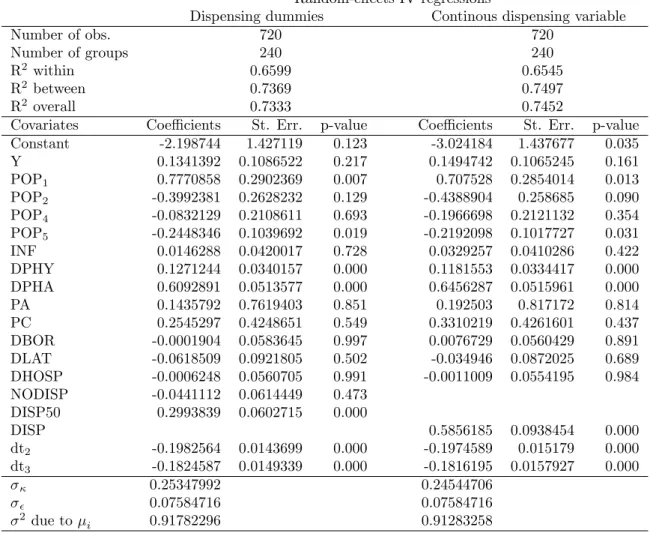
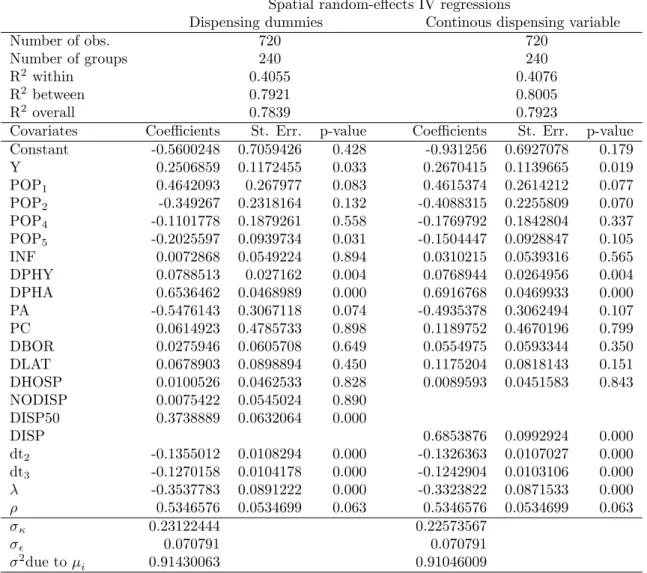
Before focusing on the e¤ect of dispensing practices, we brie‡y summarize the main results from the estimation of equation (9) using the random e¤ects model with and without spatial error and spatial lag e¤ects described by (10)-(12). In Table 3 we report the parameter estimates obtained using the random e¤ects models that do not consider spatial e¤ects. Models with spatial e¤ects are summarized in Table 4. Further, we report the results obtained using the two approaches to account for dispensing practices in separate columns. In the …rst column we show the results with the dummy variable approach, whereas in the second column a continuous dispensing variable is considered.
Generally, the value of the parameters and the number of signi…cant parameters in spatial models are relatively close to those reported for the non spatial models. When we take spatial e¤ects into account, the values of the income parameters are higher than the values reported in Table 3. Further, in both spatial models the age structure of the population seems to have a lower impact on the per capita antibiotic sales than in models without spatial e¤ects.
To provide more details on the estimated parameters, we start by looking at the e¤ect of income. Income elasticity varies between 0:13 (non-spatial models, not signi…cant) and 0:27 (spatial models, signi…cant at less than 5%), which supports the hypothesis that antibiotics are normal goods.25 Our result is in accordance with other …ndings in the literature (Nilson and Laurell, 2005; Henricson et al.,1998; Thrane et al., 2003).
Concerning the impact of the age structure of the population on antibiotic consumption we can observe that only young and elderly people seem to have a clear impact. A higher proportion of children between 0 and 14 years of age increases antibiotic consumption in an area. Conversely, antibiotics are less likely to be prescribed in areas that have a larger
2 5
Baye et al. (1997) …nd higher income elasticity (1.33) that may be related to di¤erences in the population under study and the type of antibiotics considered (only penicillins and tetracyclines).
proportion of individuals who are over 74 years of age compared to the baseline class.26
In all model speci…cations the coe¢ cient of the incidence of infections exhibits the expected positive sign but is poorly signi…cant.
The values of price elasticity of antibiotics obtained in the between model are close to the estimates of Baye et al. (1997), who found negative compensated ( 0:785) and uncom-pensated ( 0:916) own-price e¤ects for anti-infectives. Ellison et al. (1997) calculate price elasticities irrespective of drug (cephalosporins) expenditure using US wholesales data from 1985 to 1991. Their estimates range between 0:38 and 4:34. Our estimated price elas-ticities range between 0:14 (non-spatial models, not signi…cant) to 0:55 (spatial models, signi…cant). The coe¢ cient on price of doctor consultations is not signi…cant. Although expensive consultations imply higher diagnosis e¤ort, which may reduce inappropriate pre-scriptions of antibiotics, this hypothesis is not con…rmed by our results.
The physicians’ density is positively and signi…cantly associated with local per capita antibiotic use. Estimated elasticities vary between 0:08 and 0:13. Similarly, an increase in the density of pharmacies leads to higher levels of per capita outpatient antibiotic use in the area. The estimated coe¢ cient ranges between 0:61 and 0:69.
As for the impact of direct dispensing of drugs, the results reported in Table 4 for spatial models con…rm the results reported in 3. We …nd that the proportion of practices without dispensing (N ODISP ) has a negative e¤ect on antibiotic sales in both models, although the coe¢ cient is not signi…cant. Consequently, we cannot reject the hypothesis that areas without dispensing practices and areas with a relatively small proportion of dispensing practices (below 50%) exhibit similar levels of antibiotic consumption per capita. However, when the proportion of dispensing practices is relatively high (more than 50%), the e¤ect on consumption is positive and signi…cant. The estimated coe¢ cients suggest that in market areas where the proportion of dispensing practices is relatively high, antibiotic consumption is 1:30 to 1:37 times higher than in the other market areas, respectively for non spatial and spatial model speci…cations. This e¤ect is con…rmed by the results obtained using a continuous variable representing the share of dispensing practices in each market areas.27 The value of the estimated price elasticity varies between 0:58 and 0:68 and is
highly signi…cant. This value suggests that a one percent increase in the proportion of
2 6Similar results are obtained, for instance, by Mousquès et al. (2003), who investigate a panel of general
practitioners prescribing antibiotics for rhynopharingeal infections.
2 7
Interaction terms between the density of physicians and dispensing variables are always insigni…cant, both in spatial and non-spatial regressions. This is somehow expected since the density of physicians and dispensing covariates are highly signi…cant. Most of the variation is then captured by these variables included separately and little is left for their interaction.
dispensing practices will increase the per capita antibiotic sales by 0:58% to 0:68%.
The estimates of the spatial error coe¢ cient ( ) and the estimates of the spatial lag coe¢ cient ( ) are statistically signi…cant and carry the expected sign.28 The positive spatial error coe¢ cient may suggest that unobservable aspects or random shocks, such as a disease outbreak in surrounding areas, will determine an increase of antibiotic consumption in area i. Other more deterministic spatial spillovers are captured by the negative spatial lag coe¢ cient. In this case an increase in the consumption of antibiotics in neighborhood areas decreases antibiotic consumption in area i. This may indicate that the probability of contagions decreases due to the preventive e¤ect of antibiotic consumption.
It is worth noticing that the negative correlation between the rate of dispensing practices and the density of pharmacies in the areas is remarkable. One could then argue that dispensing practices are meant to improve access to drugs when pharmacies are lacking. Note, however, that in our model speci…cations we control for access in general. Indeed, the estimated coe¢ cient for dispensing practices is adjusted for the density of pharmacies as well as for the density of all practices. This suggests that direct dispensing of drugs may increase antibiotic consumption beyond the levels usually attained by some satisfactory access to medical services. One could also argue that the density of pharmacies is not a good indicator for access to antibiotic treatment in the area. Indeed, travelling costs for patients may vary consistently. Consider, for instance, two small areas of the same size but di¤erent number of pharmacies and inhabitants. The two areas may have the same number of pharmacies per inhabitant, i.e. the same density. However, the average patient’s distance from the pharmacy may di¤er. To address this point we run separate regressions with the density of the population as an additional regressor. This allows to better captures the level of urbanization of the areas and, consequently, can be used as a proxy for travelling distances. The variable is never signi…cant, nor does it change the results of the other covariates signi…cantly. We are then con…dent that our estimates of the e¤ect of dispensing practices on antibiotic consumption is quite robust to any possible misspeci…cation related to access to medical treatment.
4
Conclusions
Prescribing and dispensing of drugs are important aspects of access to primary health care. In most developed countries, these aspects are kept separate and doctors are not allowed
2 8
To investigate the robustness of these results we also estimate spatial lag models and a spatial error models separately. The estimates con…rm the results reported in Table 4.
to sell drugs directly to their patients. The separation of prescribing drugs and dispensing drugs has recently proved to be e¤ective in reducing drug expenditure, for instance in Taiwan (Chou et al., 2003). However, the separation of drug prescribing and dispensing may be costly in terms of limited access to drug treatment and low levels of infection prevention. In Switzerland, physicians are allowed to sell drugs directly to their patients in most cantons, with some exceptions across the country.
In this paper, we investigated dispensing practices using a theoretical and an empiri-cal approach. For this purpose, we extended the classiempiri-cal Hotelling product di¤erentiation model (Hotelling, 1929; Gravelle, 1999) with horizontal and vertical dimensions. We al-lowed for di¤erent types of general practitioners (with and without direct dispensing), imperfect information on the nature of patient’s infection (viral or bacterial), and positive and negative externalities from antibiotic consumption. GPs we allowed to reduce errors in prescribing by increasing the level of diagnostic services provided to their patients. We showed that the interaction between consumption externalities and incentives to dispens-ing practices may reduce diagnosis accuracy and, consequently, increase the likelihood of antibiotic prescriptions.
Using data on antibiotic consumption from small geographical areas from a country (Switzerland) with a fee-for-service remuneration scheme for doctors and two prescribing regimes - with and without dispensing practices -, we examined the e¤ects of dispensing practices empirically. Our econometric approach relies on spatial models for panel data where spatial aspects (both spatial lag and spatial error e¤ects) of infectious diseases and antibiotic consumption are taken into account by appropriate spatial-econometrics estima-tors (Moscone et al., 2007; Moscone and Tosetti, 2010a). Findings indicate that dispensing practices induce higher rates of antibiotic use, after controlling for patient characteristics, epidemiological factors, and access to drug treatment.
The rationale behind a higher consumption of antibiotics under a dispensing regime may be that dispensing practices bene…t more from antibiotic prescriptions because they gain a margin from antibiotic sales. This leads to lower diagnosis e¤ort which increases mistaken diagnosis and, consequently, raises antibiotic prescriptions and reduces antibiotic e¤ectiveness (higher bacterial resistance). This e¤ect is probably only partially mitigated by the positive externality from antibiotic consumption that reduce prescriptions needed by other individuals and in following periods. There will be scope for additional incentives to dispensing practices to reduce the inappropriate use of antibiotics and contain the threat of bacterial resistance.
References
Abood, R.R., 1989. Physician dispensing: issues of law, legislation and social policy. Amer-ican Journal of Law & Medicine 14, 4, 307–52.
Anselin, L., 2001. In: Baltagi, B.H. (Ed.), Spatial econometrics. : A Companion to Theoretical Econometrics. Basil Blackwell, Oxford, pp. 310–330.
Baltagi, B.H., Song, S.H., Jung, B.C., Koh, W., 2007. Testing for serial correlation, spatial autocorrelation and random e¤ects using panel data. Journal of Econometrics, 140, 1, 5–51. Baltagi, B.H., Long, L., 2008. Testing for random e¤ects and spatial lag dependence in panel data models. Center for Policy Research Working Paper No 102.
Baye, M.R., Maness, R., Wiggins, S.N., 1997. Demand systems and the true subindex of the cost of living for pharmaceuticals. Applied Economics 29, 1179–1189.
Brekke, K.R., Nuscheler, R., Straume, O.R., 2007. Gatekeeping in health care. Journal of Health Economics 26, 149–170.
Brekke, K.R., Nuscheler, R., Straume, O.R., 2006. Quality and location choices under price regulation. Journal of Economics & Management Strategy 15, 207–227.
Brekke, K.R., Holmas, T.H., Straume, O.R., 2011. Reference pricing, competition, and pharmaceutical expenditures: Theory and evidence from a natural experiment. Journal of Public Economics 95, 7-8, 624–638.
Brekke, K.R., Siciliani, L., Straume, O.R., 2010. Price and quality in spatial competition. Regional Science and Urban Economics 40, 471–480.
Carlsen, F., Grytten, J., 1998. More physicians: improved availability or induced demand?. Health Economics 7, 495–508.
Chou, Y., Yip, W.C., Lee, C.-H., Huang, N., Sun, Y.-P., and Chang, H.-J., 2003. Impact of separating drug prescribing and dispensing on provider behaviour: Taiwan’s experience. Health Policy and Planning 18, 3, 316–329.
Costa-Font, J., Moscone, F., 2008. The impact of decentralization and inter-territorial interactions on Spanish health expenditure. Empirical economics 34, 167–184.
Ellison, S.F., Cockburn, I., Griliches, Z., and Hausman, J., 1997. Characteristics of demand for pharmaceutical products: an examination of four cephalosporins. RAND Journal of Economics 28, 426–446.
Ellison, S.F., Hellerstein, J.K., 1999. In: Triplett, J.E. (Ed.), The economics of antibiotics: an exploratory study. : Measuring the prices of medical treatments. Brookings Institution Press, Washington DC, pp. 118–43.
Filippini, M., Masiero, G., Moschetti, K., 2009a. Small area variations and welfare loss in the use of outpatient antibiotics. Health Economics, Policy and Law 4, 55–77.
Filippini M., Masiero, G., Moschetti, K. 2006. Socioeconomic determinants of regional di¤erences in outpatient antibiotic consumption: Evidence from Switzerland. Health Policy, 78, 77-92.
Filippini, M., Masiero, G., Moschetti, K., 2009b. Regional consumption of antibiotics: a demand system approach. Economic Modelling 26, 1389–1397.
Filippini, M., Masiero, G., 2012. An empirical analysis of habit and addiction to antibiotics. Empirical Economics, 42, 471-486.
González Ortiz, L.G., Masiero, G., 2013. Disentangling spillover e¤ects of antibiotic con-sumption: a spatial panel approach. Applied Economics 45, 1041–1054.
Gravelle, H., 1999. Capitation contracts: access and quality. Journal of Health Economics 18, 315–340.
Gravelle, H., Masiero, G., 2000. Quality incentives in a regulated market with imperfect in-formation and switching costs: capitation in general practice. Journal of Health Economics 19, 6, 1067–1088.
Grytten, J., Sorensen, R., 2003. Practice variation and physician-speci…c e¤ects. Journal of Health Economics 22, 403–418.
Henricson, K., Melander, E., Molstad, S., Ranstam, J., Hanson, B.S., Rametsteiner, G., Stenber, G.P., and Melander, A., 1998. Intra-urban variation of antibiotic utilization in children: in‡uence of socioeconomic factors. The Journal of Clinical Pharmacology 54, 8, 653–657.
Herrmann, M., 2010. Monopoly pricing of an antibiotic subject to bacterial resistance. Journal of Health Economics 29, 1, 137–150.
Hess, G.R., Randolph, S.E., Arneberg, P., Chemini, C., Furlanello, C., Harwood, J., Roberts, M., and Swinton, J., 2002. In: Hudson, P.J. et al. (Eds.), Spatial aspects of disease dynamics. : The Ecology of Wildlife Diseases. Oxford University Press, New York, 102–118.
Holloway, K., 2005. Impact of health care systems on drug use. Institut Pasteur Eurocon-ferences: Mastering anti-infective therapies, Paris, October 20-21, http://www.pasteur.fr [January, 2006].
Hotelling, H., 1929. Stability in competition. Economic Journal, 39 (January), 41–57. Hunt-McCool, J., Kiker, B.F., Chu Ng, Y., 1994. Estimates of the demand for medical care under di¤erent functional forms. Journal of Applied Econometrics 9, 2, 201–218.