HAL Id: ird-00269211
https://hal.ird.fr/ird-00269211
Submitted on 28 Apr 2008
HAL is a multi-disciplinary open access archive for the deposit and dissemination of sci-entific research documents, whether they are pub-lished or not. The documents may come from teaching and research institutions in France or abroad, or from public or private research centers.
L’archive ouverte pluridisciplinaire HAL, est destinée au dépôt et à la diffusion de documents scientifiques de niveau recherche, publiés ou non, émanant des établissements d’enseignement et de recherche français ou étrangers, des laboratoires publics ou privés.
unit effort and abundance in a tuna purse-seine fishery
simulated with artificial neural networks
Daniel Gaertner, Michel Dreyfus-Leon
To cite this version:
Daniel Gaertner, Michel Dreyfus-Leon. Analysis of non-linear relationships between catch per unit effort and abundance in a tuna purse-seine fishery simulated with artificial neural net-works. ICES Journal of Marine Science, Oxford University Press (OUP), 2004, 61, pp.812-820. �10.1016/j.icesjms.2004.05.002�. �ird-00269211�
ICES Journal of Marine Science, 61: 812–820 (2004)
Analysis of nonlinear relationships between catch per unit effort
and abundance in a tuna purse-seine fishery simulated with
artificial neural networks
Daniel Gaertner and Michel Dreyfus–Leon
Gaertner, D., and Dreyfus-Leon, M. 2004. Analysis of nonlinear relationships between catch per unit effort and abundance in a tuna purse-seine fishery simulated with artificial neural networks. – ICES Journal of Marine Science, 61: 812–820.
A simulation study, combining grid- and individual-based approaches, was conducted to analyse the shape of the relationship between catch per unit effort (cpue) and abundance in a tuna purse-seine fishery. To understand the effect of fleet dynamics on the interpretation of cpue, the decision-making process used by fishers while searching for the resource is modelled with artificial neural networks. The cpue of fishers operating independently (i.e. individuals) vs. fishers sharing information (i.e. a code-group) are compared, accounting for environmental variables. The results show that a power curve non-proportional relationship between cpue and abundance performs better than a linear relationship. As the shape parameter of the power curve for the code-group fishers was lower in every scenario than that of individual fishers, we conclude that hyperstability, a phenomenon commonly observed in schooling fisheries, is mainly attributable to information exchange among vessels. Setting the individual-level state variables of the virtual system at a specific spatial and temporal scale may affect the results of the simulations.
Keywords: artificial neural networks, cpue–abundance relationship, tuna fishery, fisher behaviour, information-sharing
D. Gaertner:Institut de Recherche pour le Développement (IRD) UR 109, CRHMT BP 171, 34203 Sete Cedex France. M. Dreyfus–Leon, Instituto Nacional de la Pesca-PNAAPD,Facultad de Ciencias Marinas, UABC, México; postal address: PMB–070 PO Box 189003, Coronado, Ca 92178–9003, USA.
Correspondence to D. Gaertner: tel: +33 499 573231; fax: +33 499 573295; e-mail: gaertner@ird.fr.
Introduction
Because fishers preferably operate where they believe there are fish, fishing effort is not randomly distributed, but rather concentrated on good fishing grounds. This pattern can be expected for schooling fisheries where searching is highly efficient, such as in a tuna purse-seine fishery. As a consequence, catch per unit effort (
cpue
) is not proportional to abundance (Gulland, 1964; Paloheimo and Dickie, 1964; Bannerot and Austin, 1983). Despite its shortcomings, cpue still remains a simple and attractive index of abundance commonly used for stock assessment diagnosis by international fishery agencies. With this consideration in mind, Hilborn and Walters (1992) highlighted the importance of analysing the non-proportional shape of the relationship betweencpue
and abundance.The aim of this paper is to compare a linear and a nonlinear relationship between
cpue
and abundance for a patchily distributed resource exploited by fishers, depicting their ability to locate high-density patches. Owing to changes in the behaviour of fishers at sea, and the increasing use of sophisticated fishing devices over time, the use of directly observedcpue
as an index of abundance remains problematic in the tropical tuna purse-seine fishery (Fonteneau et al., 1999; Gaertner et al., 1999). An alternative method, at least in theoretical studies, is to generate abundance and cpue series with a simulation model. The core of the simulation, specifically the decision-making behaviour of purse-seiners, is based on an artificial neural network (ANN). Previous studies (Dreyfus-Leon, 1999; Dreyfus-Leon and Gaertner, 2002) have shown the usefulness of ANNs in representing the decision-making process used by fishers while searching for the resource. To demonstrate the usefulness of this type of simulation model, this study focuses on an analysis of the influence of environmental uncertainties and on the impact of information exchange among vessels on the shape of the relationship betweencpue
and abundance.Material and methods
Data
The number of studies using neural networks in oceanography has increased since the mid-1990s. ANNs have been used for modelling nonlinear relationships between the density of fish and habitat characteristics (Lek et al., 1996), for analysing fish stock-recruitment relationships (Chen and Ware, 1999), and for modelling movement behaviour of predatory pelagic fish in response to prey (Dagorn et
al., 2000). In most of the studies, ANNs are presented as a type of nonparametric regression model,
allowing the modelling of complex functional forms (Warner and Misra, 1996). Although ANNs seem to be a promising tool for mimicking the way fishers perform in their day-to-day behaviour at sea, the approach has not yet been used commonly in studies of fishing strategy. One exception, though, is the study of Dreyfus-Leon (1999), which was devoted to the analysis of fisher search behaviour. In the present paper, we used an ANN architecture based on the decision to move to a new fishing ground or to stay in the same area (Dreyfus-Leon and Gaertner, 2002). Providing a technical presentation of ANNs is beyond the scope of this paper, and interested readers are referred to other works on this topic (e.g. Abdi, 1994, Saila, 1996; Warner and Misra, 1996). Back-propagation neural networks typically consist of an input layer, a hidden layer, and an ouput layer. All the neurons (i.e. the nodes) in one layer have one-way connections to other neurons in the next layer. Each neuron sums all its inputs and adds a constant (the bias term) to form a total input, then applies an activation function to produce an input signal to the output layer. Thus, a neural network can be written as:
{
β +∑
Φ(
β +∑
)
}
Φ = i ij i j h j jk k 0 k w w x y ,where yk are the output signals, xi the input signals, wij the weights between input neuron i and hidden
neuron j, wjk the weights between hidden neuron j and output neuron k, βj and βk the biases for the
hidden and the output layers, and Φh and Φo are activation functions for the hidden and the output
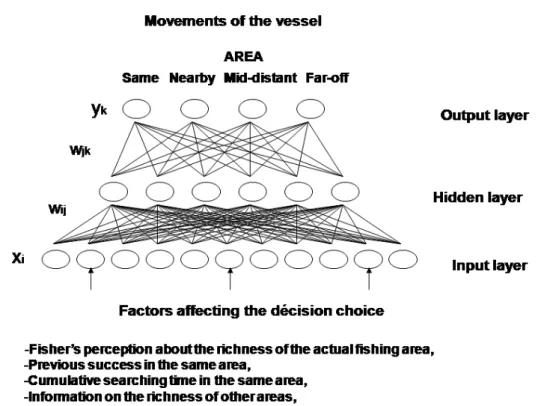
layers, respectively. The virtual tuna fishery system combines grid- and individual-based approaches. A virtual ocean is divided into 25 areas (fishing grounds) of 50 × 50 pixels each (Figure 1).
Figure 1. The virtual grid-based ocean. The density in tuna schools (i.e., high, medium and low) of each potential fishing areas varies each year according to the scenario considered (see text).
3
3
6
9
19
17
21
25
Cpue and abundance relationships in a tuna purse-seine fishery
3
To account for the patchy distribution of the resource, areas of high, medium, and low fish density each receive 25, 16.6 and 8.33% of the total recruitment (5 000 schools year–1), respectively. With the
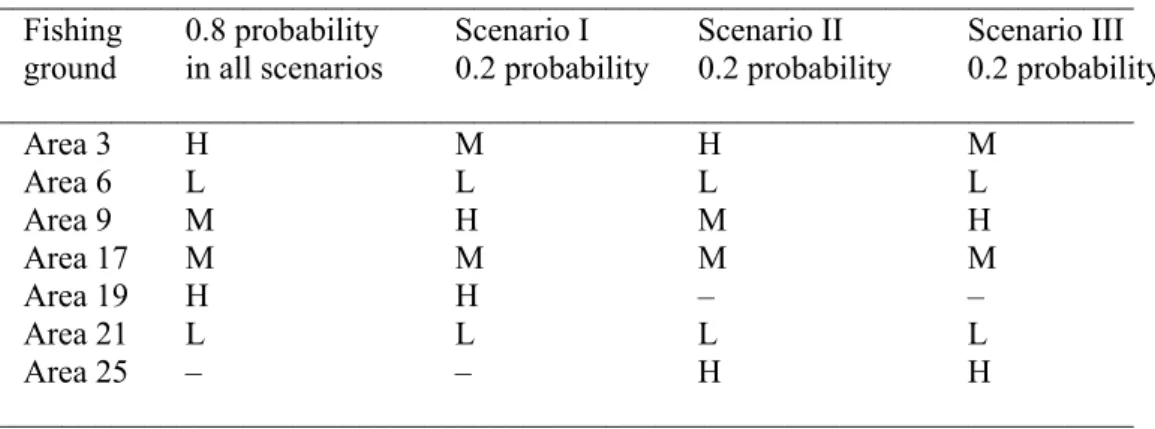
aim of generating environmental variability, the annual recruitment is spread over 6 or 7 fishing grounds, depending on the scenario considered (Table 1). In scenario I, fish density only changes in 2 of the 6 potential fishing grounds, with a certainty of transition to a new state the following year. Scenario II assumes that recruitment can disappear from one of the areas to appear in one of the surrounding ones. Scenario III, which is a mixture of the two other scenarios, is supposed to be the most variable. In order to simulate the clustered distribution of tuna schools, it is assumed that each tuna school (1 pixel) can move at random every 6 h within an area, without the possibility to move elsewhere.
Table 1. Fishing grounds considered in the three scenarios. Areas of high (H), medium (M) and low (L) fish density receive each 25, 16.6, and 8.33% of the total recruitment (5 000 schools per year), respectively. The second column presents fish densities on the fishing grounds attributable to recruitment with an 0.8 probability of occurrence. The last three columns show conditions in the three scenarios respectively with a 0.2 probability of occurrence.
_____________________________________________________________________ Fishing 0.8 probability Scenario I Scenario II Scenario III ground in all scenarios 0.2 probability 0.2 probability 0.2 probability _____________________________________________________________________ Area 3 H M H M Area 6 L L L L Area 9 M H M H Area 17 M M M M Area 19 H H – – Area 21 L L L L Area 25 – – H H _____________________________________________________________________
The fishing fleet consists of two types of artificial fisher: 10 fishing vessels operating independently (thereafter termed individuals) and 10 vessels sharing information (i.e. a code-group). Although our purpose was not to incorporate all the characteristics of a tuna purse-seiner, care was taken to consider real fishing practices and to calibrate model parameters to reflect reality wherever possible. Each vessel stays in port a time assigned at random (10–20 days), and the maximum duration of a trip is fixed at 45 days. The virtual vessel starts its trip in a corner area and moves at random each hour during the searching phase (during daytime only). A simulation day runs for 12 h, i.e. the observed mean daily fishing duration. A tuna school is detected and caught when a searching vessel has the same position. To account for the fishing operation, we assume that the vessel stays in the same position for 3 h (an average observed setting time). The decision to stay in the same area or to move to a nearby, mid-distant, or far-off area is made at dusk only if the vessel has been searching in the area for at least 12 h. The movement decision is performed by an ANN that has been previously trained with standard back-propagation methodology and reinforcement learning (Rumelhart et al., 1986). This process is based on the highest predicted benefit, and consequently accounts for costs proportional to distance traveled. Input variables (i.e. the input layer) affecting fisher choice (i.e. the output layer) encompass the presence of other vessels fishing in the same area, the time spent searching in the same area, a memory of recent decisions, knowledge of present fishing performance, and knowledge of area quality in the other areas (Figure 2). This last factor is the only one that differs at the input layer of the ANN between the two categories of artificial fisher. Consequently, the decision of individual fishers about the suitability of each area results only from their own experience in the fishery. In contrast, at the end of the fishing day, the vessels belonging to the group can exchange information and share knowledge on the richness of different fishing grounds. One can argue that, for fishers operating in a group, the fishing strategy is more societal than individual (even if each artificial skipper makes his/her decision independently). However, fishers coordinating their collective fishing activities (e.g. catching and searching) through a “decision-making club” framework have been
observed in numerous fisheries around the world (Gatewood, 1984; Wilson, 1990; Campbell et al., 1993).
Figure 2 Artificial neural network architecture used to simulate the decision making process used by fishermen while searching for the tuna schools, where y k are the output signals (i.e., when and where
to move), x i are the input signals, w ijare the weights between input neuron i to hidden neuron j, w jk
are the weights between hidden neuron j to output neuron k.
The virtual ocean and the ANN were designed and programmed in C++ by one of the authors (MD). For convenience, the model-based daily catch and effort data were aggregated on a monthly basis (i.e. a series of 11 years × 12 months).
Method
The simplest way of relating the abundance of fish to cpue is to assume a proportional relationship: Ut = qAt
where Ut is the cpue at time t, q the catchability coefficient, and At is the abundance at time t.
However, as raised by many authors (Gulland, 1964; Paloheimo and Dickie, 1964; Laurec and Le Guen, 1977; Peterman and Steer, 1981; Bannerot and Austin, 1983), there are many reasons to believe that this linear relationship oversimplifies the link between cpue and abundance. There is evidence that fish schooling, fisher search behaviour, changes in fishing technology over time, etc., may have a significant effect on fishing success and, as a consequence, limit the use of a simple linear model. The simplest form of nonlinear model, which requires the estimation of only one additional parameter, is the power curve:
Cpue and abundance relationships in a tuna purse-seine fishery
5
where U t, q, and At are as defined above, and β represents the shape parameter of the power curve.
Although more sophisticated models may describe more accurately the non-proportional relationship between cpue and abundance (Richards and Schnute, 1986), the power curve is widely used by fishery agencies and was considered suitable for a meta-analysis on abundance–cpue relationships by Harley et al. (2001).
One of the advantages of simulated data is that abundance, catch, and effort are known exactly, so we did not consider observation errors in the model formulation. With the aim of modelling count data in the form of encounters per unit of time, we assumed that a Poisson likelihood function relates the observed (Ut) and predicted cpue (Uˆ t), from either the linear or the power curve model) at time t as
follows: ! U Uˆ e L
U
U
ˆ
U
ˆ
U
t t t t t t − = ⎟ ⎠ ⎞ ⎜ ⎝⎛ (Mangel and Clark, 1983; Hilborn and Mangel, 1997). Model parameters can then be estimated by minimizing:
( )
[
]
∑
−
tUˆ
log
U
Uˆ
t t t (Agresti, 1990).The likelihood ratio test (LRT) is the most commonly used null hypothesis approach for comparing pairs of nested models. However, because no form of LRT can be used to calculate relative support among competing models, we preferred a model-selection procedure that considered fit and model complexity, and that could be used to make inferences from more than one model. Starting from the most parameterized model (the power curve in the present case), we checked whether the linear model fitted reasonably well the relationship between cpue and abundance. Akaike’s information criterion (AIC) was used as an objective means of model selection from a set of candidate models (Lebreton et
al., 1992). This criterion gives a good trade-off between the extremes of under-fitting and over-fitting,
that is on one side biased by having too few parameters, and on the other side has high variance because of the number of parameters (Burnham and Anderson, 1992). The model with the smallest AIC (the parsimonious model) is considered appropriate for relating cpue with abundance.
As Poisson was used as the basis for the likelihood function, we needed to consider over-dispersion (e.g. the cluster structure of tuna schools). In this context, quasi-likelihood theory justifies the usual maximum likelihood estimators as optimal point estimators of the parameters, even when there is excessive variation in the data (Burnham and Anderson, 1992). The simplest way to allow for over-dispersion is to perform a quasi-likelihood estimate of the variance inflation factor (ĉ) from the goodness-of-fit chi-square statistic (χ2) of the most parameterized model and its degrees of freedom
(d.f.), where ĉ is: ĉ = χ 2 / d.f.
When calculating χ2, pooling may be required to avoid smaller-than-expected frequencies. Aside
from its use during the model-selection process, the variance inflation factor can be used to correct the model-based variances and covariances (i.e. by multiplying it by ĉ).
Using quasi-likelihood theory, and accounting for small-sample bias correction, the conventional AIC criterion is modified as (Anderson et al., 1994):
( )
[
]
{
}
2 nK(
KK 11)
K 2 cˆ / ˆ L log 2 QAICc − − + + + θ − =where n is the number of observations, K the number of parameters (
θˆ
), andL
( )
θˆ
is the maximum likelihood estimates of the model parameters.However, AIC (or QAICc) values are sometimes nearly equal, making the choice of one specific model problematic. Consequently, to account for model selection uncertainty, the normalized quasi-likelihood Akaike weights (Wi ) are calculated for each candidate model i, as:
⎥⎦
⎤
⎢⎣
⎡
⎟
⎠
⎞
⎜
⎝
⎛ Δ
−
∑
⎥⎦
⎤
⎢⎣
⎡
⎟
⎠
⎞
⎜
⎝
⎛ Δ
−
=
2
exp
2
exp
QAICc
i
QAICc
i
W
i i
where
Δ
QAICc
i
=
QAICc
i
−
min
QAICc
(Anderson et al., 2000).The model with the greatest Wi will have the highest probability of being the best model for the
data, given the candidate set of models. In addition, the parameter estimates can be averaged over the competing models in a manner that accounts for model-selection uncertainty.
Results
For each scenario, simulations were carried out where the environmental conditions were the same for both types of vessels. Results of model-selection and parameter estimates of relating simulated abundance to cpue are given in Table 2.
Table 2. Model selection and parameter estimates for relating simulated abundance to cpue, with (N. par.) number of parameters, (Nll) negative log-likelihood, (QAICc) quasi-likelihood Akaike Information Criterion, and (W) Akaike information criterion weight.
_______________________________________________________________________
Scenario Fisher Parameters
Type Model q β N. par. Nll QAICc W
_______________________________________________________________________ Individuals 1 0.0326 n/a 1 286.781 1317.800 0 2 0.1835 0.6852 2 275.772 1269.352 1 I Group 1 0.0318 n/a 1 298.404 1199.138 0 2 0.3218 0.5774 2 278.403 1120.960 1 Individuals 1 0.0279 n/a 1 269.990 1504.155 0.008 2 0.0733 0.8266 2 267.871 1494.425 0.992 II Group 1 0.0276 n/a 1 288.768 1079.879 0 2 0.2048 0.6391 2 279.345 1046.770 1 Individuals 1 0.0288 n/a 1 300.163 760.349 0 2 0.2108 0.6375 2 288.490 732.921 1 III Group 1 0.0292 n/a 1 339.950 687.529 0 2 0.8664 0.3796 2 303.434 615.958 1 _______________________________________________________________________ n/a = not applicable
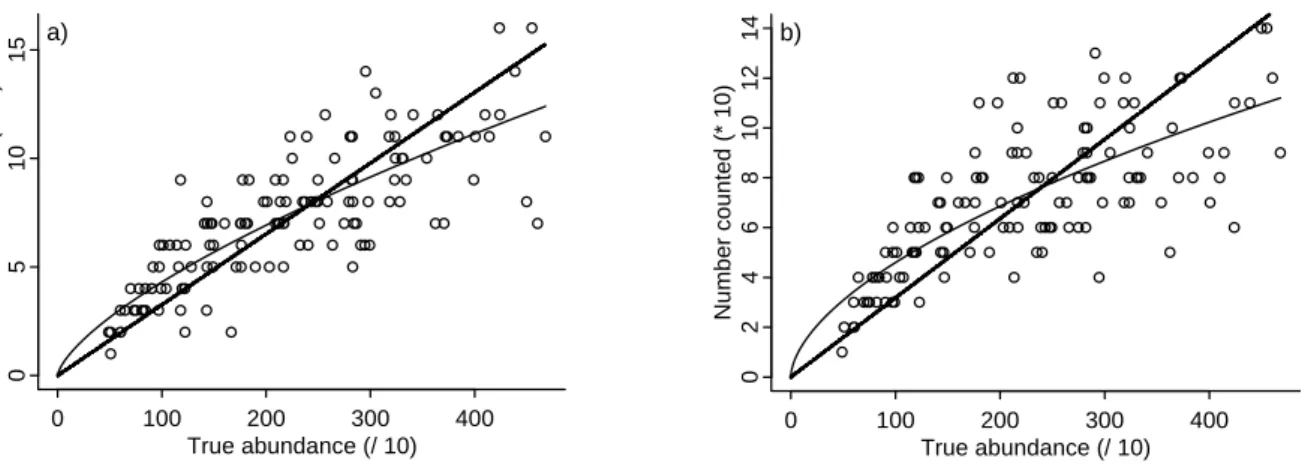
For each fisher type, the fit of the power curve is better than that of the linear fit. As the shape parameter β was estimated to be <1, it is concluded that cpue declines slower than abundance. This situation is known as “hyperstability” (in contrast, when β >1, the situation is termed “hyperdepletion”). The shape parameter β for the group type is systematically lower than the β estimate for fishers operating individually (0.69 vs. 0.58 in scenario I, 0.83 vs. 0.64 in scenario II, and 0.64 vs. 0.38 in scenario III). The departures from a simple proportional relationship between cpue and abundance are reflected in Figures 3–5.
0 100 200 300 400 0 5 10 15 Number c ounted (* 10) True abundance (/ 10) a) 0 100 200 300 400 02 46 8 1 0 1 2 1 4 Num ber counted (* 10) True abundance (/ 10) b)
Figure 3 Linear and nonlinear relationship between CPUE and abundance for individuals (a) and code-group (b) fishermen: scenario I (low environmental variability).
0 100 200 300 400 0 2 4 6 8 10 12 14 Num b er counted (* 10) True abundance (/ 10) a) 0 100 200 300 400 0 2 4 6 8 10 12 14 Num b er counted (* 10) True abundance (/ 10) b)
Figure 4 Linear and nonlinear relationship between CPUE and abundance for individuals (a) and code-group (b) fishermen: scenario II (intermediate environmental variability).
0 100 200 300 400 02 468 1 0 1 2 1 4 Num ber counted (* 10) True abundance (/ 10) a) 0 100 200 300 400 02 468 1 0 1 2 1 4 Num ber counted (* 10) True abundance (/ 10) b)
Figure 5 Linear and nonlinear relationship between CPUE and abundance for individuals (a) and code-group (b) fishermen: scenario III (high environmental variability)
In addition, it appears that the value of β is related to the level of uncertainty in the environment. Scenario III, assumed to be the most variable and consequently the most uncertain in terms of fishers’ search decisions, had the lowest value for the shape parameter. This effect is specifically pronounced
for the fishers exchanging information for which β reaches a value close to 0.38. In contrast, the environmental variability simulated in scenario II (recruitment taking place in one of the surrounding cells only for one area) produces results relatively close to the proportional relationship. Even for a stable environment (scenario I; Figures 3a, b), cpue is not linearly related to abundance, likely because of the patchy distribution of the resource combined with the fishers’ fast learning about good fishing grounds.
Discussion
By using an aggregated form of the variables of interest (e.g. overall abundance, total catch, total effort), traditional stock assessment models give a simplified view of the fishery system. In contrast, individual-based models that treat individuals as discrete entities offer a way for accounting for individual variability, interaction among individuals, adaptive behaviour, and persistence in complex fishery-related problems (Grimm et al., 1999). Spatial allocation of fishing effort is an important component of a fleet’s dynamics, specifically to understand the cause of the non-proportional relationship between cpue and abundance. However, most fleet dynamics studies use an aggregated approach to simulate changes in fishing effort in response to local changes in abundance (e.g. Mangel and Clark, 1983; Allen and McGlade, 1986; Hilborn and Walters, 1987; Gillis and Peterman, 1998; Campbell and Hand, 1999; Holland and Sutinen, 1999), whereas few attempts have considered individual-based models with observed data (Dorn, 1998; Gaertner et al., 1999), or use of simulation techniques (Dreyfus-Leon, 1999; Millischer, 2000; Dorn, 2001; Dreyfus-Leon and Gaertner, 2002). From this study and previous ones, it appears that ANNs are well-suited to mimicking fisher decision-making under uncertainty, even in situations where information is incomplete. There are, however, other methods for modelling fisher decision-making (Mangel and Clark, 1983; Dorn, 1998, 2001).
A key issue in developing an individual-based model involves setting an appropriate spatial and temporal scale. Because the virtual resource was broken down into distinct patches, and a daily basis was used for the movement rules, the present model is realistic enough to be applicable to the analysis of the relationships between abundance and cpue in a tropical tuna fishery. It must be kept in mind, however, that setting the individual-level state variables (e.g. the output layer of the ANN, the density and the distribution of the resource) at a specific scale of resolution affects all aspects of the model. For all these reasons, results may depend partly on the model-specific structure (Grimm et al., 1999), and partly on the information used accurately to represent a purse-seine tuna fishery. Because it is implicit in modelling that perfect truth cannot be attained, the only thing that can be done is measuring the adequacy between model predictions and field observations (Oreskes et al., 1994). For instance, checking when predictions agree with observed patterns, or at least do not contradict reality, allows the modeller to assume that the model “adequately” relates cpue with abundance. In this respect, Dreyfus-Leon and Gaertner (2002) showed that this simulated fishery model perfectly reproduced the changes over time of local cpue and local fishing effort as observed in real tuna purse-seine fisheries.
Obviously, one of the aims of this study was not to show the existence of hyperstability (a situation evidenced in numerous commercial fisheries), but rather to provide an insight into the factors that contribute to this situation. Hilborn and Walters (1992) consider hyperstability to be one of the worst features for fishery managers. For example, failure to recognize changes in true abundance owing to the relative insensitivity of local cpue can lead to collapse of a stock (Rose and Kulka, 1999). In general, the operational characteristics of fishing will tend to cause hyperstability, whereas the distributional characteristics will tend to cause hyperdepletion. Among the components that contribute to hyperstability, Hilborn and Walters (1992) mentioned non-random search and information sharing. We showed through this study that hyperstability can be attributed mainly to information sharing (i.e. a code-group behaviour produces a decrease in β close to 16, 23, and 41% from scenarios I, II, and III, respectively). However, because of the simple spatial distribution of the clusters of tuna schools and the limited range of environmental variability used in the simulation runs, only relative, rather than absolute, values of the results should be considered. Furthermore, caution should be exercised in extrapolating these results to real fisheries, because it is not known how error in catch and effort might affect the conclusions. There are also limitations associated with the use of model-based data. Because the data points are not independent of each other, it may be argued that further research is needed to
Cpue and abundance relationships in a tuna purse-seine fishery
9
select an appropriate statistical analysis for investigating patterns of covariance at different time scales (Pyper and Peterman, 1998). However, we did not perform any statistical test to check whether the shape parameter β was systematically lower than 1, and we found the same type of result when we carried out preliminary simulation runs with different random number seed.
The effect of uncertainty related to the artificial environment on the shape parameter β is more complex to evaluate. The present results show that non-proportionality between cpue and abundance increases as environmental variability increases (e.g. scenario III). This result is not surprising, because information-sharing reduces the time spent finding good fishing areas. Therefore, the advantages of belonging to a sharing group would be greater under some degrees of uncertainty related to the spatial distribution of the resource. In contrast, even if the resource’s patchy distribution appears to be the minimum condition for generating departures from a linear cpue/abundance relationship, adding a moderate environmental variation (e.g. from scenario I to II) may partly re-establish a relative proportionality between the two entities. Unfortunately we were unable to quantify the relationship between β (a quantitative variable) and environmental variability (a semi-qualitative variable assumed to follow an ordinal scale from scenario I to III). Complementary investigations on the effect of local density (i.e. the concentration profiles) and on the spatial extent of the area covered by the resource are needed to understand better the dynamics of the relationship between abundance and cpue.
Conclusion
Incorporating fisher decision-making into a fleet’s dynamic process, specifically in an individual-based approach, can provide an insight in the appropriate use of cpue in stock assessments. As interaction among fishers, such as information sharing, is one of the main factors responsible for departures from the basic linear relationship relating cpue to abundance, the results obtained in this paper reinforce the view that purse-seiner cpue cannot be used directly as an indicator of population trend. In some circumstances, the cpues of code-group fishers may not accurately reflect changes in the simulated abundance (Dreyfus-Leon and Gaertner, 2002). In real fishery situations, hyperstability (specifically when biomass is overestimated) may affect the way a fishery manager will perceive the risk of collapse of a stock. As a consequence, conservation measures may be postponed or be too weak to assure the long-term sustainability of the resource. Although a power curve is a suitable form for overcoming this type of uncertainty, it will also be important to determine the extent to which β and q can be modified over time. This is especially true for the catchability coefficient q, owing to the increase in fishing power of vessels. Such changes in fishing efficiency were not taken into account in our simulations, but have been observed in tropical tuna fisheries (Fonteneau et al., 1999). With the lack of detailed information on new fishing technology introduced on board purse-seiners over time, recourse to simulation studies is a promising area for modelling fishing efficiency. In addition, the virtual tuna fishery system, combining grid- and individual-based approaches, may be extended to other topics to provide answers to questions regularly raised by tuna fishery agencies, such as: how to eliminate the code-group effect in observed cpue series, and how to gauge fishing effort for sets related to fish aggregating devices.
Acknowledgements
We are grateful to two anonymous reviewers for their suggestions on improving the draft manuscript.
References
Abdi, H. 1994. Les réseaux de neurones. Sciences et technologies de la connaissance. P.U.G., Grenoble. 269 pp.
Agresti, A. 1990. Categorical Data Analysis. Wiley, New York. 558 pp.
Allen, P. M., and McGlade, J. M. 1986. Dynamics of discovery and exploitation: the case of the Scotian Shelf groundfish fisheries. Canadian Journal of Fisheries and Aquatic Sciences, 43: 1187– 1200.
Anderson, D. R., Burnham, K. P., and Thompson, W. L. 2000. Null hypothesis testing: problems, prevalence, and an alternative. Journal of Wildlife Management, 64: 912–923.
Anderson, D. R., Burnham, K. P., and White, G. C. 1994. AIC model selection in overdispersed capture-recapture data. Ecology, 75: 1760–1793.
Bannerot, S. P., and Austin, C. B. 1983. Using frequency distributions of catch per unit effort to measure fish-stock abundance. Transactions of the American Fishery Society, 112: 608–617. Burnham, K. P., and Anderson, D. R. 1992. Data-based selection of an appropriate biological model:
the key to modern data analysis. In Wildlife 2001 Populations, pp. 16–30. Ed. by D. R. McCullough, and R. H. Barrett. Elsevier, London.
Campbell, H. F., and Hand, A. J. 1999. Modeling the spatial dynamics of the U.S. purse-seine fleet operating in the western Pacific tuna fishery. Canadian Journal of Fisheries and Aquatic Sciences, 56: 1266–1277.
Campbell, H. F., Meyer, G., and Nicholl, R. B. 1993. Search behavior in the purse seine tuna fishery. Natural Resource Modeling, 7: 15–35.
Chen, D. G., and Ware, D. W. 1999. A neural network model for forecasting fish stock recruitment. Canadian Journal of Fisheries and Aquatic Sciences, 56: 2385–2396.
Dagorn, L., Josse, E., Bach, P., and Bertrand, A. 2000. Modeling tuna behaviour near floating objects: from individuals to aggregations. Aquatic Living Resources 13: 203–211.
Dorn, M. W. 1998. Fine-scale fishing strategies of factory trawlers in a midwater trawl fishery for Pacific hake (Merluccius productus). Canadian Journal of Fisheries and Aquatic Sciences, 55: 180– 198.
Dorn, M. W. 2001. Fishing behavior of factory trawlers: a hierarchical model of information processing and decision-making. ICES Journal of Marine Science, 58: 238–252.
Dreyfus-Leon, M. 1999. Individual-based modelling of fishermen search behaviour with neural networks and reinforcement learning. Ecological Modelling, 129: 287–297.
Dreyfus-Leon, M., and Gaertner D. 2002. Fleet dynamics and information exchange simulation modeling with artificial neural network. In "From Animals to Animats 7", Proceedings of the 7th International Conference on Simulation of Adaptive Behavior, ISAB, pp. 397–398 Ed. by B. Hallam, D. Floreano, G. Hayes, J-A. Meyer, and J. Hallam. The MIT Press, Cambridge, Massachusetts, USA.
Fonteneau, A., Gaertner, D., and Nordstrom,V. 1999. An overview of problems in the catch per unit of effort and abundance relationship for the tropical purse seine fisheries. Collective Volume of Scientific Papers, ICCAT, 49(3): 258–278.
Gaertner, D., Pagavino, M., and Marcano, J. 1999. Influence of fisher's behaviour on the catchability of surface tuna schools in the Venezuelan purse-seiner fishery in the Caribbean Sea. Canadian Journal of Fisheries and Aquatic Sciences, 56: 394–406.
Gatewood, J. B., 1984. Cooperation, competition, and synergy: information-sharing groups among Southeast Alaskan salmon seiners. The American Ethnologist, 11: 350–370.
Gillis, D. M., and Peterman, R. M. 1998. Implications of interference among fishing vessels and the ideal free distribution to the interpretation of CPUE. Canadian Journal of Fisheries and Aquatic Sciences, 55: 37–46.
Grimm, V., Wyszomirski, T., Aikman, D., and Uchmanski, J. 1999. Individual-based modeling and ecological theory: synthesis of a workshop. Ecological Modelling, 115: 275–282.
Gulland, J. A. 1964. Catch per unit effort as a measure of abundance. Rapports et Procès-verbaux des Réunions Conseil International pour l’Exploitation de la Mer, 155: 8–14.
Harley, S. J., Myers, R. A., and Dunn, A. 2001. Is catch-per-unit-effort proportional to abundance? Canadian Journal of Fisheries and Aquatic Sciences, 58: 1760–1772.
Hilborn, R., and Mangel, M., 1997. The ecological detective. Confronting models with data. In Monographs in Population Biology, 28, pp. 131-179. Ed. By S. A. Levin and H. S. Horn, Princeton University Press, Princeton, USA. 315 pp.
Hilborn, R., and Walters, C. J. 1987. A general model for simulation of stock and fleet dynamics in spatially heterogeneous fisheries. Canadian Journal of Fisheries and Aquatic Sciences, 44: 1366– 1369.
Hilborn, R., and Walters, C. J. 1992. Quantitative Fisheries Stock Assessment. Choice, Dynamics and Uncertainty. Chapman & Hall, New York. 570 pp.
Cpue and abundance relationships in a tuna purse-seine fishery
11
Holland, D. S., and Sutinen, J. G. 1999. An empirical model of fleet dynamics in New England trawl fisheries. Canadian Journal of Fisheries and Aquatic Sciences, 56: 253–264.
Laurec, A., and Le Guen, J-C. 1977. CPUE des senneurs et abondance: impact des structures fines. Collective Volume of Scientific Papers, ICCAT, 7(1): 30–54.
Lebreton, J-D., Burnham, K. P., Clobert, J., and Anderson, D. R. 1992. Modeling survival and testing biological hypotheses using marked animals: a unified approach with case studies. Ecological Monographs, 62: 67–118.
Lek, S., Delacoste, M., Baran, P., Dimopoulos, I., Lauga, J., and Aulagnier, S. 1996. Application of neural networks to modelling nonlinear relationships in ecology. Ecological Modelling, 90: 39–52. Mangel, M., and Clark, C. W. 1983. Uncertainty, search, and information in fisheries. Journal du
Conseil International pour l’Exploration de la Mer, 41: 93–103.
Millischer, L. 2000. Modélisation individu centrée des comportements de recherche des navires de pêche. Approche générique spatialement explicite par systèmes multi-agents. Intérêts pour l’analyse des stratégies et des puissances de pêche. Doctoral thésis, ENSA Rennes, France. 246 pp. Oreskes, N., Shrader-Frechette, K., and Belitz, K. 1994. Verification, validation and confirmation of
numerical models in the earth sciences. Science, 263: 641–646.
Paloheimo, J. E., and Dickie, L. M. 1964. Abundance and fishing success. Rapports et Procès-verbaux des Réunions du Conseil International pour Exploration de la Mer, 155: 152–163.
Peterman, R. M., and Steer, G. J. 1981. Relation between sport-fishing catchability coefficients and salmon abundance. Transactions of the American Fisheries Society, 110: 585–593.
Pyper, B. J., and Peterman, R. M. 1998. Comparison of methods to account for autocorrelation in correlation analyses of fish data. Canadian Journal of Fisheries and Aquatic Sciences, 55: 2127– 2140.
Richards, L. J., and Schnute, J. T. 1986. An experimental and statistical approach to the question: is CPUE an index of abundance? Canadian Journal of Fisheries and Aquatic Sciences, 43: 1214– 1227.
Rumelhart, D. E., Hinton, G. E., and Williams, R. J. 1986. Learning representations by back-propagating errors. Nature, 323: 533–536.
Rose, G. A., and Kulka, D. W. 1999. Hyperaggregation of fish and fisheries: how catch-per-unit-effort increased as the northern cod (Gadus morhua) declined. Canadian Journal of Fisheries and Aquatic Sciences, 56(Suppl. 1): 118–127.
Saila, S. B. 1996. Guide to some computerized artificial intelligence methods. In Computers in Fisheries Research, pp. 8–40. Ed. by B. A. Megrey, and E. Moksness, Chapman & Hall, London. Warner, B., and Misra, M. 1996. Understanding neural networks as statistical tools. The American
Statistician, 50: 284–293.