Air Quality Co-benefits of Renewable Energy Policy in the U.S.
by
Emil Dimantchev
B.A. Mathematical Economics
Colorado College (2011)
Submitted to the Institute for Data, Systems, and Society
in partial fulfillment of the requirements for the degree of
Master of Science in Technology and Policy
at the
MASSACHUSETTS INSTITUTE OF TECHNOLOGY
September 2018
© Massachusetts Institute of Technology 2018. All rights reserved.
Author.………...
Institute for Data, Systems, and Society
August 10, 2018
Certified by.………...
Noelle E. Selin
Associate Professor, Institute for Data, Systems, and Society
Thesis Supervisor
Accepted by.………..
Munther Daleh
Professor, Electrical Engineering and Computer Science
Director, Institute for Data, Systems, and Society
Air Quality Co-benefits of Renewable Energy Policy in the U.S.
by
Emil Dimantchev
Submitted to the Institute for Data, Systems, and Society
on August 15, 2018 in Partial Fulfillment of the Requirements
for the Degree of Master of Science in Technology and Policy
Abstract
Despite lawmaker interest in transitioning electricity systems toward renewable energy sources and in mitigating harmful air pollution, the extent to which sub-national renewable energy policies in the U.S. can improve air quality and human health remains unclear. This thesis develops a systemic modeling framework to assess the impacts of future renewable energy policy on air quality, as well as on the economy and on climate change, employing the framework of cost-benefit analysis. To model the chain of policy effects from impacts on the economy to power plant emissions, human health, and climate change, I integrate an economy-wide computable general equilibrium model, an atmospheric chemistry model, and
methodologies for the economic valuation of health impacts. I apply this modeling framework to study the potential future impacts of the existing Renewable Portfolio Standards (RPSs) in the U.S. Rust Belt region. This thesis also tests the impacts of alternative RPS stringency levels and assesses RPS impacts compared to carbon pricing, a climate policy favored by many economists. I estimate that existing RPSs in this region generate health co-benefits that, in economic terms, exceed the climate change mitigation benefits of these policies. Estimated health co-benefits also outweigh the economic costs of the modeled policies, indicating that air quality co-benefits alone may justify RPS implementation. This work further finds that raising RPS stringency in the Rust Belt increases net policy benefits (air quality and climate benefits minus costs). However, I show that air quality co-benefits are highly sensitive to several assumptions such as the economic value assigned to premature mortalities and the magnitude of the health response expected from a given level of pollution. This thesis also estimates that carbon pricing generates greater air quality co-benefits for every ton of CO2 abated compared to an RPS, suggesting that carbon pricing may be more economically efficient (greater net benefits) relative to an RPS than previously thought. Finally, I show that RPSs have far-reaching economic impacts that have implications for their overall costs and benefits. This finding demonstrates the value of
employing economy-wide models to understand the overall economic and environmental impacts of such sector-specific policies, and makes the case for a comprehensive, economy-wide
approach for addressing air pollution and climate change. Thesis Supervisor: Noelle E. Selin
Acknowledgements
This thesis would not have been possible without the previous work of numerable scholars. I would like to acknowledge Sebastian Rausch for developing the economic model used in this work. Christopher Tessum also deserves recognition for creating the air pollution model used in this thesis and for his unfailing readiness to help. I am also grateful to Daniel Rothenberg and Mei Yuan for their patient assistance with programming challenges.
I am particularly thankful to Noelle Selin who gave me this opportunity and provided me with frequent advice and astute feedback at all stages of this thesis, and to Sergey Paltsev who generously offered critical advice on computable general equilibrium modeling.
I also feel fortunate to have been part of the stimulating intellectual environments of the
Technology and Policy Program and the Joint Program. I am grateful to fellow students for their patient listening and helpful feedback.
Finally, I would like to thank my wife Annie for agreeing to move to Boston with me and for steadfastly supporting me through these years.
Table of Contents
List of Figures ... 7 List of Tables ... 8 Chapter 1: Introduction ... 9 1.1 Problem introduction ... 9 1.2 Research questions ... 101.3 Approach and structure ... 11
Chapter 2: Power generation and human health ... 13
2.1 Air pollution impacts of power generation ... 13
2.1.1 Power sector in the Rust Belt ... 13
2.1.2 Factors determining power sector emissions ... 14
2.1.3 The path from emissions to pollution concentrations ... 15
2.1.4 Epidemiology of health effects ... 16
2.1.5 Air pollution and climate change ... 16
2.2 Rust Belt power sector impacts on air pollution and climate change... 17
2.3 Policy approaches ... 19
2.3.1 Overview of air pollution policy in the U.S. ... 19
2.2.2 Overview of climate policy in the U.S. ... 19
2.3.2 Renewable Portfolio Standards ... 21
2.4 Costs and benefits of climate policy ... 24
2.4.1 The cost-benefit framework... 24
2.4.2 Quantifying climate benefits ... 25
2.4.3 Quantifying air qualify co-benefits... 25
2.4.4 Quantifying costs ... 27
2.4.5 Comparing alternative policy approaches ... 27
Chapter 3: Modeling Framework ... 29
3.1 Computable General Equilibrium modeling with USREP... 29
3.1.1 Representing RPSs in USREP ... 33
3.2 Modeling emissions... 34
3.3 Modeling concentrations ... 35
3.4 Modeling premature mortalities ... 36
3.5 Estimating economic benefits of avoided mortalities ... 36
3.6 Estimating economic benefits of climate change mitigation ... 37
3.7 Policy scenarios ... 37
Chapter 4: Results and discussion... 41
4.1 Base case results... 41
4.1.1 Power mix effects ... 41
4.1.2 Economic output effects ... 43
4.1.3 CO2 emission effects ... 44
4.1.4 Air pollutant emission effects ... 47
4.1.6 Mortality effects ... 54
4.1.7 Overall costs and benefits ... 56
4.2 Uncertainty analysis ... 58
4.2.1 Uncertainty in the Concentration Response Function ... 58
4.2.2 Uncertainty in the Value of Statistical Life ... 58
4.2.3 Uncertainty in wind power costs ... 59
4.2.4 Uncertainty in the Social Cost of Carbon ... 60
4.3 Discussion ... 61
4.3.1 RPS impacts on the power mix ... 61
4.3.2 Health benefits ... 62
4.3.3 Economic costs ... 63
Chapter 5: Conclusions ... 65
5.1 Policy Implications ... 65
5.1.1 Implications for the costs and benefits of Renewable Portfolio Standards ... 65
5.1.2 Implications for climate policy instrument choice ... 66
5.1.3 Implications for the political economy of climate policy ... 67
5.1.4 Implications of economic spill-over effects on policy evaluation ... 68
5.2 Future Work ... 69
List of Figures
Figure 1: Power mix by region in 2016 ... 14
Figure 2: Air pollutant emissions intensity of the electricity sector, 2014 ... 17
Figure 3: Annual premature mortalities attributed to power generation... 18
Figure 4: Regions represented in USREP ... 31
Figure 5: Renewable generation requirement by RPS policy scenario in the Rust Belt... 39
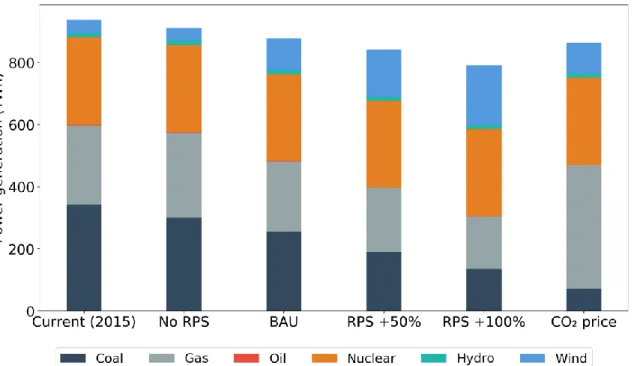
Figure 6: Power mix in 2030 by scenario and current (2015) power mix for the Rust Belt ... 42
Figure 7: Changes in output by sector relative to BAU scenario for the Rust Belt ... 44
Figure 8: CO2 emissions in 2030 by scenario and current (2015) emissions for the Rust Belt .... 45
Figure 9: Changes in CO2 emissions by sector and scenario in 2030 in the Rust Belt ... 46
Figure 10: Changes in CO2 emissions by sector and scenario in 2030 in areas other than the Rust Belt ... 47
Figure 11: Air pollutant emissions in 2030 by pollutant type and scenario and current (2015) emissions for the Rust Belt region ... 48
Figure 12: Changes in air pollutant emissions by scenario in 2030 for the Rust Belt region ... 49
Figure 13: Changes in air pollutant emissions by sector, scenario, and pollutant type in 2030 for the Rust Belt region ... 50
Figure 14: Changes in air pollutant emissions by sector and scenario in 2030 in areas other than the Rust Belt ... 51
Figure 15: Spatial distribution of SO2 and NOX emission changes in the BAU scenario relative to No RPS ... 52
Figure 16: Changes in 2030 PM2.5 concentrations (μg/m3) in BAU scenario relative to No RPS 53 Figure 17: Comparison of 2030 PM2.5 concentrations changes in RPS and carbon pricing scenarios ... 54
Figure 18: Changes in 2030 premature mortalities in the Rust Belt by scenario relative to No RPS ... 55
Figure 19: Spatial distribution of changes in 2030 premature deaths under BAU relative to No RPS by state ... 56
Figure 20: Costs and benefits in 2030 by scenario relative to No RPS ... 57
Figure 21: Changes in premature mortalities by scenario relative to No RPS (central estimates and 95% Confidence Intervals) for two different CRF assumptions ... 58
Figure 22: Health benefits by scenario relative to No RPS including VSL uncertainty ... 59
Figure 23: Net health benefits (health benefits – costs) by scenario and alternative wind power cost cases ... 60
List of Tables
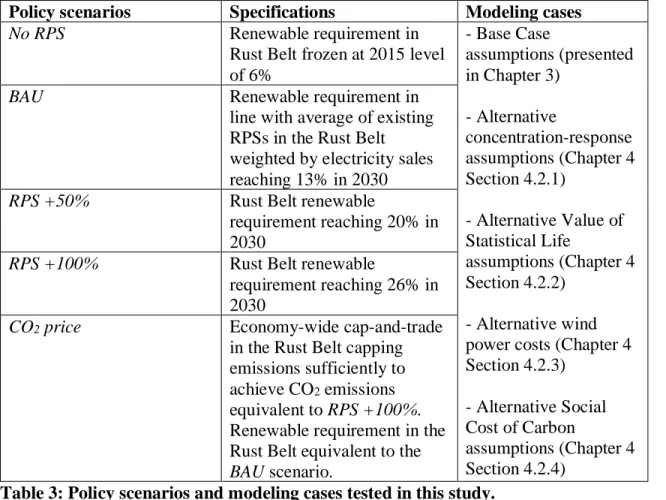
Table 1: Renewable requirements by RPS as of March 2018 ... 23 Table 2: USREP sectors and power technologies ... 31 Table 3: Policy scenarios and modeling cases tested in this study. ... 38
Chapter 1
Introduction
1.1 Problem introduction
Air pollution is an enduring problem in the U.S. Although it has been alleviated by policy responses, such as the Clean Air Act, and market forces, such as the increasing competitiveness of natural gas vis-à-vis coal, air pollution continues to harm human health. In 2016, ambient concentrations of PM2.5 were associated with just over 93,000 premature deaths, resulting in approximately 1,556,000 years of life lost (IHME, 2016).
The problem of air pollution shares commonalities with the problem of climate change. Air pollutants and CO2 are both byproducts of fossil fuel consumption. This overlap has led
researchers to consider whether reducing CO2 emissionscould, as a side effect, lead to decreases in air pollutant emissions, and as a result, cleaner air and improved human health. Previous studies have found that the clean air related health co-benefits of climate policy can be considerable (Nemet, Holloway and Meier, 2010), significant enough to exceed policy costs (Thompson et al., 2014). Therefore, accounting for air quality effects is an important step toward understanding the impacts of climate policy.
In the U.S., climate change mitigation is currently driven to a large degree by state-level lawmaking due to a lack of political willingness at the federal level. For lawmakers at the state level, a variety of possible policies exist but renewable energy instruments have emerged as particularly popular (Leiserowitz et al., 2018). In this category, Renewable Portfolio Standards (RPSs) are among the most prevalent renewable support policies (Carley and Miller, 2012). An RPS requires electricity suppliers to source a given percent of electricity from renewable power generating technologies. Such policies exist in 29 states and the District of Columbia. Across these jurisdictions, RPSs are the subject of frequent debates. State legislatures deliberated on a total of 181 RPS bills throughout the 2016 and early 2017 legislative sessions (Barbose, 2017). Future lawmaking in this area calls for an understanding of the costs and benefits of state RPSs. While not sufficient for the purposes of policy making, a cost-benefit analysis can aid decision-making by providing a systematic way of weighing different policy effects and comparing alternative policy designs (Arrow et al., 1996; Viscusi, Vernon and Harrington, 2005). This analytical framework further enables the comparison of RPSs to alternative policies. Although some researchers have critiqued the use of such analyses on practical and moral grounds (Ackerman and Heinzerling, 2002), they remain a fixture in U.S. policy making. Federal
agencies conduct them under the direction of executive order (Graham, 2007). State legislatures have also requested them specifically in regard to RPSs (Heeter et al., 2014).
Previous work on the costs and benefits of RPSs has only rarely addressed potential health co-benefits. A meta-analysis of state-commissioned legislative assessments found only one estimate
of health benefits made by a Delaware utility (Heeter et al., 2014). Peer-reviewed literature has studied air quality co-benefits using a variety of approaches including retrospective and
prospective modeling, as well as statistical methods, but has focused on aggregate or average impacts across all U.S. RPSs (Eastin, 2014; Mai et al., 2016; Wiser et al., 2016).
Due to the national scope of these analyses, it is not well understood how specific state RPS policies may impact local air quality or how such impacts factor in their overall costs and benefits. The effects of sub-national policies can differ substantially from national averages as marginal damages of pollution vary by source and location (Tietenberg, 1995; Siler-evans et al., 2013; Saari et al., 2015). The location of damages may also differ from the location of emission sources. The transboundary nature of air pollutants implies that the benefits of emission
reductions in one state may lower pollution concentrations in a downwind neighbor. Therefore, an assessment of local costs and benefits requires a sub-national modeling approach. The previous peer-reviewed literature includes two sub-national modeling studies undertaken for California and Colorado (Rouhani et al., 2016; Hannum et al., 2017).
Another challenge concerning RPS evaluation is the quantification of costs. Modeling studies have most commonly focused on estimating electricity system costs (Mai et al., 2016; Rouhani et
al., 2016; Wiser et al., 2016), thus leaving out considerations of the ripple effects that such
policies can have beyond the electricity sector. Sector-specific cost estimates may significantly underestimate the social costs of air pollution abatement (Hazilla and Kopp, 1990; Goulder, Parry and Burtraw, 1996). An alternative approach is the use general equilibrium approaches, which quantify economy-wide policy impacts (Thompson et al., 2014, Saari et al., 2015,
Hannum et al., 2017). To the author’s knowledge, Hannum et al. (2017) represents the only sub-national RPS study to quantify health co-benefits and total economic costs.
It can also be relevant to understand how RPSs compare to other climate policies. Economists often recommend carbon pricing as the most cost-effective mitigation policy (Pigou, 1932; Stern, 2006; Stiglitz et al., 2017). Modeling by Rausch and Mowers (2014) showed that a carbon price reduces CO2 emissions at a lower cost than an RPS. However, studies that account for air quality effects found that factoring in such co-benefits alters the relative cost-effectiveness of carbon pricing relative to other (non-RPS) policies (Boyce and Pastor 2013, Thompson et al., 2014, Driscoll et al., 2015, Knittel and Sandler 2011). This strand of the literature raises the question of how RPS policies compare to carbon pricing once air quality co-benefits are considered.
1.2 Research questions
This thesis builds on this literature by presenting a modeling assessment of the air quality co-benefits of sub-national RPSs, as well as their climate co-benefits and economic costs. This work focuses on the region comprising the following states: Pennsylvania, Ohio, Wisconsin,
Michigan, Illinois, Indiana, West Virginia, New Jersey, Maryland, and Delaware. This regional definition, which spans parts of the American Midwest, Rust Belt, and Mid-Atlantic regions, is based on the spatial aggregation of the economic model used in this thesis. For simplicity, the rest of this thesis refers to this region as the Rust Belt.
Information about RPS impacts may be particularly relevant in this region. RPS bills frequently feature on the legislative agenda of individual states, proposing to roll back, strengthen, or otherwise modify current policies (Colorado State University, 2018). The decisions taken on such bills may have important implications for human health due to the relative severity of air pollution in this region (Caiazzo et al., 2013; Jaramillo and Muller, 2016).
This work takes a prospective approach and explores projected future implications of RPSs. I compare projected costs and benefits across a number of policy scenarios informed by the current state of RPS debates. The scenarios are designed to assess the effects of existing RPSs in the Rust Belt region, the effects of alternative RPS stringency levels, and the effects of RPSs relative to carbon pricing. The specific research questions addressed in this thesis are outlined below:
1. How do projected 2030 health and climate mitigation benefits of the currently implemented RPSs in the Rust Belt region compare to their total economic cost? 2. How doprojected costs and benefits vary with policy stringency?
3. How do the projected costs and benefits differ between RPSs and carbon pricing?
1.3 Approach and structure
To address these questions, I develop a modeling framework that integrates a socioeconomic general equilibrium model and an air quality model. I use the economic model - the United States Regional Energy Policy (USREP) model – to explore how RPSs influence economic variables such as fuel use, production, consumption, the make-up of the electricity mix, and CO2 emissions. The air quality model – the Intervention Model for Air Pollution (InMAP) – simulates how changes in air pollutant emissions influence concentrations of PM2.5 and the resulting amount of premature mortalities. I further quantify the climate mitigation and health benefits in monetary terms for the purpose of cost-benefit analysis. These policy impacts are modeled for a number of policy scenarios as well as number of modeling cases representing different modeling assumptions.
The remainder of this paper is organized as follows. Chapter 2 introduces the characteristics of the air pollution effects of power generation in the U.S. and the Rust Belt region and discusses the link between the problems of air pollution and climate change. It goes on to outline policy approaches and describes the design of RPS policies in the U.S. The chapter then provides a review of the literature quantifying the costs and benefits of climate policy in general and RPS in particular, with a focus on the climate and air quality co-benefits and economic costs.
Chapter 3 describes the modeling framework developed to simulate the chain of policy impacts from changes in the economy to emissions, pollution concentrations, avoided mortalities, and resulting economic benefits of avoiding mortalities. It provides an overview of the USREP model, with an emphasis on how the electricity system is represented and the modeling of RPS impacts. The chapter then details how economic impacts are translated into impacts on air pollutant emissions, how InMAP is used to model pollution concentrations and mortalities, and how mortalities are translated into monetary impacts. It also discusses the quantification of climate benefits and closes with a description of the modeled policy scenarios. The assumptions
presented in this chapter represent Base Case modeling assumptions (the sensitivity of results to alternative assumptions are discussed in Chapter 4).
Chapter 4 presents the modeling results for the chosen policy scenarios. It further includes results for all policy scenarios based on alternative modeling cases using assumptions alternative to the Base Case to test the robustness of the presented results. The chapter closes with a discussion that places the results of this thesis in the context of the previous literature.
Finally, Chapter 5 discusses policy implications for the costs and benefits of RPSs, the relative merits of RPSs relative to carbon pricing, the political economy of climate policy, and the evaluation of climate policy. The chapter concludes with a discussion of the limitations of this study and how they may be addressed by future work.
Chapter 2
Power generation and human health
Power generation affects human health through a chain of events that lead from the power system to the emission of air pollutants, human exposure to air pollutants, and eventual health outcomes. This chapter begins with an introduction of the process through which power
generation impacts air pollution and human health (Section 2.1) and discusses the way in which air pollution is linked to the problem of climate change. The chapter then discusses the severity of the problems of air pollution and climate change in the Rust Belt region in particular (Section 2.2). It further reviews policy approaches to air pollution and climate change, including
Renewable Portfolio Standards (RPSs) (Section 2.3). Finally, this chapter provides a literature review on the costs and benefits of climate policy and RPSs (Section 2.4).
2.1 Air pollution impacts of power generation
This section introduces the way power generation influences air quality and human health. It first provides an overview of the Rust Belt power sector and next reviews the way in which power generation impacts human health by discussing the factors that determine power sector emissions, the path from emissions to concentrations, and the epidemiology of how pollutant concentrations affect human health. Finally, this section provides an overview of the relationship between the air pollution and climate change impacts of power generation.
2.1.1 Power sector in the Rust Belt
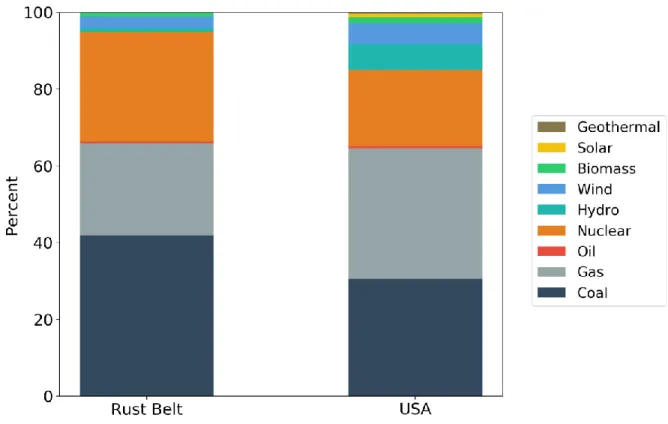
An important factor that determines the effect power generation may have on air pollution and human health is the mix of technologies used in the power system. In the Rust Belt region, electricity generation is currently skewed toward coal and natural gas burning power plants. In 2016, coal plants supplied 42% of the power generated in the region. Overall, fossil fuels provided 66% of the power. In comparison, the U.S. generated a similar portion of power from fossil fuel plants (65%) but used more natural gas (34%) than coal (30%) generation.
Renewable technologies, in contrast, supply a relatively small share of power generated in the Rust Belt region. In 2016, the renewable share equaled 5% compared to 15% in the U.S. Wind is the most common renewable power source in the Rust Belt, supplying 3% of the power
Figure 1: Power mix by region in 2016. Source: EIA 2017.
2.1.2 Factors determining power sector emissions
The combustion of fossil fuels leads to the formation and emission of a number of different air pollutants. When coal is burned to drive steam turbines, the sulfur contained in the fuel reacts with oxygen, resulting in SO2 emissions. The combustion process also releases nitrogen oxides (NOx), Particulate Matter (PM), referred to as primary PM, and heavy metals such as mercury. PM is a mixture of very small particles and liquid droplets, which is classified as either primary: released directly into the atmosphere; or secondary: formed by physical and chemical reactions from other pollutants (referred to as precursors). PM is further categorized by its aerodynamic particle diameter. The most commonly monitored types are PM10 (less than or equal to a
diameter of 10 micrometers) and PM2.5. PM2.5 particles are the subject of particular concern and regulatory focus as discussed below due to their small size, their diameter being 20 times smaller than that of a human hair, allowing particles to enter deep into the lungs and some to enter the bloodstream (EPA, 2018f). The combustion of natural gas in gas turbines releases NOx, PM, and negligible amounts of SO2 and mercury. Oil burning can release significant amounts of SO2 and NOx.
In addition to fuel type, power plant emission rates depend on the heat content of the fuel, a plant’s thermal efficiency, and the availability of pollution control technologies. Pollution controls in particular make a substantial difference. Existing technologies include Fluidized Bed Combustion, which removes up to 95% of sulfur from coal during combustion, and Flue Gas Desulfurization, which scrubs SO2 post-combustion, with new units having a 95-98% removal rate. Low-NOx burners and catalytic and non-catalytic converters and are also available to limit
NOx formation during combustion or remove it post-combustion. As of 2015, 40% of coal power plants in the U.S. lacked any SO2 pollution control technology, while 9% operated without NOx controls (Massetti et al., 2017).
When all factors underlying emission rates are accounted for, oil plants emerge as the highest SO2 and NOx emitting power plants in the U.S. per unit of energy. As of 2011, oil burning power plants released 2% more SO2 per MWh relative to coal, and approximately three times as much NOx (Massetti et al., 2017). With coal in the middle, natural gas plants have the lowest SO2 and NOx emission rates, emitting almost no SO2 and about six times less NOx than coal.
The total amount of emissions depends on both the emission rates and the prevalence of different power generating technologies. Overall, coal-burning power plants were responsible for 98%, 86%, and 83% of SO2, NOx, and PM2.5 emissions in the U.S. power sector respectively in 2011 (Massetti et al., 2017). This is a result of coal’s relatively high emission rates as well as coal’s significant share of the U.S. power mix, which stood at 44% in 2011. Natural gas power plants, which supplied 24% of the power demand in 2011, emitted <1%, 8%, and 12% of these air pollutants respectively. The remainders were mostly emitted by oil plants, which supplied less than 1% of electricity in 2011.
As a result of this heterogeneity in emission intensity of different power plants, the air quality impacts of the power sector are sensitive to the composition of the power mix. The share of coal, and the way in which it may be influenced by different policies, is a particularly relevant factor. Economic modeling of the power sector can be performed with a variety of tools including statistical and optimization approaches. In this thesis, I use optimization modeling. The last section of this chapter discusses the use of different approaches in the relevant literature.
2.1.3 The path from emissions to pollution concentrations
Once pollutants are emitted, they may impact humans directly or indirectly. Carried by winds, compounds can come in direct contact with humans. For instance, SO2 has been causally linked to respiratory problems, particularly for individuals with asthma (EPA, 2008). Pollutants may also react with other compounds in the atmosphere to form new chemical species, thereby impacting humans indirectly.
SO2 and NOx are particularly harmful as precursors to PM2.5 (EPA, 2011). These compounds react with ammonia (NH3) in the atmosphere to form inorganic secondary PM2.5, which is a major portion of overall PM2.5 concentrations that impact human health (EPA, 2009). Secondary organic PM2.5 concentrations can also result from emissions of Volatile Organic Compounds (VOCs).
NOx emissions can also be harmful as precursors to tropospheric ozone, which has been linked to respiratory diseases and premature death (Bell, Dominici and Samet, 2005; EPA, 2013a) NOx compounds form tropospheric ozone by reacting with anthropogenic and biogenic VOCs. This thesis does not estimate policy effects on tropospheric ozone but instead focuses on PM2.5, due to its greater impact on human health as discussed in the following section.
In addition to the emission of precursors, concentrations of secondary pollutants such as PM2.5 depend on meteorology. Temperature and humidity have non-linear effects on PM2.5 formation. Circulation patterns determine the long-range transport of compounds. PM2.5 particles can travel hundreds of miles (EPA, 2018g) due to their small size. Precipitation impacts the deposition of particles, thus influencing atmospheric concentrations in a given location.
2.1.4 Epidemiology of health effects
The next link in the chain of emissions to impacts is the effect of pollutant concentrations on human exposure and health outcomes. Human exposure to PM2.5 (for which researchers use PM2.5 concentrations as a proxy) has been documented to have a number of adverse health effects. A large body of epidemiological literature concludes that there is an association between PM2.5 concentrations and premature death (resulting from lung and cardiovascular diseases), which cannot be explained by chance or observable confounding factors (Dockery et al. 1993; Krewski et al. 2009; Lepeule et al. 2012). The presence of this epidemiological relationship between PM2.5 exposure and mortality is also supported by human exposure studies (e.g Mills et al. 2007; Peretz et al. 2008) and experimental biology work (e.g. Bouthillier et al. 1998; Vincent et al. 2001). On the basis of the evidence, the EPA has concluded that PM2.5 exposure is causally linked to premature mortality (EPA, 2009).
In the U.S., it has been estimated that PM2.5 was responsible for just over 93,000 premature deaths in 2016, resulting in just over 1,556,000 years of life lost (YLL) (IHME 2017). This makes it the main source of premature deaths due to air pollution. The other main contributor to early deaths, tropospheric ozone, has been linked to just over 12,000 premature deaths and approximately 172,000 YLL in the U.S. in 2016 (IHME 2017). Globally, it has been estimated that PM2.5 is responsible for more than 90% of mortalities related to air quality (Lim et al., 2012; Lelieveld et al., 2015).
The power sector is among the main contributors to PM2.5 related premature mortality. Dedoussi and Barrett (2014) estimated that approximately a quarter of premature deaths in 2005 are attributable to electricity generation. The majority of the mortalities linked to the sector (75%) came from SO2 emissions. The study found that the power sector was either the first or second largest contributor to early deaths, depending on the model used. Other major contributing sectors were the road transportation, industry and commercial/residential sectors.
2.1.5 Air pollution and climate change
The air pollution effects of the power sector are closely linked to the impact of power generation on climate change. Air pollutants and greenhouse gases (GHGs) are co-emitted in the process of fossil fuel combustion. The power sector in particular is a common contributor to both problems. As in the case of air pollution, the power sector is among the leading contributors to climate change in the U.S. In 2016, electricity generation was responsible for 28% of national GHG Emissions. It tied for first place with the transportation sector (EPA, 2018e).
Within the power sector, most GHG emissions resulted from coal burning, which released around 70% of GHGs in 2016. The remainder was emitted almost entirely by gas burning power
plants, with oil contributing a negligible portion. An important determinant of this distribution is the relative emissions intensity of different fuels. Coal combustion emits almost twice the amount of CO2 per unit of energy compared to gas (EPA, 2018e).
Air pollution is also linked to climate change due to the latter’s effect on weather patterns. As meteorology can influence the formation of air pollutants, climate change may indirectly affect air pollution. Atmospheric modeling and statistical analyses have suggested that future climate change may worsen air quality in the U.S., leading to a so-called climate penalty (Wu et al., 2008; Garcia-Menendez et al., 2015; Shen, Mickley and Murray, 2017).
2.2 Rust Belt power sector impacts on air pollution and climate change
The impacts of power generation on air pollution and climate change are particularly acute in the Rust Belt region. Due to its greater use of coal, the Rust Belt region emits larger quantities of air pollutants than the U.S. per unit of power produced (Figure 2, EPA 2017). The difference in emissions intensity is greatest for primary PM2.5 where it exceeds the U.S. average intensity by 72% and for SOx (which includes SO2 and SO4) emissions where it is 63% greater.
Figure 2: Air pollutant emissions intensity of the electricity sector, 2014. Sources: 2014 National Emissions Inventory (EPA, 2017a).
An additional factor contributing to the relatively high emissions of SOx is the higher sulfur content of Appalachian coal used by eastern power plants (EIA, 1993, 2001). The relatively lower disparity in NOx emission intensities can be partially explained by the greater share of gas
generation in the U.S. power mix. Disparities in the prevalence of emission control technologies also play a role in determining differences in emission intensities (EIA, 2011).
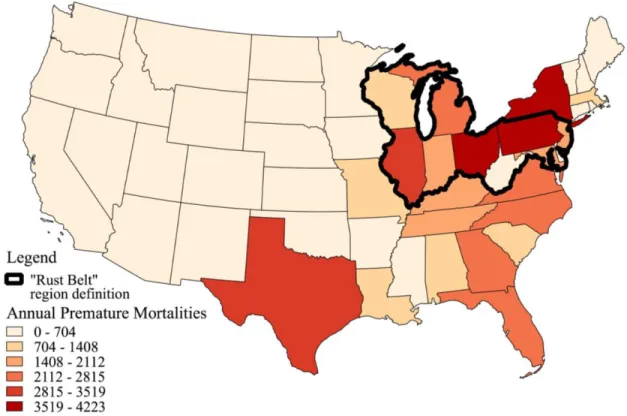
The differences in these emissions intensities imply that air pollution impacts may be more severe in the Rust Belt region. Modeling work has confirmed this hypothesis. Caiazzo et al. (2013) estimated premature mortalities by state that are associated with PM2.5 and ground level ozone exposure. They used atmospheric chemical modeling to simulate individual sector
contributions to 2005 mortalities. As illustrated in Figure 3, the estimates for annual early deaths associated with the power sector are highest for Ohio (4,223) followed by Pennsylvania (3854), New York (3744) and Illinois (3161). Jaramillo and Muller (2016) also estimated air quality related premature mortalities by state, finding that Pennsylvania, Ohio, and Indiana bear the highest number of mortalities, a key driver being the amount of coal-fired power generation in these states.
Figure 3: Annual premature mortalities attributed to power generation, estimated using 2005 emissions. Source: Caiazzo et al. (2013).
The Rust Belt region also stands out with regard to the CO2 emissions intensity of its power generation. In 2015, power sector emissions in the region equaled 542 Mt CO2 (EIA, 2018), while the region generated 1,005 TWh of electricity (EIA, 2017b), indicating an intensity of 0.54 Mt/TWh. In contrast, U.S.-wide power generation in 2015 had CO2 emissions intensity of 0.46 Mt/TWh.
2.3 Policy approaches
2.3.1 Overview of air pollution policy in the U.S.
The U.S. addresses air pollution through the Clean Air Act (CAA). Pollutants such as SO2, NO2, PM2.5, and ozone are classified as criteria pollutants. For these, the CAA grants the EPA
authority to set National Ambient Air Quality Standards (NAAQS). NAAQS define a level of atmospheric concentration “requisite to protect public health with an adequate margin of safety” (EPA, 2018c). To ensure compliance with NAAQS, the EPA has implemented additional
policies, such as the Cross-State Air Pollution Rule (CSAPR) cap-and-trade markets for SO2 and NOx emissions (another initiative under the CAA with impact on SO2 emissions is the Acid Rain cap-and-trade program, implemented specifically to control acid deposition).
The current NAAQS for PM2.5 as of 2012 specifies that concentrations cannot exceed an annual mean of 12 μg/m3. Most areas in the U.S. meet this standard. In the Rust Belt, only four counties are in non-attainment of the PM2.5 NAAQS, but these include relatively populous urban centers such as Cleveland, Ohio and Allegheny County, Pennsylvania (EPA, 2018d). In both states, the number of people who live in non-attainment areas exceeds 10% of the population (EPA, 2018d).
For areas in attainment of the NAAQS, air pollution continues to cause harm. This is in part due the limited authority of the EPA under the CAA as determined by case law. In Lead Industries v.
EPA, the court ruled that the CAA does not require the EPA to set NAAQS at a zero-risk level
(D.C. Circuit, 1980). Instead, the EPA promulgates standards that avoid “unacceptable risk of harm” (EPA, 2013b). Yet, the epidemiological literature has found no threshold for PM2.5 concentrations, below which exposure ceases to be harmful (EPA, 2009). On the contrary, the marginal mortality risk has been found to be higher at exposures below the 12 μg/m3 NAAQS (Di et al., 2017). Therefore, adverse health effects caused by PM2.5 can be expected to continue to occur despite the existence of the CAA.
2.2.2 Overview of climate policy in the U.S.
There is potential, however, for air pollution mitigation to occur as a co-benefit of climate policy. Because PM2.5 precursors and CO2 result from the same process of fossil fuel combustion,
climate policies that reduce fossil fuel use will abate both types of emissions. Climate policy can also influence air quality by mitigating the meteorological impact of climate change on air pollution (i.e. the climate penalty). This thesis does not model this latter effect, which is estimated to be smaller than the emission-related effects, as discussed further in Chapter 3. In the U.S., climate policy is currently largely contingent on state-level lawmaking. Following the 2016 election, the federal government is not expected to enact stringent climate legislation. This is most evident in the EPA’s proposal to roll back the Clean Power Plan rule, the landmark federal climate policy initiative of the Obama Administration (EPA, 2015a), replacing it with requirements for modest power plant upgrades (EPA, 2017b). The Administration’s proposed withdrawal from the Paris Agreement further signals a lack of intention to meet the U.S.
Additionally, incentives specific to renewables, such as the Production Tax Credit for wind and the Investment Tax Credit for solar, are scheduled to expire in 2020 and 2022 respectively. In the absence of federal support for climate policy, investment decisions are becoming more
dependent on state level policies. Even if new impetus for federal climate policy arises in the future, national policy may still provide substantial latitude to states to determine their own policy approaches, following the approach employed by the Clean Power Plan rule.
A number of states have committed themselves to reducing CO2 emissions. A bipartisan group of 16 states has formed the U.S. Climate Alliance, pledging to reduce their CO2 emissions by 26-28% from 2005 to 2025. Ten states have signed the Under2 Memorandum of Understanding, committing to abate CO2 emissions by 80-95% below 1990 levels by 2050 or to below 2 tons of CO2 per capita per year. The Governors of nine other states, including Ohio, Pennsylvania, and Illinois (members of the Rust Belt region as defined in this thesis) have made no public policy commitments but have expressed their support for the Paris Agreement (EESI, 2017).
There exists a wide range of climate policies. Economists generally distinguish between market-based and regulatory approaches. The former imposes a price on CO2, through a tax or a market for pollution permits (referred to as cap-and-trade), and lets the market determine how to reduce emissions. Another policy that can be considered to belong in this category is a subsidy that rewards CO2 mitigation equally for the amount of CO2 abated. In contrast, the regulatory type of policies encompasses a broad range of instruments, through which lawmakers seek to intervene in the economy directly, by imposing requirements or favoring specific CO2 abatement options through, for example, technology-specific subsidies.
While economists have argued in favor of carbon pricing as the least-cost climate policy (Pigou, 1932; Stern, 2006; Stiglitz et al. 2017), attempts to implement such instruments have consistently met resistance from lawmaking bodies and been abandoned or scaled back (Grubb, Hourcade and Neuhoff, 2014; Jenkins, 2014; Rabe, 2018). As a result, the scope of carbon pricing, both globally and in the U.S., remains limited (Zechter et al. 2017). In the jurisdictions where carbon prices do exist, most fall short of the EPA’s estimates for the marginal cost of CO2 emissions or the levels required to keep global warming below 2°C compared to preindustrial levels (Jenkins and Karplus, 2016; Stiglitz et al., 2017).
Given the low political acceptability of carbon pricing, the theory of the second best (Lipsey and Lancaster, 1956) suggests that alternatives may be warranted. Some economists have argued in favor of renewable subsidies as a way to mitigate climate change (Wagner, 2015; Jaccard, Hein and Vass, 2016). Other researchers have proposed a sequential strategy to decarbonization policy (Meckling and Kelsey, 2015). This approach leverages regulatory instruments such as clean energy subsidies, which engender a new political constituency in support of climate mitigation that can eventually lead to the implementation of least-cost climate policy.
Renewable energy policy can be considered as a distinct subset of regulatory climate policy. Policy instruments that support renewable energy have often been implemented as parts of climate policy portfolios such as California’s Global Warming Solutions Act of 2006 or been part of climate policy packages such as the most recent major attempt at federal climate policy –
the American Clean Energy and Security Act of 2009, which was passed in the House but lost support before reaching the Senate floor.
Yet, it must also be acknowledged that renewable energy policy may be pursued for purposes other than climate change mitigation. For example, lawmakers may use it as a vehicle to attract new industries to their jurisdictions. Case studies have suggested that economic development and job creation are common motivating factors (Stokes, 2015; Rabe, 2018). Rabe (2006) reported that, in many cases, climate mitigation is an ancillary rationale relative to the potential economic benefits. Economists have also argued that renewable energy policy may be justified as a
solution to market failures other than the emission of GHGs. In particular, researchers have contended that renewable technology is subject to technology and adoption spill-over related market failures, whereby knowledge accumulated by the investment of early movers spills over to other market participants, thus discouraging investment and encouraging free-riding (Jaffe, Newell and Stavins, 2005).
Regardless of their ostensible rationale, renewable energy policies form an important component of U.S. climate policy due to their relative popularity (Leiserowitz et al., 2018). Support for renewable energy among Americans has been on the rise. In 2018, 73% of 1,041 surveyed adults said they prefer the development of alternative energy sources to the production of more coal, oil, and gas, up from 66% in 2011 (Gallup, 2018). This preference for clean energy was found to be significant across the political spectrum, varying from 51% for Republicans to 88% for Democrats. Other surveys using a variety of question formulations have showed similar results, finding general support for the development of renewable energy among a majority of
Americans (Hart Research Associates, 2016; Pew Research Center, 2016; Public Opinion Strategies, 2016).
2.3.2 Renewable Portfolio Standards
RPSs are among the most prevalent renewable energy policies in the U.S. (Carley and Miller, 2012). Such policies exist in 29 states and the District of Columbia. Eight other states have voluntary RPSs (National Conference of State Legislators, 2018). An RPS requires electricity providers (technically referred to as Load Serving Entities) to provide a certain percent of energy or power from renewable sources by a given year. There is a wide diversity of RPS designs. While most require that a certain percentage of energy generation be renewable, there are two exceptions – Iowa and Texas – where the requirement is for a given amount of power capacity (expressed in MW).
It is common for RPS statutes to provide flexibility as to how renewable requirements are met. LSEs can choose to meet the requirement by installing and running their own renewable plants, purchasing Renewable Energy Credits (RECs) generated by other renewable facilities, or pay an Alternative Compliance Payment, the proceeds from which are commonly invested in state clean energy programs.
A REC is a commodity that certifies the generation of one MWh of renewable energy. Power providers comply with an RPS by surrendering the amount of RECs needed to cover the percent of renewable energy required by the statute. Regulators track the generation and retirement of
RECs through digital accounting systems. Most RPS laws allow RECs generated within the same regional grid (Levin, 2017).
RPS statutes specify the types of renewable energy technologies that qualify for REC generation. Many divide the overall renewable requirement into tiers that represent different types of
renewable technologies or construction dates (to distinguish between existing and new capacity). Lawmakers often single out specific technology types, such as rooftop solar panels, by creating carve-outs: portions of the renewable requirement that can only be met with the specified
renewable resource. For instance, Ohio requires 6.5% renewable generation in 2020 and calls for 0.26% of generation (4% of the renewable requirement) come from solar power (N.C. Clean Energy Technology Center, 2018b).
Table 1 (next page) displays the range of RPS requirements by state. The percentages represent total renewable requirements including both broad requirements and carve-outs for specific technologies. As illustrated, RPS targets vary from Ohio’s 7% in 2020 to Vermont’s 59%. Across these states, RPSs are the subject of frequent debates. State legislatures deliberated on a total of 181 RPS bills throughout the 2016 and early 2017 legislative sessions (Barbose, 2017). Some of these bills sought to raise the renewable percentage requirement, such as Pennsylvania’s Senate Bill 291 from 2017. Others proposed to weaken or altogether repeal the requirement, such as Ohio’s House Bill 114, which as of this writing is being deliberated in the state’s Senate, having already passed through the House.
RPS discussions are ongoing in other Rust Belt states as well (Colorado State University, 2018). In Indiana, which currently has a voluntary RPS in place, a bill for a mandatory requirement, SB0318, was introduced in 2018. Minnesota’s 2018 legislative session also included an RPS bill, which proposed an increase to the renewable requirement. In Wisconsin, two RPS bills featured in the 2017 legislature. In Michigan, the Public Service Commission, which regulates the state’s electricity market, will consider plans by the two largest utilities, DTE Energy and Consumers Energy, to reach a 25% renewable energy target by the year 2030 (Samilton, 2018).
Most Rust Belt states are also nearing the final year of their RPS statutes (Barbose, 2017), which raises questions about whether states will legislate new targets, or whether renewable
requirements will remain at the last value stipulated in current legislation. For Pennsylvania, the last RPS target year is 2020. In Minnesota, Illinois, Delaware, the final year is 2025 and in Ohio it is 2026. In Wisconsin, the RPS requirement has not been changed since it reached its final target in 2015.
Given that RPSs will likely continue to demand space on legislative agendas, it is pertinent to understand how alternative RPS decisions compare against one another on the basis of economic costs and benefits. Studying RPSs has relevance outside of the U.S. as well since such policies are commonly used in other countries and jurisdictions. As of 2015, at least 59 jurisdictions had implemented mandatory renewable energy targets (IRENA, 2015). Such policies exist at the national level in all European Union countries, China, India, South Korea, Japan, Australia Mexico, Chile, and elsewhere (IEA/IRENA, 2018).
State 2020 2025 2030 Comment Arizona 10% 15% California 33% 42%* 50% Colorado 30% Connecticut 28% Delaware 20% 25% Hawaii 30% 35%* 40% Illinois 18% 25% Maine 40% Maryland 25% 25%* Massachusetts 15% 20% 25% Michigan 13% 15% Minnesota 22% 25% Missouri 10% 15%
Montana renewable requirement of Montana’s RPS specifies a 15% by 2015 Nevada 22% 25% New Hampshire 21% 25% New Jersey 21% New Mexico 20% New York 29% 40%* 50% North Carolina 10% 13% Ohio 7% 12% 13% Oregon 20% 27% 35% Pennsylvania 8% Rhode Island 16% 24% 31% Texas 10GW by 2025 (approx. 10% of 2012 summer net capacity) Vermont 59% 66% 72% Washington 15%
Wisconsin Wisconsin’s RPS specifies a renewable requirement of 10% by 2015
Table 1: Renewable requirements by RPS as of March 2018. Iowa’s standard requiring 105 MW by 1999 has been excluded. States in bold are the focus of this thesis. * denotes
2.4 Costs and benefits of climate policy
This section provides an overview of previous work on the costs and benefits of climate policy. It begins with a critical assessment of the cost-benefit framework. Following is a description of common approaches toward quantifying climate benefits. Next, I describe previous research on quantifying air quality co-benefits of climate policy and identify a gap in the literature
concerning air quality co-benefits of sub-national RPSs. The section then reviews the
quantification of policy costs and limitations in existing understanding of the total economic costs of RPSs, which this thesis seeks to address. Lastly, I discuss how the cost-benefit
framework has been used to compare alternative policy approaches in previous literature and the way this thesis fills a knowledge gap regarding the way RPSs compare to carbon pricing.
2.4.1 The cost-benefit framework
The cost-benefit framework has both advocates and critics. Proponents have argued that it enables a transparent assessment of alternative decisions that forces an explicit consideration of the underlying assumptions (Viscusi, Vernon and Harrington, 2005). By expressing costs and benefits in the same monetary units, it provides a consistent way of expressing disparate information (Arrow et al., 1996) and protects against cognitive biases (Sunstein, 2000). On the other hand, critics like Ackerman and Heinzerling (2002) countered that assumptions are rarely made clear outside of technocratic circles. They also asserted that the framework imposes a utilitarian perspective that does not appropriately account for issues of equity.
In the context of climate change, Grubb, Hourcade and Neuhoff (2014) argued that cost-benefit analyses are made impractical by the difficulty of quantifying costs and benefits and the presence of low-probability but potentially catastrophic outcomes, suggesting that a risk-management framework may be more applicable to climate change. Morgan et al. (2017) similarly advocated for a framework of identifying and avoiding climate thresholds as an alternative to cost-benefit analysis.
Notwithstanding these critiques, cost-benefit analyses remain a fixture in U.S. policy making. Federal agencies conduct such studies under the direction of executive order (Graham, 2007). State governments also perform or commission cost-benefit analyses (The Pew Charitable Trusts, 2013). Some have requested such evaluations specifically with regard to RPSs (Heeter et
al., 2014).
Case studies confirm that, while not sufficient, a cost-benefit analysis serves an important role in evidence-based policy making. It can be useful during particular stages of the policy making process such as assessments by appropriations committees where cost concerns must be addressed before policy proposals can move forward (Mosley and Gibson, 2017). In the environmental realm, the quantification of benefits along with costs can enable policy making based on net-benefit maximization as an alternative to financial affordability criteria (Graham, 2007).
A comprehensive review of climate policy costs and benefits is beyond the scope of this thesis. Climate policy confers a wide range of benefits in addition to climate change mitigation (The
Global Commission on the Economy and Climate, 2014). The focus of this work is on
quantifying the air pollution related health co-benefits of climate policies, as well as their climate mitigation benefits and economic costs.
2.4.2 Quantifying climate benefits
A common approach to estimating the benefit of CO2 emission abatement is the use of the Social Cost of Carbon (SCC). The SCC represents the discounted future monetary impacts of an
incremental ton of CO2 on the global economic system including effects on agriculture, human health, physical property, and ecosystem services. In the U.S., the Interagency Working Group on Social Cost of Greenhouse Gases (IWG) has recommended SCC values based on results from three Integrated Assessment Models (IAMs) - DICE, FUND, and PAGE - which represent the interactions between the economic system and climate processes. For instance, the central value for the SCC in 2020 is $42/tCO2, expressed in 2007 dollars (IWG, 2016). The National Academy of Sciences has endorsed this approach but recommended a number of improvements such as the development of a new single IAM, more advanced treatment of feedbacks and linkages, and expert elicitation regarding key uncertainties, among others (NAS, 2017).
Some researchers have urged caution with regard to the SCC. Pindyck, (2013) asserted that “IAMs are of little or no value in evaluating alternative climate change policies and estimating SCC”. The criticism centers on the fact that there is a large amount of uncertainty involved at different stages of the modeling process including emission projections, climate response, and economic impact. (Morgan et al., 2017) contended that analyses of marginal impacts cannot capture the risk of catastrophic climate impacts. An estimate for the costs of climate change ceases to be useful when there is even a low probability of a high-impact outcome that would result in costs that cannot be compensated for financially.
However, SCC is commonly used for regulatory analyses in the U.S., such as the EPA’s analysis of the Clean Power Plan (EPA, 2015b). As a means of capturing the marginal impact of low-probability high-impact outcomes, the IWG has recommended the use of an additional “High Impact” SCC value, which represents the 95th percentile of the SCC probability distribution computed by IAM models and is equal to $123/tCO2 in 2020 (IWG, 2016).
2.4.3 Quantifying air qualify co-benefits
Assigning a monetary value to the air quality co-benefit of climate policy remains a critical challenge for researchers and policy makers. The previous literature has taken a variety of approaches and estimated values that span three orders of magnitude, with one global meta-analysis reporting a range of $2/tCO2 to $196/tCO2 (Nemet, Holloway and Meier, 2010).
A common approach is to translate premature mortalities into monetary terms using Willingness-To-Pay methods (Schelling, 1968). This method measures either demonstrated preferences (through contingent valuation surveys) or revealed preferences (hedonic wage studies using on-the-job risk exposure and wage data) of people’s willingness to pay or accept a compensation for changes in the probability of death. Using a range of previous estimates derived from both categories of methods, the EPA estimated a central Value of Statistical Life of $7.4 million in
2006 dollars (EPA, 2014). Some researchers have argued against the notion that the value of life can be quantified (Ackerman and Heinzerling, 2002). Alternative approaches to monetizing health effects include the modeling of impacts on labor and demand for health services (Saari et
al., 2015) and calculating avoided cost of compliance with mandatory air pollution regulations
(Bye, Kverndokk and Rosendahl, 2002). However, regulatory impact analyses often employ the VSL approach as a means of representing the value people may place on avoided mortality risks. Modeling studies using VSL-based monetization methods suggest that health co-benefits can be on the same order of magnitude as climate benefits (as expressed by the SCC). Thompson et al. (2014) estimated co-benefits related to both PM2.5 and ozone effects of an economy-wide carbon price in the U.S., arriving at a central estimate of $170/tCO2 in 2030. West et al., (2013) tested the impacts of the RCP4.5 climate scenario (a global carbon pricing policy, which achieves 2100 radiative forcing of 4.5 W/m2) on the PM
2.5 and ozone related health effects, as well as, on the health effects resulting from the mitigation of the climate penalty. The researchers found a worldwide average co-benefit of $50-380/tCO2, and $30-600/tCO2 for the US and Western Europe.
Previous studies have also estimated co-benefits of RPS policies at the national level. Wiser et
al., (2016) provided a retrospective comparison of the aggregate 2013 costs and benefits of all
U.S. RPSs against a counterfactual scenario with no RPSs in the U.S. The authors estimated a central co-benefit of $88/tCO2 or ¢5 for each kWh of renewable generation triggered by RPSs. Mai et al., (2016) modeled aggregate U.S. RPS costs and benefits up to 2050, estimating health co-benefits of $11-39/tCO2 or 1.2-4.2¢/kWh.
Despite previous interest in RPS co-benefits, the effects of specific state RPSs are not well understood as evaluations of sub-national policy impacts are rare. A survey of state-level analyses in the U.S. included only five studies on RPS effects on air pollutant emissions, only one of which, prepared by a Delaware utility, evaluates the resulting human health impacts (Heeter et al., 2014). Modeling of RPS health effects has also been conducted for California and Colorado (Rouhani et al., 2016; Hannum et al., 2017).
A sub-national modeling approach is necessary to understand local impacts, as health effects can differ dramatically by location. Co-benefit estimates by Saari et al. (2015) for a carbon price in the U.S. exhibit a standard deviation across 11 U.S. regions of $3/tCO2 around a mean of $6/tCO2. Siler-evans et al., (2013) further demonstrated the regional variation in the health benefits of renewable generation. The researchers estimated that health, environmental (such as visibility and agricultural losses), and climate damages avoided by a wind turbine or solar panel installed in a given location in the U.S. are in the range of 0.3-10¢/kWh. A significant factor influencing this variation is the type of fossil fuel generation displaced by renewable generation. The authors contrast a wind turbine in California, where the displaced fossil fuel is natural gas, estimated to provide 0.3¢/kWh in health benefits, and an identical turbine in Indiana providing a benefit of 8.3¢/kWh due to the displacement of coal-based generation.
2.4.4 Quantifying costs
The economic costs of RPSs are only partially understood, as the RPS literature has most
commonly estimated policy costs using electricity system models or other approaches focused on the electricity sector (Wiser et al., 2016, Mai et al., 2016, Rouhani et al., 2016). While sector-specific models allow for a detailed bottom-up representation of the sector of interest, they preclude the calculation of the total economic costs of a policy. For instance, they do not capture the spillover effects caused by changes in the electricity price on other sectors of the economy. As an alternative, researchers often use economy-wide Computable General Equilibrium (CGE) models. Such models have been widely used in climate policy co-benefit studies (Thompson et
al., 2014, 2016; Saari et al., 2015) but, to the author’s knowledge, the only RPS study to use a
CGE approach in the peer-reviewed literature is by Hannum et al. (2017) who model the impacts of Colorado’s RPS.
The EPA has suggested that CGE models may be preferable when a policy can be expected to impact a wide number of sectors (EPA, 2014). Previous literature has argued that accounting for general equilibrium interactions is particularly important when analyzing the impacts of climate and energy policy (Bhattacharyya, 1996; Wing, 2009). Such approaches have showed that sector-specific model estimates substantially underestimate the social costs of air pollution abatement (Hazilla and Kopp, 1990; Goulder, Parry and Burtraw, 1996). By employing a CGE model, this thesis builds on the RPS literature by assessing the economy-wide impacts of RPSs.
2.4.5 Comparing alternative policy approaches
The cost-benefit framework enables a comparison between alternative climate policies. The most common approach in the literature is on the basis of economic costs relative to climate benefits expressed as the cost of mitigating one ton of CO2. By this measure, carbon pricing emerges as the most efficient climate policy (Stern, 2006; Stiglitz et al., 2017), while other approaches are often referred to as “second-best”. By equalizing marginal CO2 costs across the economy, carbon prices ensure that CO2 emissions are reduced where it is cheapest to do so. An important
assumption in this analysis is that mitigation options are treated equally for each ton of CO2 abated and compared purely on the basis of their economic cost. A recent study from this
literature (Rausch and Mowers, 2014) compared carbon pricing to an RPS at the national level in the U.S. and showed that the latter results in larger welfare costs for the same amount of CO2 abatement.
However, accounting for co-benefits may alter the conclusion of pure cost-per-ton comparisons. Boyce and Pastor (2013) found that different climate mitigation options have different air quality co-benefits because the ratio of air pollutants to CO2 emissions varies considerably across CO2 sources. They concluded that a policy that treats CO2 emission reductions as equivalent, as does carbon pricing, is less than optimal.
For illustration, one could consider what would happen under a carbon price when co-benefits vary by mitigation option. A price on carbon imposes the same cost per ton of CO2 on all sources, inducing companies to choose between abatement options purely based on relative
economic costs. In a hypothetical case where upgrading a coal plant with CCS is cheaper than replacing the coal plant with renewable energy, carbon pricing would result in the
implementation of the CCS option, even though the second alternative delivers greater air quality co-benefits for each ton of CO2 abated. Indeed, if the difference between the implementation cost and the co-benefit (which can be considered the “net cost”) is lower for the renewable energy option, then carbon pricing becomes less efficient than a policy that favors renewables over CCS. Conversely, carbon pricing may be more efficient if the mitigation options that prevail under it are the ones that also provide higher co-benefits.
Driscoll et al. (2015) provided a comparison between carbon pricing and a policy that combines demand-side energy efficiency improvements with an Emission Performance Standard. The carbon pricing scenario was found to deliver fewer projected avoided mortalities per ton of CO2 abated than the latter scenario. In the former case, CO2 abatement was partially provided by Carbon Capture and Storage, which allows fossil fuel power plants to continue to operate and emit air pollutants.
Thompson et al. (2014) presented a comparison between a carbon price and a clean energy standard (CES) in the power sector, with both scenarios reducing an equivalent amount of CO2 emissions. Consistent with Driscoll et al. (2015), the second-best CES policy was found to confer a greater air quality benefit than carbon pricing ($302/tCO2 compared to $170/tCO2). However, it imposed a significantly higher cost ($255/tCO2 compared to $17/tCO2), resulting in a lower net benefit. Saari et al. (2015) found the same pattern for the costs and benefits of CES relative to carbon pricing, as did Thompson et al. (2016) for the case of regional policies in the Rust Belt region. These results suggest that carbon pricing is indeed more efficient (delivering greater net benefits) than a CES, but that the difference in efficiency decreases after air quality co-benefits are considered.
In contrast, Knittel and Sandler (2011) used a statistical analysis to show that higher-emission vehicles are more responsive to carbon pricing or gasoline taxation than cleaner vehicles. The authors concluded that these policies would deliver higher reductions in air pollutant emissions than fuel efficiency regulations, which reduce, rather than increase, marginal cost of an extra mile traveled. Therefore, their work suggested that a consideration of air quality co-benefits make fuel efficiency standards even less efficient in comparison to pricing policies.
It remains unclear, however, how RPSs compare to carbon pricing. This thesis builds on this literature by assessing the efficiency of RPSs relative to carbon pricing under a cost-benefit framework that accounts for health co-benefits.
Chapter 3
Integrated modeling framework
An examination of how emissions from electricity generation affect human health requires an integrated analysis of the chain of events that lead from the electricity system to eventual health outcomes. To follow this chain of impacts, I integrate the United States Regional Energy Policy (USREP) model with the Intervention Model for Air Pollution (InMAP). This section describes USREP (Section 3.1), the use of USREP to model Renewable Portfolio Standards (RPSs) (3.1.1), the estimation of resulting air pollutant emissions (3.1), and the application of InMAP to
translate emissions to pollution concentrations (3.3) and premature mortalities (3.4). I then describe the estimation of the economic benefits of avoided premature mortalities (3.5), and the economic benefits of climate change mitigation (3.6). Finally, I detail the policy scenarios designed to explore the impacts of alternative policy options (3.7).
The modeling choices presented in this chapter represent the Base Case modeling assumptions chosen to estimate the impacts across policy scenarios. An uncertainty analysis that tests how results for each policy scenario change under alternative assumptions will be presented in Chapter 4 Section 4.2.
3.1 Computable General Equilibrium modeling with USREP
I use the Computable General Equilibrium (CGE) model USREP to estimate the economic effects of energy policy to 2030. These include changes in the power mix, fuel usage, and economic output, which help determine how policies affect air pollution, as well as simulate changes in overall economic consumption, which serve as a gauge for the cost of policy. This section introduces CGE modeling and discusses the rationale behind using CGE for modeling energy policy. It then describes USREP and the model updates implemented for this study. The distinguishing characteristic of CGE models is their economy-wide scope. CGE modeling represents the consumption and production decisions by households and producers using standard economic utility and production functions respectively. These functions are
parameterized using an Input-Output table, which represents the flows of all goods and services throughout the economy for a given baseline year, as well as elasticities of substitution between goods and services derived from econometric literature. The functions assume optimizing behavior in the form of welfare maximization and cost minimization by consumers and
producers respectively. Supply and demand are matched across all markets through non-linear optimization until an economy-wide general equilibrium is reached.
An important feature is the representation of the circular flows in the economy based on the economic theory of general equilibrium formalized by Arrow & Debreu (1954). CGE modeling simulates the supply of products from producers to consumers (households) and, in turn, the supply of factors of production (labor and capital) from households back to producers. A flow of
payments runs in reverse to this flow of goods and services. By representing this important economic feedback loop, CGE modeling captures not only the consumption and production decisions made throughout the economy but also the interactions between them.
By introducing changes to the underlying economic assumptions, researchers can test how the general equilibrium outcome changes as a result of new policy. A CGE model can thus estimate how a policy that affects one sector, such as electricity, would affect the rest of the economy, and in turn how these effects will feed back into the electricity sector.
This capability offers three main advantages relevant to the scope of this thesis. First, it allows the estimation of the economy-wide macroeconomic impacts, including costs, of energy policies, in contrast to sector-specific models such as electricity capacity expansion models. Second, CGE modeling makes it possible to assess how emissions of air pollutants from unregulated sectors respond to electricity-sector policies such as RPSs. Third, a CGE framework provides the
capacity to model policies that span multiple sectors of the economy, such as carbon pricing, and compare these to sector-specific policies in a consistent manner using the same modeling
framework. However, these advantages come with the disadvantage of representing individual economic sectors using top-down production functions, thereby forgoing certain important technological details (Tapia-Ahumada et al., 2014). Later in this section, I discuss in more detail how electricity technologies are represented in USREP.
The model used in this thesis, USREP, implements a CGE approach, which was described by Yuan, et al. (2017). Here, I review some of the main features relevant to this work. USREP is recursive-dynamic CGE model, simulating the temporal evolution of the economy in sequential five-year periods based on the assumption that economic agents are myopic, making their decisions with information available in each five-year period. While, this thesis presents future projections of policy impacts, it must be underscored that dynamic CGE modeling does not provide forecasts of the future. Instead, it produces what-if scenarios of potential future states given a host of uncertain underlying assumptions.
The model aggregates the economy into 10 sectors listed in Table 2, including fuel production, electricity and energy-intensive industry, and transportation, thus allowing for the separate
representation of major emission sources. The model contains 12 U.S. regions shown in Figure 4. Most relevant for this thesis is the representation of the electricity sector. The present model version represents 12 electricity generating technologies listed in Table 2. As in Rausch and Karplus (2014), it differentiates between “legacy” technologies, prevailing at the time of the model’s baseline year (2006), as well as a number of new advanced technologies. The legacy technologies include coal, gas, oil, nuclear, and hydro plants, and the advanced technologies are combined cycle gas turbines, single-cycle gas turbine, wind, biomass, advanced nuclear,
pulverized coal with CCS and NGCC with CCS. Additionally, as in Paltsev et al. (2005), the model includes two combined technologies representing wind with single-cycle gas turbine backup and wind with biomass backup. Following Yuan et al. (2017), all technologies are treated as perfect substitutes.