HAL Id: hal-03110160
https://hal.umontpellier.fr/hal-03110160
Submitted on 20 Jan 2021HAL is a multi-disciplinary open access archive for the deposit and dissemination of sci-entific research documents, whether they are pub-lished or not. The documents may come from teaching and research institutions in France or abroad, or from public or private research centers.
L’archive ouverte pluridisciplinaire HAL, est destinée au dépôt et à la diffusion de documents scientifiques de niveau recherche, publiés ou non, émanant des établissements d’enseignement et de recherche français ou étrangers, des laboratoires publics ou privés.
Distributed under a Creative Commons Attribution - NonCommercial - NoDerivatives| 4.0
Effect of the Molecular Structure of
Poly(3-hydroxybutyrate- co -3-hydroxyvalerate)
(P(3HB-3HV)) Produced from Mixed Bacterial Cultures
on Its Crystallization and Mechanical Properties
Julie Bossu, Helene Angellier-Coussy, Cedric Totee, Mariana Matos, Maria
Reis, Valérie Guillard
To cite this version:
Julie Bossu, Helene Angellier-Coussy, Cedric Totee, Mariana Matos, Maria Reis, et al.. Effect of the Molecular Structure of Poly(3-hydroxybutyrate- co -3-hydroxyvalerate) (P(3HB-3HV)) Produced from Mixed Bacterial Cultures on Its Crystallization and Mechanical Properties. Biomacromolecules, Amer-ican Chemical Society, 2020, 21 (12), pp.4709-4723. �10.1021/acs.biomac.0c00826�. �hal-03110160�
E
ffect of the Molecular Structure of
Poly(3-hydroxybutyrate-co-3-hydroxyvalerate) (P(3HB-3HV)) Produced from Mixed Bacterial
Cultures on Its Crystallization and Mechanical Properties
Julie Bossu,*
Hélène Angellier-Coussy,*
Cedric Totee, Mariana Matos, Maria Reis, and Valérie Guillard
Cite This:Biomacromolecules 2020, 21, 4709−4723 Read Online
ACCESS
Metrics & More Article Recommendations*
sı Supporting InformationABSTRACT: Poly(3-hydroxybutyrate-co-3-hydroxyvalerate) (P-(3HB-3HV)) copolymer’s properties depend on (i) the molar fraction of comonomers, (ii) the overall molar mass, and (ii) the chemical compositional distribution. This work aims at providing a better understanding of the effect of the P(3HB-3HV) molecular structure, produced from mixed cultures and waste feedstock, on copolymer crystallization and tensile properties. Conventional biopolymer characterization methods (differential scanning calo-rimetry, X-ray diffraction, and polarized optical microscopy) were coupled to both classical one-dimensional (1H and 13C) and
advanced two-dimensional (diffusion-ordered spectroscopy (DOSY) and 1H/13C heteronuclear single quantum coherence
(HSQC)) nuclear magnetic resonance (NMR) spectroscopy
techniques. The obtained results evidenced that (i) a high-quality copolymer could be achieved, even from a waste feedstock; (ii) increasing the 3HV content displayed a positive impact on P(3HB-3HV) mechanical properties only if good interactions between 3HB and 3HV moieties were established; and (iii) the purification process eliminated short-length 3HV-rich chains and promoted homogeneous co-crystallization. Such optimized microstructures enabled the maximal stress and strain at break to be increased by +41.2 and +100%, respectively.
■
INTRODUCTIONAmong the polyhydroxyalkanoate (PHA) polymer family, poly-(3-hydroxybutyrate) (P(3HB)) and its copolymer poly(3-hydroxybutyrate-co-3-hydroxyvalerate) (P(3HB-3HV)) are mi-crobial biopolyesters that are attracting new interest to substitute petro-based polymers1−3 due to their complete biodegradability in natural conditions,4,5 biocompatibility and nontoxicity,6,7 and thermoplastic properties. P(3HB-3HV) copolymers are generally preferred to P(3HB) polymers since the incorporation of 3HV chains enables a broader processing window and an improved materialflexibility to be reached, by decreasing crystallinity, melting temperature, and glass tran-sition temperature.8 Nonetheless, fluctuating processing per-formances have been reported in the literature between P(3HB-3HV)s having a similar 3HV content. It has beenfirst ascribed to the type of feedstock and the feeding strategy used for P(3HB-3HV) production.9,10 Second, the production conditions are also known to strongly impact the structural characteristics of copolymers, i.e., (i) the molar fraction of the monomer units, (ii) the molar mass, (iii) the chemical compositional distribution, and (iv) the crystalline structure.11All of these factors influence the functional properties of P(3HB-3HV)-based materials. This is why an accurate characterization of the structural properties of P(3HB-3HV) produced from waste feedstock by mixed culture
must be performed to better predict the product quality according to itsfinal application.
Regarding the chemical compositional distribution aspect, four main different kinds of architectures could be achieved: blends of P(3HB) and P(3HV) homopolymers, with no copolymerization; alternating copolymers; random copolymers; and finally, block copolymers. It has been shown that block copolymerization offers the highest technological perform-ances,12,13 leading to physical properties that would not otherwise be achieved from random copolymers of the same average composition.14,15
Commercially available P(3HB-3HV) are produced from pure feedstock and pure microbial culture, requiring sterile conditions. The costs associated with such production systems remain the principal obstacle to a larger production at the industrial scale. The use of mixed bacterial cultures constitutes a more realistic and sustainable approach for large-scale
Received: May 29, 2020
Revised: October 5, 2020
Published: October 29, 2020
Article
pubs.acs.org/Biomac
copying and redistribution of the article or any adaptations for non-commercial purposes.
Downloaded via INRAE on January 20, 2021 at 16:43:30 (UTC).
production of lower-cost copolymers since it avoids complex sterilization steps and enables the use of complex substrates such as agricultural or food residues.16,17However, in the case of feedstock displaying a high variability of composition, the structure and the properties of the copolymer are more difficult to predict. Still, specific feeding strategies can be used to manipulate the copolymer composition and broaden the range of theirfinal applications.17−19Block copolymers could possibly be produced from mixed feedstock and bacterial resources.10 However, for P(3HB-3HV) produced from activated sludge and having 3HV contents higher than 10 mol %, Laycock et al.20 observed that complex blends with a broad compositional distribution of random and/or block copolymers of very different 3HV contents were obtained. In this case, the degree of compatibility of the components in the melt affected crystallization and mechanical properties. Therefore, besides overall composition, studying the exact structure of the copolymer is of increasing interest to better understand and controlfinal properties. Finally, the purification step must also be considered to manipulate polymer composition since fermentation residues (metal, crude biomass, etc.) could remain and then modify P(3HB-3HV)’s properties.21,22
Despite that state of the art in pure cultures of isolated or genetically modified P(3HB-3HV) producing bacteria is largely documented, a better understanding of the influence of the processing steps on the structure and the properties of P(3HB-3HV) produced by mixed cultures is still needed. Most of the existing studies rely on inferred properties based on HV overall content, polymer purity, melting properties, and molar mass to characterize the quality of the copolymers.9 Here, one may wonder if such classic testing routines are sufficient to properly describe the quality of the P(3HB-3HV) products. In addition, overall, it is important to identify what are the most relevant features to be tested to evaluate the suitability of a certain copolymer for a targeted use. Still, only rare studies report on both the complete characterization of the complex micro-structure and the mechanical performances, which is often a critical factor in selecting polymers for specific applications. Furthermore, the effect of the extraction and purification processes on the copolymer structure and properties has not been clearly studied so far.
Nuclear magnetic resonance (NMR) offers the chance to monitor the chemical composition and distribution of monomer units.23Still, some authors reported that classical NMR methods were not adequate for distinguishing between relatively narrow compositional distribution copolymers.20 To meet our objectives, two-dimensional NMR has thus been considered in this work, using DOSY (diffusivitiy-1H)24and HSQC (1H/13C heteronuclear single quantum coherence) methods to precisely characterize the structural properties of the products. Based on the complementarity of these NMR techniques and conven-tional methods used for PHA characterization (like differential scanning calorimetry, X-ray diffraction analysis and polarized optical microscopy), this work provides a quantitative and qualitative analysis, of the chemical composition and micro-structure of bacterially synthesized P(3HB-3HV) copolymers produced by mixed cultures. Here, the structure−property relationships of the produced polymer were studied to answer the following questions:
• What are the achievable structural and mechanical properties of P(3HB-3HV) produced from a mixed
microbial culture and agro-food residues as a feedstock at pilot-plant scale?
• What is the effect of the observed structural properties on the copolymer crystallization mechanism?
• Which structural changes result from the purification step and can they further improve the overall material performance?
The characterization methods necessary to well predict the final properties of P(3HB-3HV) were also discussed. We finally aimed at reporting the realistic, achievable tensile properties of copolymers produced from waste feedstock and mixed bacterial cultures compared to those of commercial PHAs.
■
EXPERIMENTAL SECTIONMaterials. Polymer Synthesis. The P(3HB-3HV) product was obtained at pilot-plant scale from apple fruit residues (FCT-UNL, Portugal), with a high 3HV content ranging between 18 and 19% (denoted PHBV18%), according to gas chromatography analysis. Regarding the production process, 3 pilot-plant reactors were assembled to carry out the pilot-plant scale production. The feedstock was fermented into the precursors for PHA production in an upflow anaerobic sludge blanket (UASB) reactor with a 100 L working volume. This reactor was inoculated with granular sludge from a full-scale anaerobic digester (Leça do Balio, Portugal) and was operated in continuous mode using a hydraulic retention time (HRT) of 1 d, an organic loading rate (OLR) of 25.7± 2 g-COD·L−1·d−1(pH at 4.9± 0.1, controlled using sodium bicarbonate added in the feed) and temperature of 29.9± 0.3 °C. The fermented stream obtained had the average composition (in % g-COD basis) lactate (12± 8%), acetate (18 ± 2%), propionate (7 ± 1%), ethanol (5 ± 3%), butyrate (53 ± 10%) and valerate (5± 2%) and was used to feed the two subsequent steps of the process. A culture selection reactor (100 L) was set up to enrich a mixed microbial culture with PHA-producing microorganisms. It was inoculated with activated sludge from a wastewater treatment plant (Almada, Portugal), operated as a sequencing batch reactor (SBR), and fed with the fermented apple waste under a feast and famine regime in 12 h cycles. The SBR was operated using an OLR of 200 C-mmol·L−1· d−1, and the HRT and sludge retention time (SRT) were maintained at 1 and 4 days, respectively. The organic-acid-rich stream obtained in the acidogenic reactor was fed as carbon source diluted with a mineral solution25to adjust the reactor OLR. Additionally, a nutrient solution containing ammonia and phosphate was fed to the reactor 120 min after the feedstock feeding, keeping the C/N/P ratios at 100:7:1.
Fed-batch assays were performed to produce PHA in a 60 L reactor using the PHA-accumulating culture selected in the second stage and the fermented feedstock obtained in thefirst step. A pulse-wise feeding approach, based on the dissolved oxygen response, was used to control the feeding of the substrate. At the end of the accumulation assays, an average product yield of 78± 2% (C-mmol basis) and an average PHA cell content of 66± 11% (wt %) were obtained. Extraction from the dried cells and purification of the polymer were performed with nonorganic compounds (Biotrend, Portugal, confidential patent-pending technology). After thefirst round of purification, a moderated purified polymer was obtained (denoted PHBV18%-P1) with a recovery yield of 66.1% (wt %). The second round of purification, following the same protocol, was then performed to produce a high-purity polymer (denoted PHBV18%-P2). In this second purification step, a recovery yield of 91.4% (wt %) was achieved.
Additional commercial grades of P(3HB) and P(3HB-3HV) having a 3HV molar content of 1−3 mol % according to the supplier (denoted PHBV3%), in the form of pure uncompounded powder with no additive, were purchased from Biomer (Germany) and Tianan Industry (China), respectively, for comparison.
Preparation of P(3HB-3HV)-Based Films for Mechanical Testing. P(3HB-3HV)-basedfilms were prepared to further characterize the impact of the molecular structure on the mechanical performances of the tested materials. Films with an average thickness of 0.3 mm were formed from the raw powders using a heated hydraulic press (20 T,
Pinette Emidecau Industries, Chalon-sur-Saône, France), without adding any additive such as nucleating agents. The melting temperature was set according to Tm(refer to the paragraph describing differential scanning calorimetry methods). The pressure wasfirst set to 5 bars for 1 min to melt the powder, and then progressively raised from 5 to 150 bar in 30 s before stabilization at 150 bars during 30 s.
Methods. Inductively Coupled Plasma-Atomic Emission Spec-troscopy (ICP-AES). To quantify the total content in inorganic compounds and their elemental composition, 0.5 g of samples was subjected to pyrolysis at 550°C for 24 h. The resulting ashes were dissolved in 20 mL of H2SO4(25% V/V). The solution content in inorganic compounds was analyzed by inductively coupled plasma-atomic emission spectrometry (ICP-AES) (Horiba Jobin-Y, France, Ultima).
Gel Permeation Chromatography (GPC). The number-average molecular weight (Mn), weight-average molecular weight (Mw), and polydispersity index (Mw/Mn) were determined by GPC. Samples were dissolved in chloroform (CHCl3) for 18 h under agitation,filtrated on a glass fiber filter (47 mm PALL, P/N 6163), and stored at room temperature under normal atmosphere and protected from light until their analysis. For size exclusion chromatography analysis (Waters Millenium system), 100μL was injected at 30 °C, with a flow rate of 1 mL·min−1.
Nuclear Magnetic Resonance (NMR) Spectroscopy. 1D NMR Analysis. Samples were dissolved in deuterated chloroform (CDCl3) to a concentration of 10 mg·mL−1at 60°C for 12 h and filtrated with 20 μm poly(tetrafluoroethylene) (PTFE) syringes. 1H and 13C NMR spectra of P(3HB) and P(3HB-3HV) copolymers were recorded on a Bruker spectrometer Ascend III HD operating at 400 MHz for protons and 100 MHz for carbons. The 3HV molar contents of the different samples were determined from1H-coupled13C NMR spectra. The1H NMR spectra were recorded at 25°C, with 3 kHz for the spectral width, 1600 Hz for the transmitter frequency offset, 3 s for the acquisition time, and four scans. Quantitative conditions were obtained with a 30° pulse (3μs) and a relaxation delay of 1 s (D1). The13C NMR spectra were recorded at 25°C, with 29 kHz for the spectral width, 1 kHz for the transmitter frequency offset, 0.8 s for the acquisition time, 4096 scans (NS) with a 30° pulse (3.3 μs), and a relaxation delay of 5 s (D1).1H decoupling was applied during acquisition (waltz-16 with a pulse of 90 μs). The solvent resonance peak was used as a chemical shift reference at 7.26 ppm for1H and 77.0 ppm for13C NMR.
Statistical Analysis from Integrated Signals. It was reported that the sequence distribution of 3HB and 3HV units in P(3HB-3HV) could be calculated from integrated NMR spectra and Bernoullian statistics.26 The molar fractions of each diad and V-centered triad were experimentally obtained from the integrated signals of the resonance peaks from1H and13C NMR quantitative spectra as follows. F
Band FV, corresponding to the molar fractions of 3HB and 3HV units, respectively, were obtained by integrating signals from methylene groups from1H NMR spectra. FVV, FBV, FVB, and FBBwere obtained by integrating signals from carbonyl groups from13C NMR spectra, where FXYrepresented the molar fraction of the XY sequence. Experimental results were compared to molar fractions estimated satisfically from the Bernoullian model (eq 1).
= = = × =
FVV ( ) ;FV2 FVB FBV FV FV; FBB ( )FB2 (1) The chemical compositional distribution could be assessed by the parameter D, which is calculated from the experimental mole fractions of the diads (eq 2) and allows evaluating the extent of the deviation of the copolymer composition from the statistically random (Bernoullian) compositional distribution.26This was previously applied to P(3HB-3HV).9,15,26−28 = × × D F F F F VV BB BV VB (2)
where FBB, FVV, FBV, and FVBare the fractions of the BB, VV, BV, and VB diad sequences respectively.
2D NMR Analysis. First, two-dimensional 1H/13C heteronuclear single quantum coherence (HSQC) spectra were recorded using the
standard Bruker sequence hsqcetgpsi2. Compared to 1D NMR spectra, the 1H/13C HSQC spectrum provides a more detailed biochemical fingerprint, providing correlations between a carbon and its attached protons. 2D 1H/13C HSQC experiments were carried out with a spectral width of 3 kHz for1H with a center at 3200 Hz and 30 kHz for 13C with a center at 10 000 Hz. The relaxation delay was 1 s, 1J(CH) was 145 Hz, and the number of scans was set to 2. A double Fourier transform (FT) was provided (16K× 2K) without linear prediction in both dimensions. Second, the diffusion rate of the different molecular structures present in the products was analyzed to obtained two-dimensional 1H/diffusion-ordered spectroscopy (DOSY) spectra. Indeed, the apparent diffusion rate associated with a molecular resonance can be estimated by performing a series of experiments, varying the amplitude of the inhomogeneousfield and inverting the corresponding decay curve of the signal amplitude.24DOSY spectros-copy is thus a particularly convenient means of displaying this information, organized in a bidimensional array with the NMR spectrum on one dimension and the apparent diffusion rate on the other one. This method enables us to distinguish between groups having similar or different diffusion properties: two molecules displaying the same diffusion rate are considered to be attached, while one molecule having a larger diffusion rate than the second is considered to be independent and larger. The standard sequence used was stegp1s from the standard Bruker library. The 1D1H experiment wasfirst done to determine and set the gradient distance (called the big delta parameter) and gradient length (little delta parameter). The number of scans was set to 8, the relaxation delay was set to 30 s, the spectral width was set to 2400 Hz (center at 1200Hz), and 64 experiments were linearly done between 2 and 98% of the maximum gradient strength. A single FT and a baseline correction were done for each experiment, and results were displayed with a pseudo-2D spectra organized in a bidimensional array with the NMR spectrum on one dimension and the apparent diffusion rate on the other one.
Differential Scanning Calorimetry (DSC). DSC analyses were then carried out using a calorimeter (Q200 modulated DSC, TA Instruments, New Castle) under a nitrogen atmosphere. Non-isothermal crystallization of the products has been monitored using the following heating/cooling protocol: (i) afirst heating step until Tmax, allowing the thermal history of the polymers to be erased, followed by a stabilization step at Tmaxduring 3 min; (ii) then, a cooling step down to 0°C, followed by a stabilization step at 0 °C during 3 min; and (iii)finally, second heating step until 190 °C. Heating and cooling rates were set to 10°C·min−1. Tm1and Tm2were the melting temperatures registered during thefirst and the second heating steps, respectively. Tmax was set to Tm1 + 15 °C for P(3HB) and low-3HV-content PHBV3% (i.e., 190°C), which has been proved to be adapted for P(3HB),29,30and to Tm1+ 25°C for high-3HV-content PHBV18%-P1 and PHBV18%-P2 (i.e., 165 °C) in order to be sure to reach a homogeneous melt of 3HB and 3HV moieties. To determine Tm1, and thus Tmax, a preliminary heating scan was performed for each sample. After that, a complete heating/cooling/heating cycle was applied to a new set of polymer samples. The overall theoretical crystallinity Xcwas calculated accordingly toeq 3. = Δ Δ X H H c m m0 (3)
whereΔHm0is the melting enthalpy of a pure P(3HB) crystal, i.e., 146 J· g−1.3131 Xc1 and Xc2 were calculated from thefirst and the second melting enthalpies, respectively.
Wide-Angle X-ray Scattering (WAXS). Wide-angle X-ray scattering (WAXS) experiments were performed with an in-house setup of the Laboratoire Charles Coulomb, Université Montpellier, France. A high-brightness low-power X-ray tube, coupled with aspheric multilayer optic (GeniX3Dfrom Xenocs), was employed. It delivers an ultralow divergent beam (0.5 mrad,λ = 0.15418 nm). Scatterless slits were used to give a clean 0.6 mm beam diameter with aflux of 35 Mphotons/s at the sample. We worked in a transmission configuration, and scattered intensity was measured by a 2D“Pilatus” 300 K pixel detector by Dectris (490× 600 pixels) with a pixel size of 172 × 172 μm2, at a
distance of 0.2 m from the sample. All intensities were corrected by transmission, and the empty cell contribution was subtracted.
Polarized Optical Microscopy (POM). POM observations were realized on a Laborlux11POLS Leitz microscope equipped with a Leica DFC420 camera. Each sample was placed between two glass slides, then heated onto a Mettler FP82HT hot stage to Tmaxat 10°C·min−1and annealed for 3 min before being cooled at the same rate until 80°C and stabilized for 60 min before observation.
Tensile Properties. ISO1/2 samples were cut from thefilms and stabilized for 5 days at 25°C and 50% relative humidity (RH) prior to testing. Tensile properties were measured on stabilized samples using a tensile tester (Zwick BZ2.5/TN1S, Metz, France) with a cross-head speed of 1 mm·min−1. Young’s modulus, strain and stress at break, and energy at break were calculated from stress−strain curves with the MATLAB program. For each formulation, 10 replicates were characterized.
■
RESULTS AND DISCUSSIONClassical Testing Methods. ICP: Purity of the PHBV18% Product. To study the effect of one or two purification steps on PHBV18% chemical composition, IPC measurements were carried out (Table 1). The first observation was that one
purification step was sufficient to reach a satisfying purity of the copolymer, with the value obtained for PHBV18%-P1 being 99.41% (Table 1a). Also, it could be underlined that a second purification step did not further improve the polymer purity. The polymer purity of PHBV18%-P2 was measured to be 98.57%, showing no significant difference with PHBV18%-P1 since the measurement error was 0.5%.
The second observation concerned the amount of impurities. Surprisingly, a larger amount of inorganic compounds was quantified after the second step of purification. To better characterize these residues, a complete elementary analysis was carried out (Table 1b). Most of the impurities consisted of calcium elements, and a larger amount was present in the sample after the second step of purification (2.61 and 11.30 mg·g−1of P(3HB-3HV) for PHBV18%-P1 and PHBV18%-P2, respec-tively). Such residues likely originated from the inorganic solvents used for extraction and purification.
DSC: Thermal Properties. The thermal properties of the PHA powders are summarized in Figure 1 and Table 2. The first heating scan was used for the determination of the melting temperature (noted Tm1inTable 2).
P(3HB) and PHBV3% both displayed one unique and narrow melting peak centered at around Tm1= 176.5°C for P(3HB) and Tm1= 174.5°C for PHBV3% and crystallization temperatures of
around 82°C (Tc= 81.9°C for P(3HB) and Tc= 82.8°C for
PHBV3%). These temperatures meet the results reported in the literature.32−34The thermal behavior of PHBV18% was quite different from the ones observed for the two commercial PHAs, with, however, little difference between the two levels of purification. For PHBV18%-P1 and PHBV18%-P2, crystalliza-tion occurred at a higher temperature than for P(3HB) and PHBV3%, i.e., Tc= 96.7°C for PHBV18%-P1 and Tc= 97.4°C for PHBV18%-P2. It is worth noting that such a comparison is delicate since the crystallization temperature is known to strongly depend on the preheating conditions (temperature and duration) before the cooling ramp.35In the case of P(3HB), it was demonstrated that a premelting step at 190°C was a good compromise between complete erasing of thermal history and the absence of thermal degradation of the polymer. It was also reported that spherulites of P(3HB-3HV) containing 0−25 mol % 3HV were commonly formed only after melting above 184°C, to avoid self-seeding by unmelted P(3HB) nuclei at lower temperatures.36 However, expecting that such a high temper-ature would have thermally degraded PHBV18% samples,37a Table 1. Purity Analysis of PHBV18%
(a) purity PHBV18%-P1 PHBV18%-P2 polymer purity 99.41% 98.57% % g of the polymer/g of the sample
inorganic impurities 0.59% 1.43% % g of the polymer/g of the sample
(b) elements detected element concentration (mg·g−1PHBV) element c.d.o. (nm) PHBV18%-P1 PHBV18%-P2 Al 396 152 0.17 0.08 B 249 773 0.00 0.00 Ca 422 673 2.61 11.30 Cu 224 700 0.01 0.00 Fe 259 940 0.17 0.17 K 766 490 0.20 0.00 Mg 279 553 1.07 0.91 Na 588 995 0.07 0.10 P 214 914 1.39 1.40 Si 251 611 0.16 0.14 Sr 407 771 0.00 0.00 Zn 213 856 0.02 0.01
Figure 1.DSC thermograms of P(3HB) and PHBV3% commercial products and PHBV18% produced from mixed feedstock (where P1 and P2 indicate one or two purification steps, respectively), after first heating at Tmax. Raw data is available at this link:https://doi.org/10.15454/XGU22L.
preheating at 165°C was chosen in the present study. It was thus difficult to be sure that a complete and homogeneous melting was achieved and that self-seeding was avoided in such conditions. This point will be further deeply investigated in a forthcoming study.
The most striking difference between PHBV18% and the commercial P(3HB) and PHBV3% was the double melting peak observed at 140± 0.5 and 150 ± 0.3 °C. This feature has already been observed by many authors for P(3HB-3HV) copolymers having a 3HV content ranging from 5 to 20 mol %.38,39Multiple melting peaks were ascribed to the presence of high- and low-melting copolymers, with micro and/or macrophase separation leading to domains of differing composition.20 Yoshie et al.40 proposed that double peaks were likely due to the melting of the P(3HB)-rich crystals and of complete cocrystals. Žagar et al.28 even specified that random P(3HB-3HV) showed a single melting peak, whereas P(3HB-3HV) blends or block copoly-mers showed multiple melting peaks in their DSC thermograms. From these results, PHBV18% might be considered as a blend or a block copolymer.
The degree of crystallinity could also be used to assess the chemical compositional distribution of a copolymer. The authors proved that for a similar overall copolymer composition, the degree of crystallinity of block copolymers is lower than that of the random copolymer samples.41 Theoretical values of crystallinity (Xc) could be estimated from the melting enthalpy
of samples. It is worth noting that obtained values have to be interpreted carefully due to confounding factors such as the need to quantify the enthalpy of melting of a crystal of an infinitely large thickness and the degree of crystalline perfection for P(3HB-3HV) of the correct composition.42,43However, it could at least be used to evaluate the effect of the purification level on the overall crystallinity of PHBV18%. Crystallinity was decreased with the increasing 3HV content, from 70.8% for P(3HB) down to 54.8% for PHBV18%-P1 and 49.9% for PHBV18%-P2. This observation also highlighted that the second cycle of purification was in favor of a decreased crystallinity, which could facilitate co-crystallization.
Still, the complexity of P(3HB-3HV) copolymers is difficult to be inferred solely from melting behavior. Apart from the
presence of different copolymers in a blend, multiple melting peaks can also be attributed to (i) melting, recrystallization, and remelting during heating, (ii) the presence of more than one crystal modification, (ii) different morphologies, (iv) physical aging, (v) different molecular weight species, and (vi) orientation effects.20 Finally, a unique peak is not always representative of a single microstructure and can be a result of the overlapping of two melting peaks of two different structures having similar thermal properties.40DSC analysis emphasized the need for a more precise characterization of the complex structure of the PHBV18% produced in this study.
GPC: Polydispersity and Molar Mass. Gel permeation chromatography experiments were performed on PHBV18% to test if purification can have a marked effect on the overall copolymer polydispersity and molar mass. The results obtained for P(3HB) stand here as the homopolymeric reference. The polydispersity of PHBV18% decreased from the unpurified state after a single round of purification (Figure 2a). It illustrates the homogenization of the copolymer chains after purification. Also, the average molar mass increased after the first step of purification (Figure 2b). The second result indicates that the copolymer obtained after purification is composed of heavier elements and thus presumably longer chains. Nonetheless, as for DSC, only small changes are observable between PHBV18%-P1 and PHBV18%-P2, relying on GPC analysis.
WAXS: Crystalline Microstructure. WAXS patterns measured for the four studied polymers are shown in Figure 3. The copolymers displayed the same pattern as P(3HB), as previously observed for P(3HB-3HV) with 3HV content lower than 47 mol %.45,44
Typical diffraction peaks at 2θ = 13.6, 17.1, and 25.8° correspond, respectively, to the (020), (110), and (121) diffraction planes of the P(3HB) homopolymer lattice. Copolymers showed similar WAXS patterns, with no evidence of reflections relating to the P(3HB-3HV) crystallographic structure.
The lattice parameters a, b, and c of the P(3HB) crystalline lattice were calculated using eqs 4 and 5 (Table 3). The interplanar distance dhklof a crystal structure is determined by
the Bragg’s law Table 2. DSC Keys Values
Tm1(°C) ΔH1(J·g−1) Xc1(%) Tc(°C) Tm2(°C) ΔH2(J·g−1) Xc2(%) P(3HB) 176.5 103.4 70.8 81.9 173.6 85.4 58.5 PHBV3% 174.3 97.0 66.4 82.8 169.9 74.3 50.9 PHBV18%-P1 137.7 80.0 54.8 96.7 140.0; 150.0 69.1 47.3 PHBV18%-P2 138.5 72.8 49.9 97.4 139.5; 149.7 63.4 43.4
Figure 2.(a) Mean polydispersity index and (b) molar mass (Mw) from GPC analysis of P(3HB), PHBV3%, and PHBV18%, depending on purification (unpurified; after one purification: PHBV18%-P1; after two purification steps: PHBV18%-P2).
λ= θ
n 2dhklsin nhnknl (4)
where n is the reflection number, θ is the angle of the diffracted beam, andλ is the wavelength. The interplanar distance dhklis a
function of Miller indexes (hkl) and the lattice parameters (a, b, c), as given by the following equation for an orthorhombic lattice
= + + d h a k b l c 1 / / / hkl 2 2 2 2 2 2 (5)
The crystalline lattice parameters were calculated from the (020), (110), and (121) diffraction peaks corresponding to 13.59° (d = 1.302 nm), 17.08° (d = 0.519 nm), and 25.83° (d = 0.344 nm), respectively, for P(3HB). The parameters a = 0.566 nm, b = 1.3030 nm, and c = 0.584 nm were in good agreement with previous estimations.20The commercial-grade PHBV3% displayed exactly the same crystallographic structure. Increasing the 3HV content up to 18 mol % induced a decrease of the angular positions of the (020) and (121) reflection planes, indicating that the unit slightly expanded in the directions perpendicular to these planes. This was highlighted by the significant increase of a and b but also of c (chain direction)
(Table 3). As shown by Wang et al.,45this indicated that the
3HV unit co-crystallized into the P(3HB) crystalline lattice, thus expanding and losing the lattice. As for DSC and GPC analysis, little differences were noticed between PHBV18%-P1 and PHBV18%-P2. Still, after the second cycle of purification, an increase of c (fiber period) was noticed, allowing us to assume that co-crystallization was favored. (020), (110), and (121) diffraction peaks were, respectively, at 13.50° (d = 1.311 nm), 16.93° (d = 0.523 nm), and 25.63° (d = 0.347 nm) for PHBV18%-P1 and 13.47° (d = 1.314 nm), 16.90° (d = 0.524 nm), and 25.55° (d = 0.365 nm) for PHBV18%-P2.
Relying only on classical testing methods, i.e., ICP, DSC, GPC, and WAXS analysis, PHBV18%-P1 and PHBV18%-P2 thus appeared to be comparable. Without any other complementary characterization, one could conclude from these results that a second purification step did not seem to be beneficial for the copolymer, leading to equivalent quality based on these classical measurements. In this study, a more precise analysis was done to properly describe the molecular structures obtained to be able to differentiate them.
Figure 3.WAXS patterns of the studied polymers.
Table 3.a, b, and c Crystalline Lattice Parameters Calculated from WAXS Patterns
a (nm) b (nm) c (nm) P(3HB) 0.566 1.303 0.584 PHBV3% 0.566 1.303 0.588 PHBV18%-P1 0.572 1.308 0.590 PHBV18%-P2 0.572 1.314 0.686
1D NMR.1H QUANTI. The1H NMR analysis was conducted
on powder products where quantitative conditions could be reached with a 30° pulse (3 μs) and a relaxation delay of 1 s (D1). This method enabled comparing the overall molecular composition of the different PHAs studied. The 1H NMR
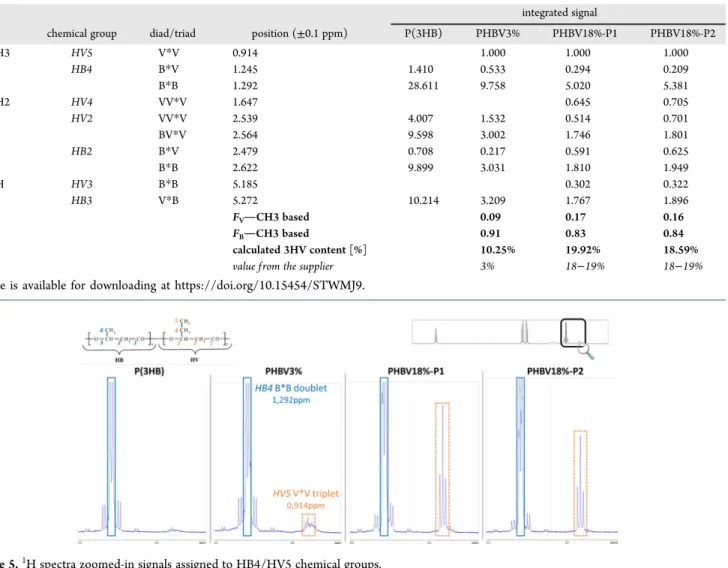
spectra obtained for commercial products and self-made copolymers exhibited typical peaks of PHAs (Figure 4).9,26,27,46 Each peak observed was assigned to a specific chemical group of the copolymer structure (HBi and HVi, i being the carbon number, are the different chemical groups present in the copolymer structure, as illustrated in the top left corner of Figure 4), according to its chemical displacement (summarized inTable 4). The peaks associated with 3HV units were distinguishable in comparison to the P(3HB) homopol-ymer spectrum and enable the 3HB and 3HV moieties in PHBV3% and PHBV18% copolymers to be differentiated. Also, the absence of additional peaks confirmed the structure of the studied products and the absence of additional substances coming from the dissolution processing step (like solvents or impurities).
The molar fractions of 3HB and 3HV moieties (noted FBand FV) were then estimated by integrating the signal intensity of the
resonance signals of −CH3 groups at 0.914 and 1.292 ppm,
characteristic for the protons HV5 (detectable for both PHBV3% and PHBV18%, contrary to HV4 and HV3, which were not detectable for PHBV3%) and HB4, respectively (see
the zoom-in inFigure 5). The calculated 3HV molar contents for each product are reported in Table 4. For PHBV3%, surprisingly, the 3HV content calculated from the integrated
1H integrated peaks were computed to be 10.25%, i.e., almost
three times superior to the theoretical 3HV content according to the supplier. In this case, the small peak observed for HV5 was most likely too small to enable a correct estimation of 3HV content based on the signal integration method. For P(3HB-3HV) copolymers with a low 3HV content, a higher magnetic field is thus required to calculate accurate integrated signals. For PHBV18%, results are consistent with the 3HV content previously reported by the supplier (18−19% based on gas chromatography with flame ionization detector (GC-FID) analysis, data not shown), i.e., 19.92% for PHBV18%-P1 and 18.59% for PHBV18%-P2. Here, it is interesting to observe that purification had no visible effect on the general structure of the spectra (peak intensities are identical) but modified the composition of the copolymer by reducing the overall proportion of 3HV units. At this stage, it can be thus assumed that the second step of purification allowed removing 3HV monomers or 3HV-rich oligomers.
13
C QUANTI. The13C NMR spectra were recorded using a1H
decoupling method to enable a quantitative analysis of the integrated peaks. Quantitative conditions could be approached (as best without T1 measurements) with a 30° pulse (3.3 μs) and a relaxation delay of 5 s (D1). As for proton analysis, the Table 4. Integrated Signals Calculated from1H NMR Quantitative Analysisa
integrated signal
chemical group diad/triad position (±0.1 ppm) P(3HB) PHBV3% PHBV18%-P1 PHBV18%-P2
CH3 HV5 V*V 0.914 1.000 1.000 1.000 HB4 B*V 1.245 1.410 0.533 0.294 0.209 B*B 1.292 28.611 9.758 5.020 5.381 CH2 HV4 VV*V 1.647 0.645 0.705 HV2 VV*V 2.539 4.007 1.532 0.514 0.701 BV*V 2.564 9.598 3.002 1.746 1.801 HB2 B*V 2.479 0.708 0.217 0.591 0.625 B*B 2.622 9.899 3.031 1.810 1.949 CH HV3 B*B 5.185 0.302 0.322 HB3 V*B 5.272 10.214 3.209 1.767 1.896 FVCH3 based 0.09 0.17 0.16 FBCH3 based 0.91 0.83 0.84 calculated 3HV content [%] 10.25% 19.92% 18.59% value f rom the supplier 3% 18−19% 18−19%
aTable is available for downloading at https://doi.org/10.15454/STWMJ9.
products studied showed typical13C NMR spectra of PHAs,
where the different chemical groups could be identified based on their chemical displacement (Figure 6). The peaks observed corroborate the results found in the literature.9,26,27The calculi of the overall 3HV content of PHBV18% products, obtained by integrating the signal intensity of the resonance signals of−CO groups at 169.16 and 169.54 ppm, characteristic for the protons HB1 and HV1, respectively (the complete table of the integrated
13C NMR signals is available for downloading at https://doi.
org/10.15454/STWMJ9), are consistent with the 3HV content
previously calculated from1H NMR, i.e., 19.97% for PHBV18%-P1 and 18.51% for PHBV18%-P2 (19.92 and 18.59% being the results obtained from1H NMR). The decrease of the overall 3HV content with the second round of purification is thus confirmed.
Peaks corresponding to 3HV units were not detectable for PHBV3%. Here, again, this observation confirmed that the 400 MHz magnet used for this study did not enable us to reach a satisfying precision to calculate 3HV moieties for
low-3HV-content P(3HB-3HV) products. However, the peaks were clearly visible and exploitable for PHBV18%.
In the case of13C NMR spectroscopy, the peaks associated with 3HB and 3HV groups were identical for PHBV18%-P1 and PHBV18%-P2. However, other additional peaks were observed at a lower intensity between 3HB and 3HV signals (identified as peaks W, X, Y, and Z inFigure 6). Such intermediary peaks are supposed to represent correlative interactions between chemical groups: W represents the interactions existing between−CH groups (HB3 and HV3), X and Y between−CH2 groups (HB2, HB4, HV2, and HV4), and Z between−CH2and−CH3groups (HB4 and HV5). It was then likely that Y, X, and Z peaks could be representative of higher interactions between 3HB and 3HV moieties. Because these peaks were only visible for PHBV18%-P2, higher interactions between −CH2and −CH3 would be expected after the second cycle of purification, an assumption to be confirmed.
The sequence distribution of 3HV and 3HB comonomers in P(3HB-3HV) and their respective molar fractions were determined from 13C NMR spectra from the relative peak
Figure 6.13C spectra of P(3HB) and P(3HB-3HV) copolymers and identification of chemical groups.
Figure 7.Identification of molar fractions of the different diad and triad sequences included in the copolymer structures, determined from the HB1 and HV1 relative peak intensities of carbon resonances (13C NMR).
intensities of the 3HB and 3HV carbonyl (HB1 and HV1 in
Figure 6). These signals were split into several peaks due to the
sensitivity of carbon nuclei to different sequences of 3HB and 3HV units (Figure 7). The carbonyl region showed four peaks, associated with the different dyad sequences (VV, VB, BV, BB) of connecting 3HB and 3HV units, according to the literature:9,15,28
• Carbon resonance peaks at 169.15 and 169.55 ppm were found to give long-range coupling only to HB3 and HV3 protons, respectively, and were attributed to carbonyl carbons of homopolymer chain moieties, denoted here as B*B and V*V diad arrangements.
• Carbon resonance peaks at 169.33 and 169.39 ppm showed long-range couplings to both HB3 and HV3 protons and were assigned to carbonyl carbons surrounded by two different monomer units, B*V and V*B diads.
For PHBV3%, peaks were too small for allowing integration. For both PHBV18% samples, it was possible to calculate the molar fractions of the different diad and triad sequences (FVV,
FBV, FVB, and FBB) from the relative peak intensities of HV1 and HB1 carbon resonances.
These experimental results, combined with FB and FV
calculated from1H NMR spectra, were used to calculate (eq 1) the experimental D parameter to get information on the chemical compositional distribution (Table 5).
Different results were obtained for FBV and FVB from the experimental integrated signals and the calculated Bernouillian model. It is worth noting that the theoretical Bernouillian model corresponds to the simple case of a random copolymer model. Here, such a model could not describe the sequence distribution in the copolymers studied, proving that both products were not randomly organized. This result has already been reported by Ivanova et al.9Experimental data indicated a D parameter of 2.3 for PHBV18%-P1 and 5.9 for PHBV18%-P2. Both copolymers corresponded to the case D > 1 and could therefore be identified as block copolymers or a mixture of several copolymers, according to the literature.9,15,26−28 At this step, it was not possible to confirm one hypothesis or the other.
It could also be observed that the number of purification steps resulted in an increase in the D parameter. Here, the following assumptions could be drawn: in the case of a block copolymer, further purification would enhance the interactions between (3HB) and (3HV) blocks within the structure of the polymer such results have already been reported by Žagar et al.;28in the Table 5. 13C NMR Integrated Signalsa
determined from1H NMR determined from13C NMR
calculated from experimental datab from−CH3 resonance peaks from−CO resonance peaks
sample FB FV FVV FBV= FVB FBB D parameter
PHBV18%-P1 0.834 0.166 0.035 0.103 0.723 2.3 PHBV18%-P2 0.843 0.157 0.065 0.088 0.709 5.9
aTable available for downloading at https://doi.org/10.15454/STWMJ9.bD = (F
VV*FBB)/(FBV*FVB).
case of polymer blends, further purification would only generate a stronger differentiation between the homopolymers. However, from 1H NMR spectra, it was shown that overall 3HV units decreased with further purification. Then, if the product was a blend, purification would logically have led to a higher proportion of P(3HB) homopolymers in the blend, which should not result in a higher D parameter. At this point, the hypothesis of a block copolymer is the most probable. It is also coherent with the decrease of crystallinity from PHBV18%-P1 to PHBV18%-P2 previously observed in DSC thermograms. Additionally, it was shown that increased melting points and melt crystallization temperatures correlated with the increased blockiness.47 Here, we obtained consistent results from DSC experiments: increasing purity led to a slight increase in thefirst melting peak and crystallization temperature (Figure 1,Table 2). All of these observations tend to confirm that PHBV18%-P2 was characterized by a more“blocky” structure than PHBV18%-P1. In addition, this point is also supported by the WAXS results, where a better co-crystallization has been reported after the second step of purification.
It is also important to remind that GPC analysis showed that PHBV18%-P1 and PHBV18%-P2 had similar Mw. The
sensitivity of the D parameter to Mwhas been pointed out by
Žagar et al.28 as the evidence of a blend material. Here, the difference in Mwwas not correlated with any difference of the D parameter between PHBV18%-P1 and PHBV18%-P2, discard-ing the hypothesis of a blend material. The combination of NMR and GPC results thus enabled clarifying the type of structure eliminated with purification: short-length chains have been removed through intense purification. From the decrease of the overall 3HV content with further purification revealed by 1H NMR, it was most likely that 3HV-rich short-length chains were filtrated with purification. Therefore, it appeared that eliminat-ing such chains could help in homogenizeliminat-ing the structure of the copolymer, encouraging 3HB/3HV interactions and leading finally to improved co-crystallization of the copolymer. In that case, better mechanical properties of the material should be observed.
Still, more elements are needed to confirm this assumption. That is why 2D NMR methods were used to study in more detail the structure of the P(3HB-3HV) copolymers produced by mixed cultures in this study and to compare to those of
commercial PHAs. These analyses were expected to provide more details regarding the interactions between the previously identified groups to validate or not the assumptions of a block-copolymer structure based on DSC and 1D NMR.
2D NMR Maps. DOSY NMR. 1H/diffusion-ordered
spec-troscopy (DOSY) NMR enables both the1H NMR spectrum
and apparent diffusion rate of the identified protons in a bidimensional array to be visualized. The 2D DOSY maps obtained for the different PHAs studied in this work are presented inFigure 8.
For the P(3HB) homopolymer, the set of spots corresponding to HB3, HB2, and HB4 (from left to right on the spectrum) lies on the same straight line, corresponding to a unique, diffusion rate of 1.55× 10⁻¹⁰m2·s−1, which indicates a unique cohesive
structure.48This result was expected for P(3HB), which has a homopolymeric structure. The P(3HB) characteristic diffusion rate could thus be used as the reference for 3HB moieties’ diffusion rate for comparison with the other copolymers (indicated by a black dashed line inFigure 8).
For P(3HB-3HV) copolymer products, different diffusion rates could be observed. PHBV3% displayed the most contrasting 3HV moieties’ diffusion rate of 1 × 10⁻⁹ m2·s−1,
revealed by the HV5 group diffusion rate (indicated by an orange dashed line in Figure 8). This value was significantly larger than the characteristic diffusion rate of 3HB moieties, revealing a faster mobility of 3HV units compared to the rest of the copolymer. From the low 3HV content present in this copolymer, 3HV moieties should not have such a lower different diffusion rate compared to 3HB moieties. Here, it was assumed that PHBV3% could be a blend of copolymers, as it has already been observed in other commercial-grade P(3HB-3HV).28
For PHBV18%, the diffusion rate of the HV5 group was really close to the 3HB moieties’ characteristic diffusion rate. Here, the whole structure of the copolymer diffused in the same way, evidencing a cohesive copolymer structure. This result confirmed that PHBV18% was not a blend. The previous calculus of the D parameter from13C NMR analysis pointed out two possible chemical compositional distributions for PHBV18%: a blend or a block copolymer. The diffusion analysis thus enabled us to conclude, with no need for fractionation experiments, that PHBV18% was a block copolymer.
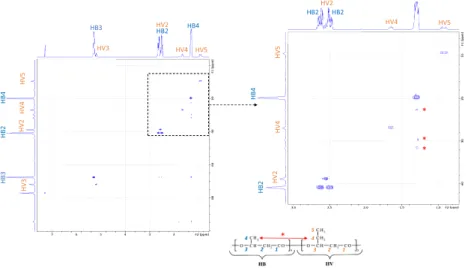
Figure 9.HSQC 2D NMR maps of PHBV18%-P2 (dimension 1:1H NMR; dimension 2:13C NMR). The spots indicated by red* symbols are markers of interactions existing between HV2, HV4, and HB4 units.
In DOSY 2D maps, few differences were noted between PHBV18%-P1 and PHBV18%-P2. By increasing the level of purity, only a very small shift to (i) a higher diffusion rate of HV5 signal and (ii) a lower diffusion rate of the HB4 signal could be observed. In the case of PHBV18%-P2, it could be assumed that this difference originated from longer consecutive chains of 3HV units that would be characterized by a higher diffusion rate.
Finally, for PHBV3% and PHBV18%, unidentified adjacent peaks surrounding the HB4 peak were observed, characterized by a lower diffusion rate and thus a slower mobility compared to 3HB and 3HV groups. HSQC 2D NMR analysis has thus been performed to investigate the nature of the two joint signals of HB4 having a lower diffusion than the rest of the copolymer chain.
HSQC 2D Maps. The assignment of the resonance peaks of the carbons and protons was combined through the HSCQ
1H/13C 2D NMR analysis. Here, the results obtained for
PHBV18%-P2 are displayed inFigure 9. In thisfigure, the spots appearing on the diagonal of the map corresponded to the proton and carbon signals of the same chemical groups. Such spots only confirmed the correct assignment of the identified groups (the same spots were observed for PHBV18%-P1; see
Supporting Information). On the contrary, spots observed
outside of this trend indicated existing correlations between different chemical groups, like it is the case for the two HB4 joint signals (not observed in the case of PHBV18%-P1; see
Supporting Information): a sequence of vertically aligned
spots could be observed below the strain assigned to HB4 (identified by a red * symbol, in the zoomed area inFigure 9). On the13C NMR spectra scale, these spots were aligned with small peaks between HV2, HV4, and HB4 units. It is thus clear that the HB4 joint signals were indeed markers of the interactions existing between 3HV and 3HB moieties in the copolymer. Interestingly, these peaks were not visible for PHBV-P1. It therefore confirmed that the higher degree of purification of PHBV-P2 allowed the interactions between 3HB and 3HV moieties in the copolymer to be enhanced, as previously proposed from13C NMR spectra analysis.
From the DOSY experiments, it was also shown that the diffusion associated with these peaks decreased with higher purification. It is likely that the locations in the copolymer showing high interactions between 3HB and 3HV units increased with purification, forming bigger aggregates that
diffuse slowly. Such structural changes should modify the crystallization behavior of the copolymer. Indeed, block-copolymers are characterized by covalently linked polymer chains.49Such a microstructure prevents large phase separation during crystallization that would normally arise from com-parable polymer blends.50It is thus reasonable to assume that higher 3HB/3HV interactions, like observed in PHBV18% after further purification, are expected to improve co-crystallization (and thus copolymer properties). The assessment of the microstructure and the composition of the crystals is needed to verify this assumption. Polarized optical microscopy has thus been performed on the different grades of PHAs.
Physical and Mechanical Properties of P(3HB) and P(3HB-3HV)-Based Films. Polarized Optical Microscopy (POM). Given the differences observed between samples with respect to the thermal properties and the chemical composi-tional distribution, the morphology of the different PHAs was observed during isothermal crystallization under a polarized optical microscopy equipped with a hot stage for melting and cooling (Figure 10). Powders were melted in the same conditions as for DSC analysis. The microstructure of the samples is quite distinct, depending on the composition and the purification process.
P(3HB) displayed the biggest crystals, with large spherulites growing homogeneously from the melt. This confirmed that crystallization was mainly initiated by a limited number of heterogeneities and rather by sporadic homogeneous nuclea-tion, which resulted in the growth of only a few spherulites, as typical for P(3HB).30 It tended to the formation offibrillary spherulites, a feature that has previously been shown for P(3HB) with low molecular mass,51 i.e., corresponding to the commercial product considered in this work.
PHBV3% also showed big crystals with a slightly smaller radius. The similarity between P(3HB) and PHBV3% crystals could reinforce the hypothesis deduced from DOSY NMR analysis, according to which PHBV3% was a blend of P(3HB) and P(3HB-3HV) random copolymers. Moreover, PHBV3% spherulites exhibited banded-ring patterns and the Maltese-cross corresponding to optical birefringence when viewed through the polarized filter, a typical feature of random copolymers.20This result supported the relevance of investigat-ing the crystal morphology by POM, since it was not possible to conclude on the chemical compositional distribution of
PHBV3% based on NMR results (the13C NMR characteristic
signals used to calculate the D parameter being too small with the instrument used in this study).
For PHBV18%, despite almost similar DSC thermograms and Mwand WAXS results for PHBV18%-P1 and PHBV18%-P2, the morphology of the crystals was highly dependent on the purification process. This observation proved that the purification process played an important part in the copolymer microstructure. POM observations of PHBV18%-P1 evidenced two contrasting populations of crystals: medium-sized crystal-line spherulites (average diameter of 131.8μm) and smaller heterogeneous spherulites (average diameter of 68.9 μm) around the edge of medium spherulites or grouped together. It is worth pointing out that crystallization was non homogeneous and that a large fraction of the polymer remained amorphous even after cooling and stabilization. These observations highlighted that a single purification step resulted in phase segregation, as already observed for P(3HB-3HV) samples in which P(3HB) was in excess.51During crystallization of PHBV18%-P1 from the molten state, it thus appeared that the copolymer split between 3HB-rich and 3HV-rich regions, behaving like P(3HB) and P(3HV) homopolymers. Such a structure might be sensitive to interspherulitic cracking and thus should display poor mechanical performances, as reported by Laycock et al.20
PHBV18%-P2, on the contrary, showed a very homogeneous and cohesive microcrystalline structure with one unique type of small-sized spherulites (mean diameter of 43.3μm). This could be ascribed to a higher density of nucleation and an increase in the number of growing spherulites. This was generally attributed to self-nucleation induced by some remaining partially ordered chain portions in the melt, which speed up the onset of crystallization during the subsequent cooling. The improved nucleation observed for PHBV18%-P2 could result from the positive effect of remaining nonorganic compounds after the second step of purification. As reported in Table 1, a larger amount of inorganic impurities is observed after a second purification step (1.43% for PHBV18%-P2 against 0.59% for PHBV18%-P1), being predominantly calcium residues, known to improve nucleation.52
However, the occurrence of self-nucleation is generally related to smooth and narrow DSC exotherms,30 which was not evidenced here. Perfect co-crystallization should also have resulted in one unique melting peak, which was not observed in DSC thermograms. The double melting peak was thus due to either the presence co-crystallized regions of variable 3HV content40or melting−recrystallization−remelting during heat-ing. Here, a more complete DSC analysis, investigating varying melting temperatures, will be performed in an upcoming work to solve that pending issue. Anyway, the great structural improve-ment obtained after the second cycle of purification was most likely due to better interactions between 3HB and 3HV moieties, as previously revealed by NMR.
Resulting Mechanical Properties. Tensile tests were performed on thin films realized from the different PHAs to compare their mechanical performances. The stress−strain curves obtained for each replicate are reported inFigure 11. The calculated parameters such as Young’s modulus, elongation at break and stress at break, are listed inTable 6.
P(3HB)-basedfilms were the more brittle materials, with an elongation at break of 1.8± 0.2% and a stress at break of 36.0 ± 2.5 MPa. The large spherulites of P(3HB) are here responsible for the poor mechanical properties observed.31 P(3HB) and
PHBV3% samples exhibited similar tensile behavior, typical of highly crystalline structures. They were characterized by a very high rigidity, with Young’s modulus values of 2.82 ± 0.11 GPa for P(3HB) and 2.28 ± 0.07 GPa for PHBV3% and a low elongation at break, i.e., 1.80 ± 0.5%, for both samples. For PHBV3%, no clear improvement of the elongation at break was observed compared to P(3HB), which could have been expected due to the reduction of crystal size and overall crystallinity.35 This was probably due to the fact that overall mechanical properties of PHBV3%, which was identified as a blend of P(3HB) and P(3HB-3HV) random copolymers, were governed by the more rapidly crystallizing component, i.e., P(3HB).10,20 Fractures might occur between the large P(3HB)-rich crystals identified in POM images, in favor of high brittleness. P(3HB) chains are here limiting the mechanical performances of PHBV3%, whichfinally displayed similar mechanical behavior as the homopolymer.
Increasing the rate of 3HV units in the copolymer up to 18 mol % led to a progressive decrease of the polymer rigidity. A significant negative linear correlation between the 3HV content and Young’s modulus could be observed (R2= 0.97) (Figure 12). Independently of their organization within the copolymer microstructure, 3HV chains might have a plasticizing effect in the less crystalline zones of the polymer, regardless of their interactions with 3HB chains.
On the contrary, the ductility of materials, characterized by the elongation at break, was not linearly correlated with the 3HV molar content. The elongation at break was similar for P(3HB), PHBV3%, and PHBV18%-P1, despite contrasting 3HV contents
(Table 6), suggesting that brittleness could originate from the
P(3HB)-rich highly crystalline zones. The observation of split thinfilms under POM revealed the presence of cracks at the frontier between the biggest crystals and confirmed this hypothesis (data not shown). Only PHBV18%-P2 exhibited an improved elongation at break, with a value of 3.6%. The overall 3HV content is then not sufficient to improve the ductility of materials, at least in the range of tested 3HV contents. This is the quality of the interactions between 3HB and 3HV units in the copolymer that seems to be of prime importance to take advantage of 3HV chains. Here, the improved co-crystallization of 3HB and 3HV units originating from better interactions between both moieties, as previously inferred from NMR and POM analysis, was supposed to be at the origin of such improved elongation results.
These conclusions are supported by several studies existing in the literature. Random and blend copolymer materials do not display embedded structures, resulting in a poor control on the
Figure 11.Stress−Strain curves obtained for PHA-based films under tension loading. Raw data are available athttps://doi.org/10.15454/ YQIKJ9.
resulting polymer properties. No microstructure can be achieved during crystallization, leading to quick aging of thefilms and very brittle characteristics.50In block copolymers, it is possible to control the thermodynamic nature of a polymer system, including the degree of crystallization as well as the sizes of the resulting crystalline domains. Even though both segments are still highly crystalline in nature, tethering P(3HB) to P(3HV) in the form of block copolymers thus enables the development of the crystalline structure to be controlled, having a positive effect on the elongation at break.49,53,54 For PHBV18%-P1 and PHBV18%-P2, both characterized as block copolymers from NMR analysis, different mechanical properties were obtained. Such a result completes the above-mentioned mechanistic theories from the literature: besides block copolymerization, strong interactions between 3HB and 3HV units are also needed to provide the best mechanical performances. Purification has been proved in this work to be of interest to reach such structures.
■
CONCLUSIONS AND FUTURE PERSPECTIVES In this work, P(3HB-3HV) with a 3HV content of about 18−20 mol % was produced from mixed microbial cultures and a waste feedstock in a pilot-plant scale productive system. The obtained copolymers, depending on the intensity of purification, were characterized in terms of thermal, structural, and mechanical properties and compared to existing commercial PHAs. By coupling conventional biopolymer testing methods with one-dimensional (1H and 13C) and advanced two-dimensional(DOSY and HSQC) NMR spectroscopy techniques, it was possible to access not only the overall chemical composition of the copolymer but also its precise molecular structure (and more precisely the compositional distribution of 3(HB) and 3(HV) moieties), which has been proved in this work to have a strong influence on the final mechanical performances. NMR analyses first proved that, with a production system using a waste feedstock at pilot-plant scale, a satisfying copolymerization could be reached. The obtained results showed that PHBV18% was a block copolymer. It also appeared that increasing the 3HV overall content within the copolymer reduced the copolymer rigidity but had only a positive impact on P(3HB-3HV) properties if good interactions between 3HB and 3HV moieties
were reached. Increasing the number of purification steps did not change the overall copolymer purity but (1) increased the amount of inorganic compounds, which favored crystallization, and (2) had an interesting effect on P(3HB-3HV), eliminating short-length 3HV-rich chains and improving the interactions between 3HB and 3HV chains. Homogeneous co-crystallization thus became possible. Such a modification of the copolymer structure allowed brittleness to be reduced since the polymer properties were no longer limited by P(3HB)-rich highly crystalline zones. It thus improved the copolymer mechanical properties in terms of elongation at break. The results of this work also highlighted the need for completing classical testing analyses with other techniques like 2D NMR and final mechanical testing to be able to compare the quality of P(3HB-3V) products according to theirfinal use.
The final performances obtained for high 3HV purified P(3HB-3HV) produced in this study evidenced the possibility of achieving high-quality copolymer, even from complex waste feedstocks.
This result opens a wide range of opportunities for P(3HB-3HV) large-scale production. Now, since this new generation of biobased plastics is destined for packaging production, the effect of processing temperature on crystallization behavior andfinal properties needs to be further investigated to anticipate the polymer behavior when used with conventional thermomechan-ical shaping processes.
■
ASSOCIATED CONTENT*
sı Supporting InformationThe Supporting Information is available free of charge at
https://pubs.acs.org/doi/10.1021/acs.biomac.0c00826.
Single additional figure is provided as the supporting information to complete Figure 9: the HSQC results obtained for PHBV18%-P1 are displayed for comparison to PHBV18%-P2 (PDF)
■
AUTHOR INFORMATIONCorresponding Authors
Julie Bossu− JRU IATE 1208CIRAD/INRA/Montpellier Supagro, University of Montpellier, Montpellier F-34060, Table 6. Average Mechanical Properties of PHAs-Based Films Calculated from Stress−Strain Curves
Young’s modulus stress at break strain at break energy at break GPa STDV MPa STDV % STDV mJ·cm3 STDV
P(3HB) 2.82 0.11 36.0 2.5 1.8 0.2 409.0 75.3 PHBV3% 2.28 0.07 28.4 2.4 1.8 0.4 334.7 118.0 PHBV18%-P1 1.24 0.02 17.2 1.7 1.8 0.3 184.7 48.7 PHBV18%-P2 1.31 0.01 24.4 0.3 3.6 0.1 582.2 29.1
France; orcid.org/0000-0001-6603-739X; Email:juliebossu@hotmail.fr
Hélène Angellier-Coussy − JRU IATE 1208CIRAD/INRA/ Montpellier Supagro, University of Montpellier, Montpellier F-34060, France; Email:helene.coussy@umontpellier.fr Authors
Cedric Totee− ICGM, CNRS, ENSCM, University of Montpellier, Montpellier F-34095, France
Mariana Matos− UCIBIO-REQUIMTE, Chemistry
Department, Faculdade de Ciências e Tecnologia, Universidade Nova de Lisboa (FCT-UNL), Caparica 2829-516, Portugal Maria Reis− UCIBIO-REQUIMTE, Chemistry Department, Faculdade de Ciências e Tecnologia, Universidade Nova de Lisboa (FCT-UNL), Caparica 2829-516, Portugal Valérie Guillard − JRU IATE 1208CIRAD/INRA/
Montpellier Supagro, University of Montpellier, Montpellier F-34060, France; orcid.org/0000-0002-7117-1988
Complete contact information is available at:
https://pubs.acs.org/10.1021/acs.biomac.0c00826 Author Contributions
V.G. and H.A.-C. supervised the project; J.B. conceived the original idea and planned the experiments; M.M. produced the PHBV18% polymer; M.R. supervised the production of the PHBV18% polymer; J.B. and C.T. carried out the NMR experiments; J.B. carried out the crystallization and mechanical experiments; J.B., H.A.-C., and V.G. discussed and analyzed the results; and J.B. took the lead in the writing of the manuscript with the input of all authors. All authors have given approval to thefinal version of the manuscript.
Funding
This project has received funding from the European Union’s Horizon 2020 Research and Innovation Program under grant agreement no. 773375.
Notes
The authors declare no competingfinancial interest.
■
ACKNOWLEDGMENTSThe authors address a specially thank all project partners for their contribution to this work and Francesco di Renzo who helped our research group to connect to the IAM laboratory to get access to key NMR methods. The authors also thank Philippe Dieudonné for WAXS analysis.
■
REFERENCES(1) Mohanty, A. K.; Misra, M.; Drzal, L. T. Sustainable Bio-Composites from Renewable Resources: Opportunities and Challenges in the Green Materials World. J. Polym. Environ. 2002, 10, 19−26.
(2) Pérez-Rivero, C.; Hernandez-Raquet, G. Polyhydroxyalcanoates: Une Alternative “bio” Aux Plastiques Traditionnels; Université de Toulouse, 2017.
(3) Malik, J.; Bhadauria, M. Polyhydroxyalkanoates: An Indispensable Alternative. In Handbook of Research on Environmental and Human Health Impacts of Plastic Pollution.; Global, I., Eds.; 2020; pp 370−387. (4) Zhao, K.; Yang, X.; Chen, G.-Q.; Chen, J.-C. Effect of Lipase Treatment on the Biocompatibility of Microbial Polyhydroxyalka-noates. J. Mater. Sci.: Mater. Med. 2002, 13, 849−854.
(5) Cheng, S.; Chen, G.-Q.; Leski, M.; Zou, B.; Wang, Y.; Wu, Q. The Effect of d,l-β-Hydroxybutyric Acid on Cell Death and Proliferation in L929 Cells. Biomaterials 2006, 27, 3758−3765.
(6) Gao, X.; Chen, J.-C.; Wu, Q.; Chen, G.-Q. Polyhydroxyalkanoates as a Source of Chemicals, Polymers, and Biofuels. Curr. Opin. Biotechnol. 2011, 22, 768−774.
(7) Chanprateep, S. Current Trends in Biodegradable Polyhydrox-yalkanoates. J. Biosci. Bioeng. 2010, 110, 621−632.
(8) Avella, M.; Martuscelli, E.; Raimo, M. Review Properties of Blends and Composites Based on Poly(3-Hydroxy)Butyrate (PHB) and Poly(3-Hydroxybutyrate-Hydroxyvalerate) (PHBV) Copolymers. J. Mater. Sci. 2000, 35, 523−545.
(9) Ivanova, G.; Serafim, L. S.; Lemos, P. C.; Ramos, A. M.; Reis, M. A. M.; Cabrita, E. J. Influence of Feeding Strategies of Mixed Microbial Cultures on the Chemical Composition and Microstructure of Copolyesters P(3HB-Co-3HV) Analyzed by NMR and Statistical Analysis. Magn. Reson. Chem. 2009, 47, 497−504.
(10) Arcos-Hernández, M. V.; Laycock, B.; Donose, B. C.; Pratt, S.; Halley, P.; Al-Luaibi, S.; Werker, A.; Lant, P. A. Physicochemical and Mechanical Properties of Mixed Culture Polyhydroxyalkanoate (PHBV). Eur. Polym. J. 2013, 49, 904−913.
(11) Yoshie, N.; Menju, H.; Sato, H.; Inoue, Y. Complex Composition Distribution of Poly(3-Hydroxybutyrate-Co-3-Hydroxyvalerate). Mac-romolecules 1995, 28, 6516−6521.
(12) Pederson, E. N.; McChalicher, C. W. J.; Srienc, F. Bacterial Synthesis of PHA Block Copolymers. Biomacromolecules 2006, 7, 1904−1911.
(13) Müller, A. J.; Arnal, M. L.; Balsamo, V. Crystallization in Block Copolymers with More than One Crystallizable Block. Lect. Notes Phys. 2007, 714, 229−259.
(14) Hu, D.; Chung, A. L.; Wu, L. P.; Zhang, X.; Wu, Q.; Chen, J. C.; Chen, G. Q. Biosynthesis and Characterization of Polyhydroxyalka-noate Block Copolymer P3HB-b-P4HB. Biomacromolecules 2011, 12, 3166−3173.
(15) Tripathi, L.; Wu, L.-P.; Chen, J.; Chen, G.-Q. Synthesis of Diblock Copolymer Poly-3-Hydroxybutyrate-Block-Poly-3-Hydroxy-hexanoate [PHB-b-PHHx] by aβ-Oxidation Weakened Pseudomonas Putida KT2442. Microb. Cell Fact. 2012, 11, No. 44.
(16) Villano, M.; Valentino, F.; Barbetta, A.; Martino, L.; Scandola, M.; Majone, M. Polyhydroxyalkanoates Production with Mixed Microbial Cultures: From Culture Selection to Polymer Recovery in a High-Rate Continuous Process. New Biotechnol. 2014, 31, 289−296. (17) Duque, A. F.; Oliveira, C. S. S.; Carmo, I. T. D.; Gouveia, A. R.; Pardelha, F.; Ramos, A. M.; Reis, M. A. M. Response of a Three-Stage Process for PHA Production by Mixed Microbial Cultures to Feedstock Shift: Impact on Polymer Composition. New Biotechnol. 2014, 31, 276−288.
(18) Lemos, P. C.; Serafim, L. S.; Reis, M. A. M. Synthesis of Polyhydroxyalkanoates from Different Short-Chain Fatty Acids by Mixed Cultures Submitted to Aerobic Dynamic Feeding. J. Biotechnol. 2006, 122, 226−238.
(19) Albuquerque, M. G. E.; Martino, V.; Pollet, E.; Avérous, L.; Reis, M. A. M. Mixed Culture Polyhydroxyalkanoate (PHA) Production from Volatile Fatty Acid (VFA)-Rich Streams: Effect of Substrate Composition and Feeding Regime on PHA Productivity, Composition and Properties. J. Biotechnol. 2011, 151, 66−76.
(20) Laycock, B.; Arcos-Hernandez, M. V.; Langford, A.; Pratt, S.; Werker, A.; Halley, P. J.; Lant, P. A. Crystallisation and Fractionation of Selected Polyhydroxyalkanoates Produced from Mixed Cultures. New Biotechnol. 2014, 31, 345−356.
(21) Kim, K. J.; Doi, Y.; Abe, H. Effects of Residual Metal Compounds and Chain-End Structure on Thermal Degradation of Poly(3-Hydroxybutyric Acid). Polym. Degrad. Stab. 2006, 91, 769−777.
(22) Kopinke, F. D.; Remmler, M.; Mackenzie, K.; Möder, M.; Wachsen, O. Thermal Decomposition of Biodegradable Polyesters - II. Poly(Lactic Acid). Polym. Degrad. Stab. 1996, 53, 329−342.
(23) Tonelli, A. E. NMR Spectroscopy and Polymer Microstructure: The Conformational Connection; VCH: New York, 1989.
(24) Viel, S.; Ziarelli, F.; Caldarelli, S. Enhanced Diffusion-Edited NMR Spectroscopy of Mixtures Using Chromatographic Stationary Phases. Proc. Natl. Acad. Sci. U.S.A. 2003, 100, 9696−9698.
(25) Serafim, L. S.; Lemos, P. C.; Oliveira, R.; Reis, M. A. M. Optimization of Polyhydroxybutyrate Production by Mixed Cultures Submitted to Aerobic Dynamic Feeding Conditions. Biotechnol. Bioeng. 2004, 87, 145−160.