HAL Id: hal-02989154
https://hal.archives-ouvertes.fr/hal-02989154
Submitted on 5 Nov 2020HAL is a multi-disciplinary open access archive for the deposit and dissemination of sci-entific research documents, whether they are pub-lished or not. The documents may come from teaching and research institutions in France or abroad, or from public or private research centers.
L’archive ouverte pluridisciplinaire HAL, est destinée au dépôt et à la diffusion de documents scientifiques de niveau recherche, publiés ou non, émanant des établissements d’enseignement et de recherche français ou étrangers, des laboratoires publics ou privés.
Distributed under a Creative Commons Attribution| 4.0 International License
How does bark contribution to postural control change
during tree ontogeny? A study of six Amazonian tree
species
Romain Lehnebach, Tancrede Almeras, Bruno Clair
To cite this version:
Romain Lehnebach, Tancrede Almeras, Bruno Clair. How does bark contribution to postural control change during tree ontogeny? A study of six Amazonian tree species. Journal of Experimental Botany, Oxford University Press (OUP), 2020, 71 (9), pp.2641-2649. �10.1093/jxb/eraa070�. �hal-02989154�
Journal of Experimental Botany, Vol. 71, No. 9 pp. 2641–2649, 2020 doi:10.1093/jxb/eraa070 Advance Access Publication 13 February 2020
This paper is available online free of all access charges (see https://academic.oup.com/jxb/pages/openaccess for further details)
© The Author(s) 2020. Published by Oxford University Press on behalf of the Society for Experimental Biology.
This is an Open Access article distributed under the terms of the Creative Commons Attribution License (http://creativecommons.org/licenses/by/4.0/), which permits unrestricted reuse, distribution, and reproduction in any medium, provided the original work is properly cited.
RESEARCH PAPER
How does bark contribution to postural control change
during tree ontogeny? A study of six Amazonian tree species
Romain Lehnebach1,2,*, , Tancrède Alméras1 and Bruno Clair1,3,
1 LMGC, Université de Montpellier, CNRS, 860 Rue de St-Priest, 34090 Montpellier, France
2 UGent-Woodlab, Laboratory of Wood Technology, Department of Environment, Gent University, Coupure Links 653, B-9000 Gent, Belgium 3 CNRS, UMR Ecologie des Forêts de Guyane (EcoFoG), AgroParisTech, CIRAD, INRA, Université des Antilles, Université de Guyane, Campus agronomique, BP 316, F-97379 Kourou cedex, France
* Correspondence: [email protected]
Received 10 August 2019; Editorial decision 30 January 2020; Accepted 11 February 2020 Editor: Bruno Moulia, INRAE-University Clermont Auvergne, France
Abstract
Recent works revealed that bark is able to produce mechanical stress to control the orientation of young tilted stems. Here we report how the potential performance of this function changes with stem size in six Amazonian species with contrasted bark anatomy. The potential performance of the mechanism depends both on the magnitude of bark stress and the relative thickness of the bark. We measured bark longitudinal residual strain and density, and the allometric relationship between bark thickness and stem radius over a gradient of tree sizes. Constant tensile stress was found in species that rely on bark for the control of stem orientation in young stages. Other species had increasing compres-sive stress, associated with increasing density attributed to the development of sclereids. Comprescompres-sive stress was also associated with low relative bark thickness. The relative thickness of bark decreased with size in all species, sug-gesting that a reorientation mechanism based on bark progressively performs less well as the tree grows. However, greater relative thickness was observed in species with more tensile stress, thereby evidencing that this reduction in performance is mitigated in species that rely on bark for reorientation.
Keywords: Allometry, bark density, bark residual strain, bark thickness, inner bark, mechanical stress, ontogeny, sclereids, tropical trees.
Introduction
Bark is a multifunctional tissue (Angyalossy et al., 2016; Rosell, 2019). Its functions include transport of photosynthates (Evert, 2006), storage of carbohydrates and water (Rosell and Olson, 2014), defense against physical and biological aggression (Pausas, 2015), and mechanical support (Niklas, 1999; Rosell and Olson, 2014). The mechanical function was long thought to be limited to contributing to stem stiffness. Stiffness is a purely ‘passive’ mechanical property; it quantifies the ability of the stem to resist movement caused by external forces, as op-posed to ‘active’ mechanical functions, namely the ability to generate internal forces that cause stem movement. Recent
works reported the involvement of inner bark (i.e. sec-ondary phloem), hereafter simply bark, in the active control of stem orientation (Clair et al., 2019). Bark fulfills this func-tion by generating mechanical stress during stem secondary growth. Combined with a source of asymmetry (here eccen-tric growth), this active generation of mechanical stress results in a bending moment capable of altering stem curvature and orientation (Clair et al., 2019).
Measuring and interpreting the state of stress of bark are, however, not easy. In the above-mentioned work (Clair et al., 2019), the mechanical function of bark was demonstrated by
2642 | Lehnebach et al.
growing young stems in a tilted position. At the end of the experiment, the change in stem curvature that occurred when the stem is released from the stake was measured and com-pared with the change in stem curvature that occurred when the bark was removed from the stem. These measurements of curvature informed us about the imbalance in stress in the bark ring, namely the difference in stress between the upper and lower sides of the tilted stem.
This method cannot easily be applied to adult trees, but ‘direct’ measurement of stress is possible by measuring released strains (Clair et al., 2019; Lehnebach et al., 2019). The measure-ment consists of recording the strain that occurs in bark when it is mechanically isolated from surrounding tissues, a method routinely used to assess the mechanical state of the most recent wood layers (Fournier et al., 1994; Ruelle et al., 2006; Clair
et al., 2013). Interpreting this measurement is more complex than for wood. Indeed, wood located at the tree periphery was formed recently and thus has a short mechanical history. Therefore, its state of stress mainly results from its own mat-uration process. The state of stress of bark is more complex to interpret because bark is made of successive layers that have been produced throughout the life of the tree, involving a long and possibly complicated mechanical history. This is particu-larly the case for tilted stems, in which the mechanical state of the bark is modified not only by stem secondary growth, but also by the changes in curvature that occurred in response to the effect of self-weight and the action of wood (see note S1 in Clair et al., 2019).
Measuring the residual strain in vertical trees avoids these complications and enables evaluation of the average stress of bark. We previously performed measurements on vertical trees belonging to 15 tree species (Lehnebach et al., 2019) and our results revealed contrasted states of stress among species, ran-ging from strong tension to strong compression. These states of stress were interpreted in the light of bark anatomical prop-erties (i.e. cell types and the organization of the tissues) and processes of stem secondary growth. The state of tension is typ-ically associated with the presence of phloem fibers organized like a trellis (Lehnebach et al., 2019). When wood grows, the perimeter of bark is forced to increase (Whitmore, 1962; Evert, 2006), resulting in a state of tension in the tangential direction (Clair et al., 2019). Because of the particular trellis structure, the tangential tension is redirected in the longitudinal direction,
resulting in longitudinal tension (a more detailed explanation is given in Clair et al., 2019). The state of compression does not depend on wood radial growth but is typically associated with a large quantity of sclereids in the bark. Sclereids have thick cell walls, and are typically associated with denser bark (Carmo
et al., 2016; Lehnebach et al., 2019). The quantity of sclereids in bark is negatively correlated with susceptibility to beetles, and is generally acknowledged to be a deterrent against herbivores (Wainhouse et al., 1990; Thorpe and Day, 2002). Sclereids derive from the differentiation of parenchyma cells (Prislan et al., 2012). During their development, these cells swell in all directions, re-sulting in compressive stress in the longitudinal direction.
An important issue is the capacity of bark to maintain its bio-mechanical function as the tree grows. Indeed, direct evidence that bark is capable of bending a tree stem has only been pro-vided in greenhouse experiments, using small trees (Clair et al., 2019). Here we address the question of how the state of stress of bark changes during stem ontogeny. The performance (which can be measured as the change in curvature occurring in a tilted plant) directly depends on two factors: the magnitude of stress in the bark and its geometrical contribution. In this way, we as-sessed how the state of stress of bark changes with ontogeny. As the geometrical contribution of bark generally decreases during ontogeny (Niklas, 1999; Rosell and Olson, 2014), the biomech-anical performance of this mechanism is challenged when the tree grows. We therefore also aimed to assess the allometry be-tween bark thickness and stem radius, and to investigate the link between this allometry and the state of stress. As bark is an indicator of bark stress (Lehnebach et al., 2019), we also as-sessed variations in bark density as a function of stem size, and link the changes in both density and residual strain changes that occur during growth. The rationale of each experiment and the underlying questions are described in Table 1.
Materials and methods
Plant material and samplingBased on previous knowledge (Clair et al., 2019; Lehnebach et al., 2019), we selected six widespread Amazonian tree species that have contrasted mechan-ical states of bark at the adult stage as well as contrasted anatommechan-ical structure (Fig. 1). Among the six species, three species (Pachira aquatica, Cecropia obtusa, and Virola surinamensis) have bark with a peculiar trellis fiber network and associated tensile stress (Fig. 1A–C). One species (Simarouba amara) presents a less marked trellis and light tensile stress (Fig. 1D). The other two species
Table 1. The rationale of the study
Question Methodology and analysis Expected results Figures
How does the state of stress of bark change with ontogeny?
Regression between bark residual strain and stem diameter.
Tensile stress increases in species relying on bark for postural control.
Fig. 5; Supplementary Table S2
Do species that differ in their bark mechanical behavior present different bark allometries?
Allometric analysis (standard major axis regression) between bark thickness and stem radius and wood thickness.
Species with tensile stress produce more bark (i.e. higher allometric exponent) than species with compressive stress.
Figs 2, 3; Supplemen-tary Fig. S1; Table 4 Does bark density vary with ontogeny?
Are bark density changes related to changes in the state of stress of bark?
Regression between bark density and stem size.
As both high bark density and compressive stress are associated with high level of bark sclerification (Lehnebach, 2019), tensile stress is associated with low bark density.
Fig. 4
Each question is described with the associated methodology, analysis, and expected results. The table also refers the reader to the figures and tables that give the the actual results associated with each question.
have bark with compressive stress and either fibers that are not organized like a trellis (Jacaranda copaia, Fig. 1E) or no fibers (Goupia glabra, Fig. 1F)
As studying allometry requires log-transformed variables, our range of sampling sizes was divided into five classes corresponding to an increasing range of stem diameters (0–2.5, 2.5–5, 5–10, 10–20, and 20–40 cm). We sampled four trees per class and per species—a total of 20 trees per species. Five species out of six were sampled along the edge of the secondary forest between the cities of Kourou and Sinnamary in French Guiana, and the ri-parian species P. aquatica was sampled along the banks of the Kourou River.
Measurement of inner bark residual longitudinal strain
Bark residual longitudinal strain (BRLS) was measured using the same methodology as in Lehnebach et al. (2019). After removing the outer bark from an area measuring 3×3 cm, an HBM DDL-1 extensometer sensor, consisting of two pins, was inserted in the secondary phloem along the longitudinal direction of the stem. The sensor was connected to a strain indicator (Vishay P3) to record the strain. The longitudinal strain of the bark was released by sawing two tangential grooves (one above and one below the sensor) at a distance of 4–7 mm from the corresponding pin. The Fig. 1. Macro- and microanatomical characteristics of the bark in six tropical tree species in the tropical rainforest of French Guiana. For each species, the macrostructural features of the bark in cross-section are presented (panel top), with the cambium at the bottom and the outer bark at the top (scale bar=1 cm) as well as three longitudinal microsections (panel bottom) of the inner bark at increasing distance from the cambium (from left to right) (scale bar=1 mm). In Pachira, Cecropia, Virola, and Simarouba (A–D), the bark presents fibers (f) organized like a trellis and enlarging rays (white arrowhead) from the cambium outward. The bark of Jacaranda (E) presents fibers (f) that are not organized like a trellis and sclereids (sc). The bark of Goupia (F) shows no fibers but a substantial amount of sclereids. Sclereids were observable whatever the position in the bark in Simarouba, Jacaranda, and Goupia (E, F) while they were observed in the outer part of the bark in Virola (C) and were absent in Pachira and Cecropia (A and B). Micrographs of Pachira and
Cecropia (A and B) and Virola, Simarouba, Jacaranda, and Goupia (C, D–F) were originally published by Clair et al. (2019) and Lehnebach et al. (2019), respectively. (This figure is available in color at JXB online.)
2644 | Lehnebach et al.
BRLS was defined as the value recorded after making the second groove. The value is negative if the stress is tensile and positive if the stress is com-pressive. As trees are never perfectly vertical, the stress in bark is affected by bending caused by the self-weight of the tree, adding a tensile stress on the upper side and a balanced compressive stress on the lower side of the tilted stem. To account for this effect, four measurements were taken on each tree: one on the upper side and the others at 90° intervals around the trunk. The average BRLS per tree was then computed as the arithmetic mean of the four measurements. Averaging the four measurements eliminates the effect of bending due to the self-weight of the tree. All the measurements performed in this study are listed in Table 2. As a minimum bark thickness (~2 mm) is required to make accurate measurement with the extensometer sensor, the BRLS was only measured on trees with a sufficient bark thick-ness (from 11 to 15 trees per species, Table 3). Therefore, the minimum tree size sampled for BRLS depends on the species, so that the thicker the bark, the lower the minimum tree size sample for BRLS within a species. Collection of samples
Following the BRLS measurements, one bark sample (1×2–5 cm) was col-lected below each measurement location (four samples per tree), labeled, and sealed in plastic bags for further processing. Care was taken to collect samples containing outer bark. In the case of the smallest trees for which BRLS was not recorded, the side opposite to the direction of leaning was selected (position 1) and labeled with a vertical line drawn with a marker pen. Then, two transversal stem discs ~1 cm thick were cut. The upper side of both discs was labeled and the discs were sealed in plastic bags.
Measurement of inner bark basic density
In the laboratory, each sample taken from the largest trees was longitudin-ally sectioned into two subsamples. One subsample was used to measure thickness and the other to measure inner bark basic density. For the smallest trees, one disc was selected and four samples of inner bark were extracted from the disc to measure basic density. Density was measured within 24 h after sampling in the field. After removing the outer bark, the green volume of the inner bark sample was estimated using the water displacement method with a high precision scale (Sartorius CP224S). After stabilization of the mass at 103 °C for 48 h, the dry weight of the sample was measured
using the same scale. The inner bark basic density (BBD, g cm−3) was com-puted as the ratio of dry mass to green volume. For each tree, the BBD was computed as the arithmetic mean of four density measurements.
Measurement of inner bark thickness and wood and pith radius The transverse section of the bark samples was polished using a stationary polishing machine. The whole transverse section of the discs collected from the small trees was polished. The samples and stem discs were then digitized using a flatbed scanner (Canon LIDE 700F) at 1200 dpi. Both total bark thickness and inner bark thickness were measured directly on the bark samples from the largest trees. We measured pith radius, wood thickness, inner and outer bark thickness, and stem radius at four positions on the stem discs from the smallest trees. The first radius corresponded to position 1, and measurements at position 2, 3, and 4 were made 90° from the previous position moving clockwise. Measurements were carried out with Image J software (Rasband, 2012). An average pith radius (in centimeters) was computed for each species and applied to the largest tree. The wood thickness of the largest trees (in centimeters) was computed as the difference between the stem radius and the sum of pith radius and total bark thickness. For each tree, the individual inner bark and wood thickness was computed as the arithmetic mean of the four measurements. Statistical analysis
In order to assess how the geometric contribution of inner bark changes with tree size, we evaluated the allometric relationship between inner bark thickness and stem radius (i.e. stem diameter/2). Both variables were log-transformed and a standard major axis regression including species effect was fitted. A likelihood ratio test was used to detect different allo-metric exponents (i.e. differences in the slope of log-transformed vari-ables) followed by pairwise comparison of species. The likelihood ratio (LR) was also used to test whether the relationship between bark thick-ness and stem radius was allometric (i.e. the slope differed from 1). We also assessed how cambial functioning (i.e. the rate of cells produced by the cambium on the phloem side versus the xylem side) changed with tree size by evaluating the allometric relationship between inner bark thickness and wood thickness and using the same statistical procedure. The statistical tests related to the allometric analysis were performed with
Table 3. Characteristics of the samples and description of bark traits measured in the study of six tropical tree species in the tropical
rainforest of French Guiana
N NBRLS Stem diameter
range (cm)
Bark basic density
(BBD) range (g cm−3) Bark thickness range (cm) Bark residual longitudinal stress (BRLS) range (µstrain)
Goupia glabra 25 13 0.9–40.5 0.293–0.842 a 0.04–0.78 a 503–4046 a Jacaranda copaia 20 12 1.6–40 0.222–0.644 b 0.12–0.82 a 249–4136 a Simarouba amara 20 11 1–32.3 0.178–0.617 b 0.09–0.68 a –765–1109 b Virola surinamensis 20 12 1–38.9 0.177–0.417 cd 0.08–0.95 a –1148 to –124 bc Cecropia obtusa 20 11 1–26.5 0.168–0.323 d 0.07–0.77 a –2244 to –5 c Pachira aquatica 20 15 0.7–30.6 0.2–0.429 bc 0.08–1.27 a –3702 to –1223 d
For each species, the observed range (minimum–maximum) of each trait is given.
Different letters indicate statistical differences between species. N, number of trees used to measure morphometry and density; NBRLS, number of trees
used to measure residual bark strain.
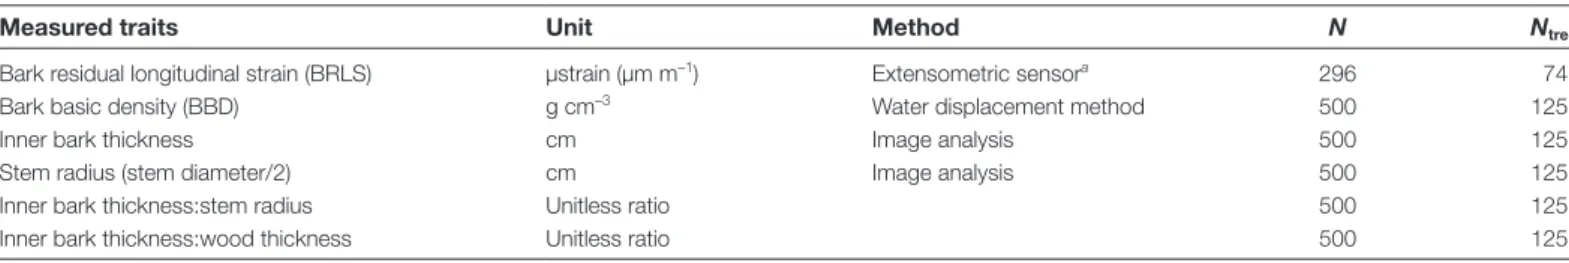
Table 2. List of the variables measured in the study of six tropical tree species in the tropical rainforest of French Guiana
Measured traits Unit Method N Ntree
Bark residual longitudinal strain (BRLS) µstrain (µm m–1) Extensometric sensora 296 74
Bark basic density (BBD) g cm–3 Water displacement method 500 125
Inner bark thickness cm Image analysis 500 125
Stem radius (stem diameter/2) cm Image analysis 500 125
Inner bark thickness:stem radius Unitless ratio 500 125
Inner bark thickness:wood thickness Unitless ratio 500 125
The units, the methodology, the number of measurements (four measurements per tree) (N), and the number of trees sampled (Ntree) are given.
a See Fournier et al. (1994) and Lehnebach et al. (2019).
the ‘smatr’ package (Warton et al., 2012) implemented in R statistical soft-ware (R Development Core Team, 2016).
To assess the relative investment in inner bark across species with dif-ferent relative bark thickness (i.e. inner bark thickness divided by stem radius) and in the inner bark to wood thickness ratio were assessed in the smallest (stem diameter <2.5 cm) and the largest (stem diameter >20 cm) diameter classes. Variations in bark properties with size were assessed by bivariate analysis of BRLS and BBD versus stem radius. Both BRLS and BBD were fitted to log10-transformed stem radius through ordinary least squares linear regressions. The use of P-values in this study follows the statement of the American Statistical Academy (ASA) (Wasserstein and Lazar, 2016), so that the wording relative to statistical significance is avoided. In that sense, the P=0.05 threshold differentiates the detection from the non-detection of statistical differences. Following the ASA state-ment, the estimated coefficients and associated P-values are also supple-mented by confidence intervals.
Results
Bark size allometry
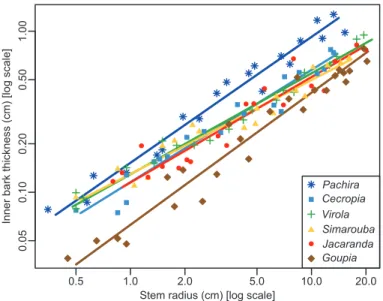
The relationships between inner bark thickness and stem ra-dius were log–log linear in all the species (Fig. 2). The overall
slope (i.e. the allometric exponent) of this relationship was 0.66 and <1 (r= –0.73, df=123, P<0.001; Table 4), meaning that the relationship is allometric. The geometric contribu-tion of bark thus decreased with increasing stem size. However, the allometric exponent differed between species (LR=32.82, df=5, P<0.001), ranging from 0.58 in Simarouba to 0.78 in Pachira (Table 4). We did not detect any differences between the allometric exponents for Pachira (0.78) and Goupia (0.82) (P>0.05), but the exponents did differ (P<0.01) from those es-timated for Virola and Simarouba (0.63 and 0.58, respectively). The allometric exponents for Jacaranda and Cecropia were inter-mediate (0.65 and 0.7, respectively) and did not differ from the others (P>0.05).
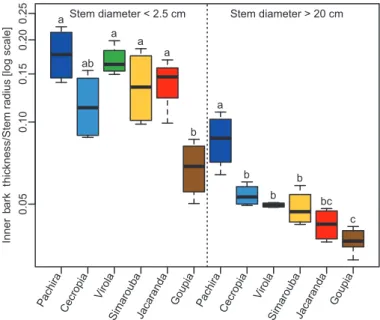
The ranking of species did not change with size: species with the thinnest or thickest bark when their stems were small also had the thinnest or thickest bark when their stems in-creased in size. This was highlighted by the variations in relative bark thickness across species and between small and large stems (Fig. 3). In small stems, the relative bark thickness in Goupia was lower than in the other species (P<0.01). Among these other species, no differences were observed, but the highest relative bark thickness was observed in Pachira. In the large stems, the relative bark thickness of Pachira was higher than in the other species (P<0.001). Among the other species, dif-ferences in relative bark thickness in large stems were more tenuous, although once more Goupia had the lowest relative bark thickness.
As mentioned in the Materials and methods, the relation-ship between bark thickness and stem radius informed us about changes in the geometric contribution of bark with tree size. The relationship between bark thickness and wood thickness can be computed by subtracting the radius of the pith. This relationship informs us about how the cambial func-tioning (namely the rate of cells produced by the cambium on the phloem side versus the xylem side) changes with tree size. The allometric analysis of bark thickness versus wood thick-ness revealed similar patterns to those obtained for the bark thickness/stem radius relationship (Supplementary Fig. S1 at JXB online), except that the allometric exponents were lower (Supplementary Table S1). The only exception was Cecropia, in which the ratio of bark thickness to wood thickness was the highest in small stems (Supplementary Fig. S2) and the allo-metric exponent was the lowest (Supplementary Table S1), due to its thick pith.
Fig. 2. Allometric relationship between inner bark thickness and stem radius in six tropical tree species in the tropical rainforest of French Guiana. Each symbol represents a species. The regression lines result from the
standard major axis regression models described in Table 2. (This figure is
available in color at JXB online.)
Table 4. Overall and species-level parameters of the allometric relationships (standard major axis) between inner bark thickness and
stem radius in six tropical tree species in the tropical rainforest of French Guiana.
Species Intercept (CI) Slope (CI) R2 P
Overall –0.93 (–0.97; –0.9) 0.66 (0.63; 0.72) 0.85 <0.001 Pachira aquatica –0.82 (–0.87; –0.77) 0.78 a (0.72; 0.85) 0.97 <0.001 Cecropia obtusa –0.94 (–0.99; –0.89) 0.70 ab (0.63; 0.77) 0.95 <0.001 Virola surinamensis –0.89 (–0.92; –0.85) 0.63 b (0.58; 0.68) 0.98 <0.001 Simarouba amara –0.89 (–0.94; –0.83) 0.58 b (0.52; 0.65) 0.94 <0.001 Jacaranda copaia –0.94(–1.00; –0.87) 0.65 ab (0.57; 0.74) 0.90 <0.001 Goupia glabra –1.2 (–1.27; –1.13) 0.82 a (0.74; 0.90) 0.95 <0.001 Species effect <0.001
P-values (P) lower than 0.05 are in bold.
Different letters indicate statistical differences in slope among species. CI: confidence interval; R2, goodness of fit.
2646 | Lehnebach et al.
Size-dependent variations in bark basic density
BBD increased with increasing stem radius in all the species (P<0.05) (Fig. 4). The highest rates of increase in BBD with stem radius were observed in Simarouba, Jacaranda, and Goupia
(slope >0.09) and were 3–4 times higher than in Pachira, Cecropia, and Virola (slope <0.05) (Fig. 4). As bark thickness also increased with stem radius, BBD increased with bark thickness (data not shown). The BBDs measured here are a tissue-level average value, but it is important to note that bark density varies from the inner to the outer layers, as revealed by the bark density radial profiles (Fig. 4, right panels). Whereas BBD increased continuously from the cambium outward in Pachira, Cecropia, and Virola, the observed pattern was curvi-linear in Simarouba, Jacaranda, and Goupia, with the highest BBD values recorded in the middle of the bark.
Size-dependent variations in bark residual longitudinal strain
We observed three different patterns of variation in BRLS with increasing stem radius (Fig. 5). In Goupia and Jacaranda, BRLS was positive and increased strongly with increasing stem radius (P<0.05). In Simarouba, although the lower bound of the confidence interval of the slope was slightly negative [i.e. (–99;3839) Supplementary Table S2], BRLS tended to increase with stem radius from negative to positive values. Finally, in Pachira, Cecropia, and Virola, BRLS values were negative and no variations with stem radius were detected (P>0.05).
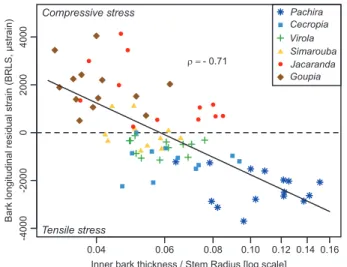
The relationship between BRLS and relative bark thickness was negative (ρ= –0.71, P<0.001) and showed that species with thin bark generally have compressive BRLS, while spe-cies with thicker bark produce tensile stress in bark (Fig. 6). Fig. 3. Across-species variation in relative bark thickness in large and
small trees belonging to six tropical tree species in the tropical rainforest of French Guiana. Different letters indicate statistical differences between species. (This figure is available in color at JXB online.)
Fig. 4. Ontogenetic and radial variation in bark basic density (BBD) in six tropical tree species in the tropical rainforest of French Guiana. For each
species, BBD is plotted against the log-scaled stem radius; the slope value (a) and the goodness of fit (R2) are presented (left panels). For each species,
the regression slope is statistically different from 0 (P<0.05). BBD is also plotted as a function of the relative distance from the cambium in three trees (two series of measurements per tree) (right panels), indicated on the overall regression by the black symbols (left panels). (This figure is available in color at
JXB online.)
Discussion
Scaling of inner bark thickness with stem size
Studying a much broader species diversity, Rosell (2016) re-ported a similar distribution of bark thickness, indicating that our sampling is representative of other tropical rainforests. We observed a 2- to 2.5-fold difference in bark thickness between species with the thinnest and the thickest bark in both small and large stems. Our analysis shows that the ranking of spe-cies according to bark thickness for a given tree size is usually maintained throughout the life of the tree. This was clear in Pachira and Goupia, which had, respectively, the thickest and
thinnest bark, and the highest and lowest relative bark thick-ness in both small and large stems. The ontogenetic variation in bark thickness was higher than variations between species. Overall, a 6-fold increase in bark thickness was observed with increasing stem size, whose magnitude clearly depended on the species considered, from 5-fold in Simarouba to 9-fold in Goupia.
Relationships between inner bark thickness and stem radius were all allometric both between and within species. When all six species were pooled, the mean allometric exponent was <1 (0.66) and very close to the value (0.70) reported by Rosell (2016). Within species, the allometric exponents were also <1 and ranged from 0.63 to 0.82. Interestingly, when studying tree species in dry and wet tropical forests, Poorter et al. (2014) re-ported allometric exponents ranging from 0.38 to 1.20 (70% were <1) based on measurements made on the whole bark (i.e. without accounting for the difference between inner and outer bark). This may mean that the allometry between outer bark thickness and stem radius differs from that between inner bark thickness and stem radius.
In our sample, we also found an allometric relationship be-tween inner bark thickness and wood thickness, with an allo-metric exponent ranging from 0.5 to 0.77 (average 0.57). This indicates that at the cambium level, the ratio of phloem to xylem cambial production decreases with tree development whatever the species considered, with a lower rate of decrease in Pachira and Goupia.
While the two allometric relationships provided relatively similar results, they need to be interpreted in different ways. When we linked the scaling of bark thickness to the size of the whole stem, the allometry between bark and stem radius re-vealed decreasing involvement of bark in stem thickening with increasing stem size. On the other hand, the bark–wood al-lometry described the balance in cambial production between the inner bark and wood. The discrepancy observed between the two allometric relationships in Cecropia highlights the im-portance of the pith thickness in such an analysis. While the allometric exponent was relatively high (i.e. 0.70) when stem size was included, Cecropia had the lowest exponent relative to wood thickness (i.e. 0.5) and therefore its cambial production imbalance was increasingly in favor of wood as the stem in-creased in size.
Size-dependent variation in inner bark density
In a study on branches of 90 species, Rosell et al. (2014) re-ported inner BBDs ranging from 0.17 g cm−3 to 0.86 g cm−3. The samples in our study covered the same range (0.168–0.842) even though only six species were sampled. Such a wide range of BBD values was obtained by taking ontogenetic variations into account. In all six species we sampled, BBDs systematic-ally increased with increasing stem size. As bark thickness also increases with stem size, obviously BDD increases with bark thickness. Therefore, the negative correlation between BBD and bark thickness commonly observed at the interspecific level (Poorter et al., 2014; Rosell et al., 2014) does not hold among conspecific individuals of varying size. The magnitude of variation in BBD with stem size also depends on the species. Fig. 5. Ontogenetic variation in bark residual longitudinal strain (BRLS) in
six tropical tree species in the tropical rainforest of French Guiana. BRLS is plotted against the log-scaled stem radius (SR) (left panel). Between-species differences in BRLS are also given (right panel). Different letters indicate statistical differences between species according to a Kruskal–
Wallis test (χ 2=63.098, df=5, P<0.001). (This figure is available in color at
JXB online.)
Fig. 6. Variations in bark residual longitudinal strain (BRLS) as a function of relative bark thickness in six tropical tree species in the tropical rainforest of French Guiana. The dashed horizontal line separates compressive (y>0) and tensile (y<0) BRLS. Different symbols indicate different species. Spearman’s correlation coefficient (ρ=0.71, P<0.001) is shown. (This figure is available in color at JXB online.)
2648 | Lehnebach et al.
In the present study, the greatest rates of increase were ob-served in Goupia, Simarouba, and Jacaranda, and were two to six times larger than those observed in Pachira, Cecropia, and Virola. The low ontogenetic variations in BBD were also asso-ciated with the lowest BBD in small stems, except in Simarouba, in which the BBD was relatively low in small stems but in-creased sharply with an increase in stem size. Radial profiles of inner bark density (Fig. 4) measured in the largest trees re-vealed substantial variation within the bark. Pachira, Cecropia, and Virola showed a monotonic increase in BBD outward, while Simarouba, Jacaranda, and Goupia showed a bell-shaped pattern, with the highest BBD values in the middle of the bark. Both patterns can be inferred from the spatial pattern of stone cell differentiation and parenchyma sclerification (Fig. 1;
Lehnebach et al., 2019). Sclerification occurs in the outer part of the inner bark and in strongly dilated regions in Pachira, Cecropia, and Virola (Clair et al., 2019), causing the outward increase in BBD. In contrast, species in the second group are known to develop a substantial quantity of dense sclereid cells close to the cambium (Lehnebach et al., 2019). The early dif-ferentiation of sclereids and the dilatation in the outer part of the inner bark explain the curvilinear BBD pattern observed in Simarouba, Jacaranda, and Goupia.
Variations in residual strain and relationship to bark basic density and allometry
As expected, species with fibers organized like a trellis (Pachira, Cecropia, Virola, and Simarouba) presented negative inner BRLS corresponding to tensile stress, whereas species with no trellis (Jacaranda and Goupia) presented positive BRLS (Clair et al., 2019; Lehnebach et al., 2019) corresponding to compressive stress. The highest allometric exponents (inner bark/wood thickness) were observed in Goupia and Pachira, two species with contrasting average BRLS. The value of the allometric exponent is not related to the average BRLS of the species. However, we found a relationship between relative bark thick-ness and average BRLS (Fig. 6). Indeed, the highest ratio be-tween bark thickness and stem radius was observed in Pachira. It is noteworthy that, after accounting for the effect of pith (i.e. by calculating the ratio of bark thickness to wood thickness), the relative bark thickness of Cecropia was the highest and was associated with tensile stress, as in Pachira. This suggests that the two species achieved more negative BRLS while maintaining a relatively high proportion of bark in relation to wood. This is in agreement with the less negative BRLS observed in Virola, whose bark fibers are also organized like a trellis but whose bark is relatively thinner than that observed in Pachira and Cecropia.
While BRLS does not vary with size within species with tensile stress (except in Simarouba whose BRLS showed a slight increasing trend from tensile to compressive stress), we observed a marked increase in BRLS with ontogeny in Goupia and Jacaranda. This strong ontogenetic increase in BRLS was associated with a marked ontogenetic increase in BBD. We previously proposed that compressive stress in bark results from the sclerification of parenchyma cells (Lehnebach, 2019). Although we did not provide any mechanical evidence for such a phenomenon, the association between increasing BRLS and BBD that we found in the present study strongly
reinforces this hypothesis. The shift from tensile to compres-sive stress observed in Simarouba is consistent with the sub-stantial increase in BBD we also observed in this species and points to a possible ontogenetic shift from tensile to compres-sive stress in bark.
The observed increase in BBD also revealed differences be-tween the rate of sclerification on one hand and the rate of dila-tation growth on the other hand. Indeed, to face the increase in the stem perimeter resulting from wood growth, bark has to extend tangentially. Whether achieved by cell enlargement and/or by the division of thin-walled parenchyma cells, the tangential extension of bark should reduce the basic density of the dilating bark. On the other hand, cambial growth adds new fiber-rich layers of inner bark. These two processes should re-sult in a more or less constant BBD with size, which is contrary to our observations. The strong ontogenetic increase in BDD we observed in some species is likely to be due to sclerification occurring at a higher rate than that of dilatation.
While ontogenetic BBD variations are lower in species with constant tensile stress (i.e. Pachira, Cecropia, and Virola), they are still positive. This suggests that sclerification increases during growth and progressively adds compressive stress. Yet, in these species, we observed constant tensile stress rather than an increase in BRLS toward compressive values. This discrepancy suggests that the source of tension (namely the deformation of the trellis) increases during growth, counteracting the effect of sclerification. Implications for mechanisms of stem posture control In previous works we showed that the mechanical stress gener-ated in bark during growth can be the basis of a mechanism for the control of stem posture (Clair et al., 2019). This was directly demonstrated on small tilted stems of Pachira, Cecropia, Virola, and Simarouba (Clair et al., 2019). The mechanism involves a source of longitudinal tensile stress in the bark (interaction be-tween wood radial growth and fibers organized like a trellis) and a source of asymmetry (eccentric growth). In tilted trees, eccen-tricity has been shown to be particularly strong in species that rely on bark for posture control (Ghislain et al., 2019). In vertical trees, the source of asymmetry is no longer active, but the source of tensile stress still is. This was confirmed by our observation that bark stress is tensile in the earliest growth stages in the four above-mentioned species (Fig. 5). However, in Simarouba, this tension is reduced and progressively becomes compression due to sclerification. In Pachira, Cecropia, and Virola, tensile stress is maintained during tree growth, although at different levels.
The performance of the mechanism also depends on the thickness of the bark. Interestingly, species with higher relative bark thickness also displayed more tensile bark stress (Fig. 6). Our study also confirmed that the relative thickness of bark decreases with stem size (Fig. 2), suggesting that the perform-ance of the mechanism is reduced in larger stems. However, the reduction was less marked in Pachira, the species with the highest relative bark thickness and the most tensile stress. Taken together, these observations suggest that the decrease in per-formance is mitigated in the species that relies most on this mechanism.
Species such as Cecropia, Virola, or Simarouba probably rely on bark for posture control in their early development stages,
when the mechanical contribution of bark is dominant (Niklas, 1999; Rosell and Olson, 2014). However, the performance of the bark mechanism decreases steeply with increasing size. In later stages, the usual mechanism based on tension wood takes over, as demonstrated by measurements of residual strains (Clair et al., 2019). The same measurements in Pachira did not show any strong residual strain in tension wood (Clair et al., 2019) (Ghislain et al., 2019), strongly suggesting that in this species, posture control is supported by the bark even in late development stages.
Theoretically, the performance of the mechanism does not depend on the sign of stress (tensile or compressive). For in-stance, mechanisms based on the action of wood are based on either tension wood or compression wood, with similar efficiency (Alméras et al., 2005). Jacaranda and Goupia de-velop strong bark compressive stress, leading one to wonder if this could be the basis of a hypothetical mechanism for the control of stem posture. Our results do not support this hypothesis. First, such a mechanism would require a source of asymmetry, namely more sclereids in the lower part of the bark of a tilted stem. No evidence for such asymmetry has yet been put forward. Moreover, the largest compressive stresses were associated with the thinnest barks, both within and be-tween species. In the early stages, when the relative thickness of bark is still high, compressive stress is low. In late stages, when the bark is sclerified and therefore in compression, its relative thickness is low. Thus, this hypothetical mechanism would not be performant. It is likely that the compressive stress in the bark of Jacaranda and Goupia has no specific bio-mechanical function and is simply the result of the growth of sclereids, whose primary function is defense against bio-logical aggression (Wainhouse et al., 1990; Thorpe and Day, 2002).
Supplementary data
Supplementary data are available at JXB online.
Fig. S1. Allometric relationship between inner bark thick-ness and wood thickthick-ness in six tropical tree species in the trop-ical rainforest of French Guiana.
Fig. S2. Across-species variation in relative bark thickness (inner bark thickness divided by wood thickness) in large and small trees belonging to six tropical tree species in the tropical rainforest of French Guiana.
Table S1. Overall and species-level parameters of the allo-metric relationships (standard major axis) between inner bark thickness and wood thickness.
Table S2. Parameters of the regression between bark residual longitudinal strain (BRLS) and the log of stem radius of six tropical tree species in the tropical rainforest of French Guiana.
Acknowledgements
We thank Fanny Zeline and Léopold Doumerc for their help with field and laboratory work. This work is part of the ‘MechaBark’ research pro-ject funded by the French National Research Agency (CEBA, ref. ANR-10-LABX-25-01; and NUMEV, ref. ANR-10-317 LABX-20)
References
Alméras T, Thibaut A, Gril J. 2005. Effect of circumferential heterogeneity of wood maturation strain, modulus of elasticity and radial growth on the
regulation of stem orientation in trees. Trees 19, 457–467.
Angyalossy V, Pace MR, Evert RF, Marcati CR, Oskolski AA, Terrazas T, Kotina E, et al. 2016. IAWA List of Microscopic Bark Features.
IAWA Journal 37, 517–615.
Carmo JF, Miranda I, Quilhó T, Carvalho AM, Carmo FHDJ, Latorraca JVF, Pereira H. 2016. Bark characterisation of the Brazilian
hardwood Goupia glabra in terms of its valorisation. BioResources 11,
4794–4807.
Clair B, Alteyrac J, Gronvold A, Espejo J, Chanson B, Alméras T. 2013. Patterns of longitudinal and tangential maturation stresses in Eucalyptus
nitens plantation trees. Annals of Forest Science 70, 801–811.
Clair B, Ghislain B, Prunier J, Lehnebach R, Beauchêne J, Alméras T. 2019. Mechanical contribution of secondary phloem to postural control in
trees: the bark side of the force. New Phytologist 221, 209–217.
Evert R. 2006. Esau’s plant anatomy. Meristems, cells, and tissues of the plant body: their structure, function, and development. 3rd edn. Chichester, UK: Wiley & Sons.
Fournier M, Chanson B, Thibaut B, Guitard D. 1994. Mesures des déformations résiduelles de croissance à la surface des arbres, en rela-tion avec leur morphologie. Observarela-tion sur différentes espèces. Annals of
Forest Science 51, 249–266.
Ghislain B, Alméras T, Prunier J, Clair B. 2019. Contributions of bark and tension wood and role of the G-layer lignification in the gravitropic
movements of 21 tropical tree species. Annals of Forest Science 76, 107.
Lehnebach R, Doumerc L, Clair B, Alméras T. 2019. Mechanical stress in inner bark of 15 tropical tree species and relation with anatomical
struc-ture. Botany 98, 1–8.
Niklas KJ. 1999. The mechanical role of bark. American Journal of Botany 86, 465–469.
Pausas JG. 2015. Bark thickness and fire regime. Functional Ecology 29, 315–327.
Poorter L, Mcneil A, Hurtado V-H, Prins HHT, Putz FE, Kitajima K. 2014. Bark traits and life-history strategies of tropical dry- and moist forest
trees. Functional Ecology 28, 232–242.
Prislan P, Koch G, Schmitt U, Gričar J, Čufar K. 2012. Cellular and topochemical characteristics of secondary changes in bark tissues of beech
(Fagus sylvatica). Holzforschung 66, 131.
R Development Core Team. 2016. R: a language and environment for stat-istical computing. Vienna, Austria: R Foundation for Statstat-istical Computing. Rasband WS. 2012. ImageJ. website: http://imagej.nih.gov/ij/.
Rosell JA. 2016. Bark thickness across the angiosperms: more than just
fire. New Phytologist 211, 90–102.
Rosell JA. 2019. Bark in woody plants: understanding the diversity of a
multifunctional structure. Integrative and Comparative Biology 59, 535–547.
Rosell JA, Gleason S, Méndez-Alonzo R, Chang Y, Westoby M. 2014. Bark functional ecology: evidence for tradeoffs, functional coordination, and
environment producing bark diversity. New Phytologist 201, 486–497.
Rosell JA, Olson ME. 2014. The evolution of bark mechanics and storage across
habitats in a clade of tropical trees. American Journal of Botany 101, 764–777.
Ruelle J, Clair B, Beauchêne J, Prévost MF, Fournier M. 2006. Tension wood and opposite wood in 21 tropical rain forest species: 1. Occurrence
and efficiency of the G-layer. IAWA Journal 27, 329–338.
Thorpe KV, Day KR. 2002. The impact of host plant species on the larval development of the large pine weevil Hylobius abietis L. Agricultural and
Forest Entomology 4, 187–194.
Wainhouse D, Cross DJ, Howell RS. 1990. The role of lignin as a defence against the spruce bark beetle Dendroctonus micans: effect on larvae and
adults. Oecologia 85, 257–265.
Warton DI, Duursma RA, Falster DS, Taskinen S. 2012. smatr 3—an
R package for estimation and inference about allometric lines. 3, 257–259.
Wasserstein RL, Lazar NA. 2016. The ASA statement on P-values:
context, process, and purpose. The American Statistician 70,
129–133.
Whitmore TC. 1962. Studies in systematic bark morphology. I. Bark
morphology in dipterocarpaceae. New Phytologist 61, 191–207.