HAL Id: hal-02527259
https://hal-amu.archives-ouvertes.fr/hal-02527259
Submitted on 3 Apr 2020HAL is a multi-disciplinary open access archive for the deposit and dissemination of sci-entific research documents, whether they are pub-lished or not. The documents may come from teaching and research institutions in France or abroad, or from public or private research centers.
L’archive ouverte pluridisciplinaire HAL, est destinée au dépôt et à la diffusion de documents scientifiques de niveau recherche, publiés ou non, émanant des établissements d’enseignement et de recherche français ou étrangers, des laboratoires publics ou privés.
Physico-chemical and agronomic results of soil
remediation by In Situ Chemical Reduction applied to a
chlordecone-contaminated nitisol at plot scale in a
French Caribbean banana plantation
Christophe Mouvet, Bastien Collet, Jean-Marie Gaude, Luc Rangon,
Sébastien Bristeau, Mathlide Senergues, Magalie Lesueur-Jannoyer, Alexandra
Jestin, Jennifer Hellal, Thierry Woignier
To cite this version:
Christophe Mouvet, Bastien Collet, Jean-Marie Gaude, Luc Rangon, Sébastien Bristeau, et al.. Physico-chemical and agronomic results of soil remediation by In Situ Chemical Reduction applied to a chlordecone-contaminated nitisol at plot scale in a French Caribbean banana plantation. Environ-mental Science and Pollution Research, Springer Verlag, 2020, 27, pp.41063-4109. �10.1007/s11356-020-07603-z�. �hal-02527259�
Environmental Science and Pollution Research
Physico-chemical and agronomic results of soil remediation by In Situ Chemical
Reduction applied to a chlordecone contamined nitosol in a French Caribbean banana
plantation
--Manuscript
Draft--Manuscript Number: ESPR-D-19-03671
Full Title: Physico-chemical and agronomic results of soil remediation by In Situ Chemical Reduction applied to a chlordecone contamined nitosol in a French Caribbean banana plantation
Article Type: Research Article
Keywords: Chlordecone; degradates; soil decontamination; chemical reduction; plant; Maximum Residue Level
Corresponding Author: Christophe Mouvet BRGM
FRANCE Corresponding Author Secondary
Information:
Corresponding Author's Institution: BRGM Corresponding Author's Secondary
Institution:
First Author: Christophe Mouvet First Author Secondary Information:
Order of Authors: Christophe Mouvet Bastien Collet Jean-Marie Gaude Luc Rangon Sebastien Bristeau Mathilde Senergues Magalie Lesueur Jannoyer Alexandra Jestin
Jennifer Hellal Thierry Woignier Order of Authors Secondary Information:
Funding Information:
Abstract: The In Situ Chemical Reduction process was tested in a nitisol in a French Caribbean banana plantation using five different soil amendments. The addition of 2.8% or 4.0% of ZVI (dw/dw, 2 different trial plots) in the 0 – 40 cm soil layer lowered the initial chlordecone (CLD) concentration by up to 74% or 69% in 37 days or 94 days, with 75% of the decrease achieved after only 21 or 24 days of treatment depending on each trial plot. The addition of commercially available Daramend® was also tested applying the 6% dose recommended by the manufacturer and using either the regular alfalfa-based product or a bagasse-based product specifically formulated for the study. Both significantly lowered CLD concentrations, but to a lesser extent than with the ZVI-only amendment. A bagasse-ZVI mixture prepared on site produced results slightly better than the two Daramend®. The percentage decreases in CLD concentrations were correlated with the negative redox potentials achieved. In all the trial plots,
concentrations decreased, with H atoms replacing up to 4 and 7 of the 10 Cl atoms, respectively. None of these degradates appeared to accumulate in the soil or soil water during the treatment. Instead, the reverse occurred, with an overall downward trend in their concentrations over time. The effects of ISCR treatment on agronomic and human health-related parameters were measured in three different crops. The radishes produced with some treatments were visually of lower quality or smaller in size than those grown in the control plots. Lower yields were observed for the cucumbers and sweet potatoes grown after applying the bagasse-based amendments. Mortality among cucumber seedlings was observed after treatment with ZVI only. Simple operational solutions should suffice to remedy these negative agronomic effects. As regards human health-related effects, the CLD concentrations in radishes grown with three of the amendments were significantly lower than in the two control plots and well below the MRL, which was substantially exceeded in the radishes grown on untreated soil. For cucumbers, the treatments with regular Daramend® and with a local bagasse-ZVI mixture produced fruits with CLD below the MRL and also below the concentrations in one of the two control plots. As for the sweet potatoes, adding a bagasse-ZVI mixture had a significant positive effect by decreasing contamination to below the levels in the two control plots and below the MRL.
Suggested Reviewers: Pierre Benoit, PhD INRA
pierre.benoit@inra.fr
Well aware of all aspects of the chlordecone issue in the French Caribbeans and (co-)author of 2 papers where the environmental fate of chlordecone and some of its degradates is considered. https://doi.org/10.1080/10643389.2014.955627; http://dx.doi.org/10.1016/j.scitotenv.2016.09.094
TyPol – A new methodology for organic compounds clustering based on their molecular characteristics and environmental behavior. Chemosphere, Volume 111, September 2014, Pages 613-622.
Mike Unger, PhD
Virginia Institute of Marine Sciences munger@vims.edu
Leader of an on-going project on the long-term monitoring of the fate and effects of TBT and Kepone in Chesapeake Bay. https://doi.org/10.21220/V5ZW35
Carmen Dominguez, PhD
Universidad Complutense de Madrid carmdomi@ucm.es
Research work on In situ chemical reduction for chlorinated compounds See for instance https://doi.org/10.1016/j.jwpe.2018.10.011
Opposed Reviewers: Additional Information:
Question Response
§Are you submitting to a Special Issue? Yes (If “yes”) Please select a Special Issue
from the following list:
as follow-up to "§Are you submitting to a Special Issue?
"
Physico-chemical and agronomic results of soil remediation by In Situ Chemical Reduction applied to a chlordecone contamined nitosol in a French Caribbean banana
plantation
Christophe MOUVET1, Bastien COLLET2, Jean-Marie GAUDE3, Luc RANGON,4,5,
Sébastien BRISTEAU1, Mathlide SENERGUES2, Magalie LESUEUR-JANNOYER3,
Alexandra JESTIN3, Jennifer HELLAL1, Thierry WOIGNIER4,5
1Brgm, Avenue C. Guillemin, F-45060 Orléans Cedex 2, France; 2Brgm, Villa Bel Azur, 4 Lot.
Miramar, Route Pointe des Nègres, F-97200 Fort de France, Martinique; 3UR Banana,
Plantain and Pineapple Cropping Systems, CAEC, PERSYST, Cirad, BP 214, F- 97285 Le Lamentin Cedex 2, Martinique; 4IMBE, Aix Marseille University, CNRS, IRD, Avignon
University, F-13397 Marseille, France; 5IRD, UMR IMBE, Campus Agro-Environnemental
Caraïbe, Le Lamentin, Martinique, France
Corresponding author: c.mouvet@brgm.fr
33 (0)2 38 64 39 08
Manuscript Click here to access/download;Manuscript;Mouvet et al ISCR
b.docx
Click here to view linked References
1 2 3 4 5 6 7 8 9 10 11 12 13 14 15 16 17 18 19 20 21 22 23 24 25 26 27 28 29 30 31 32 33 34 35 36 37 38 39 40 41 42 43 44 45 46 47 48 49 50 51 52 53 54 55 56 57 58 59 60 61
Abstract
The In Situ Chemical Reduction process was tested in a nitisol in a French Caribbean banana plantation using five different soil amendments. The addition of 2.8 % or 4.0 % of ZVI (dw/dw, 2 different trial plots) in the 0 – 40 cm soil layer lowered the initial chlordecone (CLD) concentration by up to 74 % or 69 % in 37 days or 94 days, with 75 % of the decrease achieved after only 21 or 24 days of treatment depending on each trial plot. The addition of commercially available Daramend® was also tested applying the 6 % dose recommended by the
manufacturer and using either the regular alfalfa-based product or a bagasse-based product specifically formulated for the study. Both significantly lowered CLD concentrations, but to a lesser extent than with the ZVI-only amendment. A bagasse-ZVI mixture prepared on site produced results slightly better than the two Daramend®. The percentage decreases in CLD
concentrations were correlated with the negative redox potentials achieved. In all the trial plots, dechlorinated transformation products appeared in the soil and soil water as the CLD concentrations decreased, with H atoms replacing up to 4 and 7 of the 10 Cl atoms, respectively. None of these degradates appeared to accumulate in the soil or soil water during the treatment. Instead, the reverse occurred, with an overall downward trend in their concentrations over time. The effects of ISCR treatment on agronomic and human health-related parameters were measured in three different crops. The radishes produced with some treatments were visually of lower quality or smaller in size than those grown in the control plots. Lower yields were observed for the cucumbers and sweet potatoes grown after applying the bagasse-based amendments. Mortality among cucumber seedlings was observed after treatment with ZVI only. Simple operational solutions should suffice to remedy these negative agronomic effects. As regards human health-related effects, the CLD concentrations in radishes grown with three of the amendments were significantly lower than in the two control plots and well below the MRL, which was substantially exceeded in the radishes grown on untreated soil. For cucumbers, the treatments with regular Daramend® and with a local
bagasse-ZVI mixture produced fruits with CLD below the MRL and also below the concentrations in one of the two control plots. As for the sweet potatoes, adding a bagasse-ZVI mixture had a significant positive effect by decreasing contamination to below the levels in the two control plots and below the MRL.
Keywords: Chlordecone; degradates; soil decontamination; chemical reduction; plant; Maximum Residue Level
INTRODUCTION
Cases of environmental contamination by chlordecone (CLD) have been documented for many years. This can result from industrial CLD production, as in the James River case (Borsetti and Roach, 1978; Carver and Griffith, 1979; Huggett & Bender, 1980), or from its application on farmlands as an insecticide, resulting, in Guadeloupe, in its proven presence in soils and rivers (Snegaroff, 1977), but also in a whole series of living organisms in the ecosystems of its banana-growing regions (Kermarrec, 1980).
Harmful effects of chlordecone on human health were reported as early as 1978 (Cannon et al, 1978; Cohn et al, 1978; Reuber, 1979). Subsequently, teratogenic and pro-carcinogenic effects in birds (Eroschenko 1981) and an effect on the incidence of hepatocellular carcinoma in rats (Sirica et al 1989) were identified. A synthesis of all studies on its toxicity in animals and humans up to 1995 was published that year (Faroon 1995). The oestrogenic activity of CLD, which can be responsible for endocrine disruption, was later demonstrated in vitro (Hammond 1 2 3 4 5 6 7 8 9 10 11 12 13 14 15 16 17 18 19 20 21 22 23 24 25 26 27 28 29 30 31 32 33 34 35 36 37 38 39 40 41 42 43 44 45 46 47 48 49 50 51 52 53 54 55 56 57 58 59 60
1979; Clere 2012; Alabed Alibrahim 2018). Epidemiological studies in the French Caribbean have shown an increased occurrence of prostate cancer (Multigner et al, 2010), a negative impact on the cognitive, visual and motor development of infants (Dallaire et al, 2012; Multigner et al, 2016) and pregnancy complications (Kadhel et al, 2014).
In the last twenty years or so, sampling campaigns have been organised to collect data on CLD contamination of ecosystems in the French Caribbean and to investigate the mechanisms involved in its transfer between ecosystems and between ecosystem compartments. Data are now available for surface and ground waters (Bocquené and Franco, 2005), fisheries and seafood resources (Coat et al 2006; Bertrand et al 2009), freshwater fish and crustaceans (Monti and Coat 2007), soils (Brunet et al 2009, Cabidoche et al 2009), ducks (Jondreville et al 2014), bulls (Jurjanz et al, 2017) and bovine livers (Saint-Hilaire et al,2018).
From 2002 to 2005, administrative measures were introduced to limit the exposure of populations by regulating the marketing of different types of vegetables (Achard et al 2007; Joly 2010), poultry and other animal foods (Official Journal of the French Republic, 2005; Journal Officiel de la République Française, 2005). Consumption and commercialisation of fish and seafood have also been partly banned (Guadeloupe Regional Prefecture, 2010; Préfecture de la Région Guadeloupe, 2010). Regarding vegetables consumed, studies on the mechanisms involved in soil-to-plant transfers have produced a major advance for crisis management by establishing threshold soil concentrations above which the cultivation of different types of crops should be either banned or discouraged (Cabidoche & Jannoyer, 2012).
In view of the need to back up regulatory approaches to crisis management with measures to reduce contamination, a group of experts attempted to identify potential depollution methods that could be applied to soils, sediments and water in Martinique and Guadeloupe (Clostre et al, 2010). Although the central role, whether direct or indirect, of soil contamination in the degradation of all French Caribbean ecosystems is undeniable, few studies have yet been made on possible methods for decontaminating soils.
Phytoremediation by crop plants is limited by the very low soil-to-plant transfer rates (Clostre et al, 2014, 2015, 2016; Woignier et al, 2012, 2016). The potential of other plants also seems quite insufficient: over one growth cycle, two Miscanthus species could extract only 0.03 % of the mass of CLD added extemporaneously to a clay-loam soil to simulate contamination by 1 mg of CLD/kg of dry soil (Liber et al, 2018).
Neither has biodegradation proved effective to decontaminate soils, even under laboratory conditions. In andosol microcosms sieved to < 2 mm and placed in aerobic conditions with an added solution of 14C-CLD in acetone, no more than 4.4 % of the initial dose of 14C-CLD was
mineralised after 215 days (Fernandez-Bayo et al, 2013).
On the other hand, an adaptation of the In Situ Chemical Reduction principle (ISCR) to laboratory 80 kg mesocosms of the 3 main soil types of the French Caribbean contaminated by CLD has produced very encouraging results (Mouvet et al, 2017). The trial used the Daramend® amendment with added Zero Valent Iron filings (ZVI) in a series of cycles
alternating reducing and oxidising conditions. After 6 months of treatment, CLD concentrations dropped by 74% in nitisol, 71 % in ferralsol and 22 % in andosol. Eleven dechlorinated products of CLD transformation were identified, from mono (CLD 1Cl) to pentadechlorinated (CLD -5Cl). None accumulated during the trial and of the seven ecotoxicity tests implemented, six showed no difference between the treated soils and the untreated control samples.
The effect of ZVI alone, without the easily degradable organic material in Daramend®, was
investigated using distilled water to which was added 100 mg/l of CLD dissolved in acetone 1 2 3 4 5 6 7 8 9 10 11 12 13 14 15 16 17 18 19 20 21 22 23 24 25 26 27 28 29 30 31 32 33 34 35 36 37 38 39 40 41 42 43 44 45 46 47 48 49 50 51 52 53 54 55 56 57 58 59 60 61
and 0.2 g of ZVI. The CLD was entirely transformed as from Day 14 into 14 dechlorinated degradates (Belghit et al, 2015) identical to those formed after ISCR treatment of actual soils in the laboratory (Mouvet et al, 2017).
This series of results for chemical reduction is consistent and promising but was obtained in the laboratory and therefore required validation under actual field conditions. This was the object of the study presented here, which had two main aims and was conducted using only facilities that were readily available in French Caribbean banana-growing areas.
The first aim was to quantify the effects of an ISCR approach on CLD concentrations and the formation of degradates in the soil of a banana plantation under natural conditions. As indicated above, laboratory results using an aqueous matrix, compared to results with real soils, suggest that ZVI has a major role in CLD transformation. As well as the Daramend® amendment,
promoted by the ISCR patent holders, a ZVI-only amendment was therefore tested in situ, in two different grain sizes. Since bagasse from sugar cane is locally available and could play the same role as the alfalfa in Daramend®, two other trial treatments with added bagasse and
added ZVI, one provided by the Daramend® manufacturer (FMC) and one prepared on site by
the project team, were also applied.
The second aim was to study the influence of the ISCR procedure on plants grown on the soil after treatment, since consumption of plants is one of the main sources of human exposure to CLD (Dubuisson et al, 2007; Guldner et al, 2010). A decrease in soil concentrations obtained without also lowering concentrations in plants would be only half a success. This study therefore addressed both agronomic criteria (yields, unit mass, visual quality) and human health-related criteria (CLD concentrations in parts consumed) for radishes, cucumbers and sweet potatoes grown on trial plots treated with the different ISCR variants and on two control plots.
MATERIAL & METHODS
Experimental plot and remediation treatments applied
The study parcel is a banana plantation in Martinique, located to the north-west of Fort-de-France at an altitude of 71m and growing on a nitisol with proven chlordecone contamination of the 0 - 40 cm soil horizon, at 0.71 ± 0,26 mg/kg, n = 24. Because of this contamination, cultivation of various subsistence crops is discouraged (Cabidoche & Lesueur-Jannoyer, 2012).
The ISCR patent (United States Patent, 2000) describes the process as involving multiple treatment cycles that alternate strongly reducing conditions with oxidizing conditions. The reducing conditions result from the addition of Daramend® amendments and water to obtain a
soil moisture content close to its water holding capacity. The regular Daramend® soil
amendment used for the study and purchased from the US company FMC, was a mixture of 70 % alfalfa and 30% ZVI. In order to test a soil amendment containing a local raw material instead of alfalfa, two other amendments containing bagasse were tested: Daramend® with
bagasse (also developed by FMC with 70 % bagasse and 30 % ZVI) and a bagasse/ZVI mixture (developed by the BRGM with 70 % bagasse and 30 % "coarse" ZVI). Finally, two treatments with ZVI only were applied, coarse ZVI (30 % < 50 µm; Lövink Technocast b.v, 7060 AA Terborg, Netherlands, imported from Poland) and fine ZVI (98 % < 50 µm; Dousselin iron powder NC 100.24; Dousselin & Geoffray-Jacquet Réunis, 69270 Couzon au Mont D'Or, France). 1 2 3 4 5 6 7 8 9 10 11 12 13 14 15 16 17 18 19 20 21 22 23 24 25 26 27 28 29 30 31 32 33 34 35 36 37 38 39 40 41 42 43 44 45 46 47 48 49 50 51 52 53 54 55 56 57 58 59 60
The parcel was divided into 6 trial plots (105 m², 15 x 7 m): P1 with coarse ZVI; P2: control; P3: Daramend® with bagasse; P4: regular Daramend®; P5: fine ZVI; P6: bagasse + coarse
ZVI.
Based on FMC’s expertise (J. Mueller, personal communication), a 6% dose (dw/dw) was applied in the P3 & P4 plots with Daramend®. The same dose was applied for the BRGM's
bagasse + ZVI treatment. 300 kg of quicklime with 52 % CaO were also applied in the P3 and P4 trial plots to obtain the pH recommended by FMC, of about 6.5 (the final pH was quite close to the target, with the soil water pH for P3 and P4 at 6.9 on completion of the ISCR treatment). For the P1 & P5 trials using ZVI only, a smaller mass of amendment was used (4 % dw/dw), because the cost of the ZVI powder limited the amount that the study could afford.
An additional adjacent plot, PA, 100 m2, was treated with 2.8 % (w/w) coarse ZVI in the second
phase of the study. This plot was equipped with suction cups during the ISCR treatment to monitor concentrations of CLD and degradates in the soil water. As the background concentration in this plot was much higher than in the 1st control plot, P2, a second control plot,
labelled P8, was used in addition to P2 for the agronomy part of the study.
The total mass of each amendment was incorporated into the soil down to 35 - 40 cm, in two successive half-doses and cross-ploughing six times after each application from north to south and from east to west. A rotary spader was used in the P1, P5 and P6 trial plots, and an Adventus-FMC tractor-driven rotary tiller in the P3 and P4 trial plots.
After ploughing to incorporate the amendments, the soil was compacted by driving an 8200 kg tractor across the entire parcel to reduce the amount of air that could compromise treatment efficiency by chemical reduction. This increased the apparent density of the 0-10 cm horizon from 0.8 to 1.2. After applying the treatment, a plough was again used to break up and aerate the soil.
The parcel was irrigated with a system of 5 parallel sprinkler lines running down their length. Each line was fitted with 10 rotating sprinklers 10 m apart. This set-up produced an average discharge of 10.9 ± 1.3 mm/h, n = 12, as measured from the volumes of water collected in tubs distributed randomly across the entire study parcel. The parcel was irrigated for the first time just after incorporation of the soil amendments, until puddles of water appeared in several places. It was irrigated for the second time when the soil moisture content dropped below the water-holding capacity determined before treatment (0.42). To preserve soil moisture and minimise its re-oxygenation through exchanges with the atmosphere, the trial plots were covered with waterproof tarps after each irrigation phase.
The total irrigation water height amounted to 154 mm over the 12 weeks of treatment of P1 to P6, or the equivalent of 8 weeks of conventional banana crop irrigation in the study zone. Accumulated rainfall over the parcel during the 3 months of study amounted to 610 mm (monthly average: 203 ± 35 mm, Mouvet et al, 2016 a). The total water height for PA and P8 (control 2) amounted to 195 mm over the 8 weeks of treatment, during which accumulated rainfall amounted to 237 mm. In terms of added water height, the irrigation component in the process was therefore in no way unusual.
Soil sampling and characterisation, Eh determination and analyses of chlordecone and degradates
Initial soil characterisation
Twelve independent soil samples were taken at random locations across the 1000 m2 plot.
The main physico-chemical parameters were analysed by an accredited laboratory (SAS, Ardon, France) using standardised procedures previously reported (Mercier et al, 2013). Two 1 2 3 4 5 6 7 8 9 10 11 12 13 14 15 16 17 18 19 20 21 22 23 24 25 26 27 28 29 30 31 32 33 34 35 36 37 38 39 40 41 42 43 44 45 46 47 48 49 50 51 52 53 54 55 56 57 58 59 60 61
techniques were used to verify the presence of halloysite clay, the main mineralogical characteristic of nitisols. The crystal structure of halloysite was characterised by X ray diffraction using a Philips PW 1830 (Cu K) diffractometer. The diffraction angles studied ranged from 2 to 50 degrees and the inter-reticular distances investigated, d, were within the range of 1.1 to 11 Å. For infrared spectroscopy, an IR-FT Nicolet 510P (ThermoFischer Scientific Inc., Waltham, MA, USA) spectrometer was used and the soil samples were characterised in transmission mode after dilution in KBr pellets with a 5 10-3 mass ratio. The
IR spectra were obtained in the wavelength range of 400 - 4 000 cm-1.
Subsequent soil sampling strategy
The trial plots were subdivided into 3 zones of equal size. In each zone, 4 sampling points were located by a random selection of X - Y coordinates, keeping to a distance of 0.5 m from the plot edges (and from the suction cups used when soil moisture was investigated). 12 samples were thus taken on each date in each trial plot.
At each sampling point, a 900 g soil sample was taken with a garden fork from the 0 - 20 cm horizon and two 450 g samples were taken with an auger, first from the 20 - 30 cm horizon (1st
drilling), then from the 30 - 40 cm horizon (2nd drilling). These samples taken at 3 different
depths were then thoroughly mixed together to produce a single sample for the 0 - 40 cm horizon. This procedure is repeated for each of the 4 sampling points of the zone, and an overall composite sample of the zone is produced from these 4 single samples. For each trial plot, we thus obtained 3 composite soil samples from the 0 - 40 cm horizon, each to be analysed separately for CLD and degradates.
Measurement of redox potential
For each of the 12 sampling points, 5 redox measurements were taken for the 0 - 20 cm horizon in a hole made with a garden fork (1 measurement on each of the 4 sides of the hole and 1 at the bottom), 3 for the 20 - 30 cm horizon from hand-augered samples and 3 for the 30 - 40 cm horizon from samples taken by the second augering. The point of making so many measurements was to reduce the effects of soil heterogeneity. In our presentation of the results, the figures for the 20 - 30 cm and 30 - 40 cm horizons are averaged to represent the 20 - 40 cm horizon.
The probe was calibrated before making the measurements using a standard 220 mV solution. The reference electrode was an Ag/AgCl (WTW, IDS ORP Electrode Sentix® ORP 900, supplied by VWR). The indicator electrode was a platinum ring and the reference electrolyte was KCl 3M (measurement range: - 1 250.0 to +1 250.0 ± 0.2 mV). The electronic unit was a digital multi-parameter portable WTW® 3 420 (supplier: Val de Loire Labo, F-41220 Saint-Laurent-Nouan, France).
All readings were corrected for the potential of the hydrogen electrode with the following equation:
corrected Eh = measured Eh + 224.6 – 0.71418 x T (°C) + DE
where DE is the difference between the measured value of the standard at the measurement T° (long-stem digital Multi Thermometer: - 50 °C to 150 °C, ± 0,5 °C) and the value that the standard should theoretically have at this T°.
Determination of chlordecone and its transformation products in soil samples
The samples were dried (40 ± 1°C for 72 h) in aluminium trays before crushing and sieving to < 2 mm. A representative aliquot was further ground down to < 80 µm, a grain size optimising the representativeness of the sample taken for analysis. Another representative aliquot was 1 2 3 4 5 6 7 8 9 10 11 12 13 14 15 16 17 18 19 20 21 22 23 24 25 26 27 28 29 30 31 32 33 34 35 36 37 38 39 40 41 42 43 44 45 46 47 48 49 50 51 52 53 54 55 56 57 58 59 60
dried at 105 °C to measure the residual moisture content after drying at 40 °C, and used to express results relatively to the actual dry mass.
The extraction and analytical methods (Bristeau et al, 2014) are briefly summarised here. The determination of CLD and its transformation products started with Pressurised Liquid Extraction of the 5 g (dw) soil sample ground down to < 80 µm with a 50/50 v/v acetone/hexane mixture at 100 °C and 110 bars of pressure. CLD-C13 and transnonachlore were used as internal standards. GC/MS/MS analyses were performed with a Bruker GC450 gas chromatograph, a 1177 injector, a Combi Pal (CTC) automated sampler and a 300MS triple quadrupole mass spectrometer. Recovery rates from the 3 soil types ranged from 92 to 139% (mean = 114 %, standard deviation = 16%, n = 24), the quantification limit for CLD being 0.03 mg kg-1 (Bristeau et al, 2014).
Three CLD transformation products were quantified thanks to available analytical standards: 5b-monohydroCLD, another monohydroCLD for which the data available at the time of the study (Belghit et al, 2015) did not enable us to determine whether the dechlorination position is 5- or 5a (CAS nomenclature), and chlordecol, with QL of 0.03 mg/kg for the 3 compounds. Concentrations in mg/kg could not be calculated for the transformation products for which no standards were available. However, we were able to estimate their relative abundance by calculating their relative peak areas (Mouvet et al, 2017).
Soil solution sampling and analyses Sampling with suction cups
Suction cups were installed in the PA trial plot (with 2.8 % ZVI) in order to determine concentrations of chlordecone and any degradation products in pore water in the soil. Various types of suction cup tips were tested in laboratory conditions: ceramic, stainless steel and glass. The glass type (item 4311.20/00 Ecotech, Germany, pore diameter: 20 µm) was selected as it sorbed the least CLD (data not presented here).
Before they were installed, all the suction cups were soaked for about 12 hours in distilled water in order to clean off any particles of manufacturing residue. The spatial coordinates of the cups were determined by generating suites of random numbers (Excel), keeping to a distance of 0.5 m from the inner edges of the trial plots. Three pairs of suction cups were installed, with one at a depth of 35 cm and one at 50 cm, at an angle of 45° to minimise the preferential water flow that can lead directly to the tip if the cup is installed vertically. The diameter of the auger used to drill the hole was 1 cm larger than that of the suction cup: a silicone filler was used to seal the gap around the suction cup after installation.
Negative pressure (25 h, - 0.4 bar ± 0.02 bar) was applied first to eliminate the moisture from the silicone filler and a second time (48 h to 50 h, - 0.4 ± 0.02 bar) before sampling the water to be analysed. The water was collected in brown glass bottles, then transferred in the laboratory into 250ml flasks, adding analytical quality acetone at a rate of 0.1% of the water volume collected.
Analyses of soil solution
The samples collected from the suction cups were spiked with 13C chlordecone (internal standard for chlordecone and its degradation products) and transnonachlor (internal standard for chlordecol). Liquid-liquid extraction as from a 100 mL sample was performed with twice 5 mL of a hexane/acetone mixture (85/15, v/v) in the presence of sodium chloride (50 g/L) at a pH of 2.5 (± 0.5). The extract was evaporated and finalised to 0.5 mL in cyclohexane.
Analysis was by gas chromatography coupled with mass spectrometry, using the same parameters as for the soil analysis. The quantification limit for analysing chlordecone, 1 2 3 4 5 6 7 8 9 10 11 12 13 14 15 16 17 18 19 20 21 22 23 24 25 26 27 28 29 30 31 32 33 34 35 36 37 38 39 40 41 42 43 44 45 46 47 48 49 50 51 52 53 54 55 56 57 58 59 60 61
hydrochlordecone and 5- or 5a-hydrochlordécone is 0.07 µg/L. As with the analyses in soil samples, the other transformation products were semi-quantified through their relative chromatographic peak area.
Agronomy section
Plants tested, soil preparation before planting, establishing the crops
Three plants were tested: radishes (Raphanus sativus), cucumbers (Cucumis sativus, Var. EUREKA) and sweet potatoes (Ipomoea batatas). These 3 plants were chosen because they are reference crops in terms of their response to in soil pollution (Clostre et al, 2014) and because they contribute significantly to consumer exposure (Dubuisson et al, 2007 ; Guldner et al, 2010).
Soil preparation before planting involved rototilling three times to a depth of 40 cm in each trial plot. A ridging plough was then used to form four ridges 30 cm high and 1.2 m apart in each trial plot, in order to optimise plant growth and development and facilitate work in the plots. Finally, the soil was raked and hoed by hand to break up the clods and shape the ridges. The interval between the ploughing that completed the ISCR treatment and plantation of the crops was 4 months for P1 to P7 and just 1 month for PA. To ensure that the trials reflected usual procedure, the planting method and density were established in accordance with the recommendations published by the Martinique Chamber of Agriculture. In each trial plot, the radishes were sown in two rows 15 cm apart in three beds 3 linear metres in length, making a total of 6 rows x 3 linear metres in each plot. 50 cucumber seedlings in mini soil blocks were transplanted into each plot in 5 beds of 10 seedlings 45 cm apart. The sweet potato cuttings, about 25 cm long on average with at least 3 buds, were taken from an experimental plot run by the Martinique Chamber of Agriculture. 50 cuttings were planted in each plot, in 5 beds of 10 cuttings 25 cm apart.
Irrigation system and analysis of irrigation water
The irrigation system was typical of those used in banana plantations and comprised 12 sprinklers with a 5-metre sprinkling radius, placed 9 metres apart so that each trial plot could be entirely irrigated with two sprinklers. The average flow rate of 2.6 mm/hour (n = 12, standard deviation = 0.8) was assessed using tubs placed randomly across the plot for one hour during irrigation. The water was pumped into the storage pond adjacent to the banana plantation studied, using a pump fitted with a suction strainer.
For the irrigation water analysis, due to local operational constraints and overall financial constraints, a sampling strategy had to be used involving composite integrating samplers. On each of the 8 sampling dates, one 1-litre sample was collected in a glass bottle from 4 randomly chosen sprinklers. The two samples taken on two successive dates (at 2, 4, 5 or 10 day intervals) were then mixed and homogenised to produce a composite sample. The four composite samples thus obtained, each corresponding to 8 sub-samples (4 sprinklers on 2 dates), were then analysed. A 5th sample taken from 4 sprinklers on one day only was also
analysed.
The analytical procedure combined solid-phase micro-extraction (SPME) for 10 minutes, separation by gas chromatography (GC) and identification by mass spectrometry (MS and MS/MS). Quantification was based on a standard addition method (Soler et al, 2014).
Fertilisation 1 2 3 4 5 6 7 8 9 10 11 12 13 14 15 16 17 18 19 20 21 22 23 24 25 26 27 28 29 30 31 32 33 34 35 36 37 38 39 40 41 42 43 44 45 46 47 48 49 50 51 52 53 54 55 56 57 58 59 60
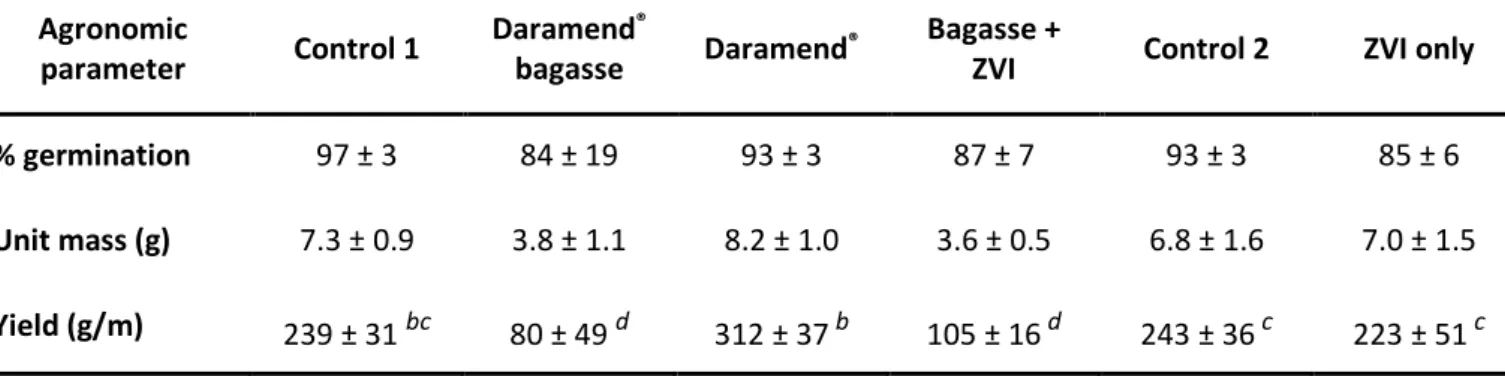
To provide the crops with the necessary nitrogen, phosphorus and potassium, complete banana fertiliser mixtures (14 - 4 - 28), DAP (Di-Ammonium Phosphate) and KCl, all routinely used by farmers in the French Caribbean, were applied to all the trial plots (Table 1).
Use of suction cups to investigate concentrations of chlordecone and degradates in the soil solution
The same suction cups as those used for the physico-chemical phase of the study were installed in P2 (control 1), P4 (regular Daramend®) and PA (ZVI only). Three suction cups were
installed in each of these plots, each placed between 2 sweet potato plants at a depth of 30 cm and at a 45° angle to minimise preferential vertical transport along the auger hole made for the suction cup.
Pre-treatment of the suction cups before their installation, the installation method and the sampling protocol are described above. Samples were taken on three dates spread out over the growth cycle. For each sampling point (each suction cup), a composite sample was produced from the 3 sampling dates, priority having been given to spatial variability (3 different locations, 1 average sample per location) over a temporal variability approach (1 composite sample from the 3 suction cups for each of the 3 dates). Three analyses would therefore be available for each of the 3 trial plots.
CLD and its degradates were analysed in accordance with the protocol described above for the suction cups installed for the physico-chemical phase of the study.
Harvest for the analysis of chlordecone and its degradates
The radishes were carefully dug out with a mini-excavator to retain their fine roots. All radishes along a 1.5 metre row were collected in one repetition. The radishes were sorted into 2 categories, those of marketable size (more than 1.2 cm in diameter) and the smaller individuals, then counted and weighed (Mettler PE600 precision scales). Chlordecone was analysed for each trial plot from a composite sample obtained from 75 homogeneous radishes of median size, corresponding to 25 radishes from each of the 3 beds of seedlings. After washing - first with tapwater, then with distilled water - and drying with absorbent tissue, the radishes were cut up axially into even-sized pieces, then stored in a freezer at - 18 °C until shipping to the laboratory in isotherm packages refrigerated with dry ice packs. Five sub-samples were taken from the composite sample and analysed separately.
The cucumbers were harvested when the control cucumbers had reached their marketable size of 12 cm. Six more harvests then took place, one every 3 to 4 days over 3 weeks. Each time, the cucumbers were weighed, counted and sorted into marketable (L > 12 cm) and non marketable (L < 12 cm) fruits. The composite sample for the analysis was made up from each of the 5 beds in each trial plot, using 12 average-sized cucumbers chosen randomly from the batches comprising 4 cucumbers harvested on 3 different dates. Each cucumber was washed first in clean water, then in distilled water, then dried with absorbent tissue. Each was cut into 8 pieces, with two longitudinal cuts along the axis and one cut across the width. Four pieces were chosen and added to the 12 pieces taken in the same way from the three other cucumbers harvested from the same bed on the same date, to produce a composite sample of 16 independent pieces from the same day's harvest. By combining the samples made up for each bed on three different dates, we obtained a final composite sample of 48 cucumber pieces. This composite sample was then vacuum packed and stored in a freezer until shipping to the laboratory in a refrigerated package. Five sub-samples were taken from the composite sample and analysed separately.
The sweet potatoes were harvested 5 months after planting. All tubers dug out with a garden fork were collected. They were counted, weighed and sorted in the laboratory, separating out the non marketable tubers (L < 10 cm, or calibre < 5 cm, or damaged tubers), which would not be analysed. For each of the 5 beds, 10 uniform sweet potatoes of marketable size were chosen and carefully washed in clean and then distilled water, scrubbing them gently to 1 2 3 4 5 6 7 8 9 10 11 12 13 14 15 16 17 18 19 20 21 22 23 24 25 26 27 28 29 30 31 32 33 34 35 36 37 38 39 40 41 42 43 44 45 46 47 48 49 50 51 52 53 54 55 56 57 58 59 60 61
preserve the fine skin covering the tubers. Particular care was taken with crooked tubers to prevent any earth from contaminating the sample. 3 rounds 1 cm thick were cut from each of the 10 tubers. The 30 rounds were then cut in half along the axis to make up a composite sample, then placed in bags and stored in a freezer until shipping to the laboratory in refrigerated packages. Five sub-samples were taken from the composite sample and analysed separately.
Analysis of chlordecone and certain degradation products
The plant samples were analysed at the analytical laboratory of the Drôme département (LDA 26 ; 37 Avenue de Lautagne, BP 118, F-26904 Valence cedex 9, France). The French Agency for Food, Environmental and Occupational Health & Safety standard method for CLD analysis in plant material was applied (Agence nationale de sécurité sanitaire de l’alimentation, de l’environnement et du travail, 2015). After extraction and purification, the concentrations of chlordecone, chlordecol and 5b-hydro CLD were measured with a high-performance liquid chromatograph mass spectrometer (Thermo, West Palm Beach, USA) TSQ Quantum). The quantification limits for these 3 micropollutants were respectively 0.5, 2.6 and 0.5 µg/kg of fresh material for cucumbers and sweet potatoes, and 1, 10 and 1 µg/kg of fresh material for radishes. The higher quantification limit for radishes is due to the smaller amount of total biomass available for each sample. By convention, the detection limit is equal to the quantification limit divided by 3.
Statistics
All the statistical analyses and boxplots were performed with R (R Core Team, 2014), with a 5 % p-value. The distribution of the values was assessed for normality with the Shapiro-Wilk test, with variance equality verified by the Bartlett test.
For the values of redox and CLD and degradation products the following tests were applied: - Comparison of redox values, CLD and degradation products at different sampling
campaigns: non-parametric Kruskal-Wallis rank tests, using the R "agricolae" package. - Comparison of different plots and depths at each sampling time: ANOVA followed by Tukey
HSD test (Honest Significant Difference) to compare treatments using the R “stats” package.
For the agronomy data the following tests were applied to assess the effects of the treatments on each plant:
- Dunnett test to compare treatments with a control sample, "multcomp" package (Torsten Hothorn et al, 2008),
- Tukey HSD test (Honest Significant Difference) to compare treatments, R "stats" package, - LSD (Least Significant Difference) method to compare treatments by group, adjusted by
Bonferroni, R "agricolae" package (Felipe de Mendiburu, 2014).
The Wilcoxon-Mann-Whitney test comparing treatments was applied in cases of non-normal distribution or unequal variance.
RESULTS & DISCUSSION
Main soil parameters 1 2 3 4 5 6 7 8 9 10 11 12 13 14 15 16 17 18 19 20 21 22 23 24 25 26 27 28 29 30 31 32 33 34 35 36 37 38 39 40 41 42 43 44 45 46 47 48 49 50 51 52 53 54 55 56 57 58 59 60
Overall, most values (Table 2) were similar to those measured for another nitisol sample from Guadeloupe (Mercier et al, 2013), suggesting that the present study would be representative of French Caribbean nitisols in general.
P2O5, K2O and CaO appeared to vary somewhat (15 ≤ CV 25 %) between the 12 replicates.
These parameters are not very likely to influence the mechanisms involved in ISCR and their heterogeneity should therefore not influence the effects of the treatment applied to each plot. In contrast, the parameters likely to play an important role in ISCR (pH, total Fe and organic carbon) were fairly homogeneous (3 ≤ CV ≤ 10 %) across the study zone. The same parameters determined for P2, the additional plot treated with ZVI in the agronomy part of the study, did not differ significantly from those in table 2, with for instance a total iron content (%) of 8.3 ± 0.3 % and a water pH of 5.7 ± 0.4.
Presence of halloysite
The X-ray diffractogram of all 6 plots shows diffraction peaks at 4.45 and 7.4 Å (Online Resource 1). These inter-reticular distances are characteristic of halloysite clays (Dubroeucq et al, 1998; Onodera et al, 2001). The IR spectrum for all plots shows 2 clear peaks in the OH region (3 500 - 3 800 cm-1; Online Resource 2), which are characteristic of halloysite-type
phyllosilicate clays (Colmet - Daage et al, 1965, Gustaffsson et al, 1995), unlike amorphous clays that do not present the same well-defined bands. The plots studied are therefore typical nitisols with respect to the types of constituent clays.
Redox potential in the 0 - 20 cm soil layer
The changes of Eh values throughout the duration of the experiment for all trial plots are illustrated in Figure 1. The full data set will be described and discussed below, focusing first on the comparison between treatments for each of the 7 measuring campaigns, and then on the changes over time for each of the 6 different treatments.
Comparison between treatments for each measuring campaign
On the day before the experiment started, the mean Eh (mV vs. SHE) was 581 ± 54 in P1 (coarse ZVI), 563 ± 39 in the control (P2), 527 ± 76 in P3 (Daramend® bagasse), 529 ± 63 in
P4 (regular Daramend®), 540 ± 59 in P5 (fine ZVI) and 533 ± 80 in P6 (Bagasse with ZVI). In
P3, P4, P5 and P6, the values do not differ from each other or from the control plot P2. The mean value in P1 is not statistically different from the control plot but slightly higher than in the 4 other treated plots (Fig 2).
Two days after adding the amendments (T2), corresponding to 1 day after the end of the first irrigation, the mean redox potential in the control plot was 628 ± 52 mV. The lowest mean Eh values, of - 255 ± 132 mV and - 254 ± 58 mV, were obtained with the fine (P5) and coarse ZVI (P1) treatments respectively. This range is very similar to the values obtained in optimised laboratory conditions with regular 2 to 12 % Daramend® and 1% additional ZVI(Mouvet et al,
2017). The plot treated with the regular Daramend® (P4) yielded a mean Eh value, 6.9 ± 218
mV, very much lower than the control but higher than in the ZVI trials. Spot values below – 300 mV were observed only in P1 (n = 2) and P5 (n = 5), the lowest spot value of all treatments being recorded at - 405 mV in P5 (fine ZVI plot). The two trials with bagasse and ZVI (P3 and P6) each had mean Eh values that were lower than in the control plot but still positive. Statistically, P1 and P5 do not differ from each other but show values significantly lower than all the other trials. P4 and P6 do not differ from each other but differ significantly from all the other trials. P2 and P3 differ from each other and from all the other trials (Fig 3).
Although few changes occurred between the 3rd and 7th day (July 1, T2)) of treatment, the mean
Eh values in the two ZVI-only trial plots did begin to increase during that period (Fig 1), leading to values in P1 becoming no more statistically different to those of P4 and P6 (Fig 4).
1 2 3 4 5 6 7 8 9 10 11 12 13 14 15 16 17 18 19 20 21 22 23 24 25 26 27 28 29 30 31 32 33 34 35 36 37 38 39 40 41 42 43 44 45 46 47 48 49 50 51 52 53 54 55 56 57 58 59 60 61
Between the 3rd and 21st day (July 18, T3) of treatment, the mean Eh decreased by 75 mV in
the control plot and by 113 mV and 64 mV in the regular Daramend ® and bagasse + ZVI plots
respectively, but a slight increase, of 56 mV, occurred in the Daramend ® bagasse plot. In
contrast, the increase in mean Eh was very clear for the coarse ZVI, at + 293 mV, and for the fine ZVI at + 185 mV, which produced a slightly positive value for P1 (39 mV) and a slightly negative value for P5 (- 70 mV ; Fig 1). This increase can be attributed to a decrease in the reduction potential of the added amendments as a result of partial oxidation of the added ZVI and reoxygenation of the soil. Compared to the trials with ZVI only, the decrease (P4 and P6), or smaller increase (P3), in Eh in the trial plots with easily biodegradable organic matter can be attributed to the continuous consumption of this biomass and the associated oxidative species. On the 21st day of treatment (T3), the statistical analysis indicates that the mean Eh value for all the trial plots was significantly lower than that in the control plot. The drop in Eh compared to the control was smaller in P3 than in the other 4 trial plots. P3 mean value was significantly higher than in the other 4 trial plots in which the only difference was between P1 and P4 (Fig 5).
On Day 35 (July 30, T4), despite a second irrigation (66 mm) between the 27th and 28th day of
experimentation (July 22 and 23), Eh continued to increase in both ZVI-only plots (P1 and P5), reaching mean values of + 352 mV and + 308 mV respectively. In contrast, Eh remained fairly stable in all other plots. The failure of the 2nd irrigation to further decrease the Eh values, or at
least to stop the increase in Eh, may be due to the fact that the mechanisms involved in lowering the Eh resulting from the oxidation of ZVI when added without easily biodegradable organic matter had exhausted their potential. At this time of the experiment, P4 and P6 do not differ significantly from each other but differ significantly from all the other trials, P1, P3 and P5 do not differ significantly from each other but differ significantly from all the other trials, and P2, with a mean value of + 547 mV, differs significantly from all the other trials (Fig 6). These 3 groups of Eh values match the 3 main types of treatments almost exactly: easily biodegradable organic matter (P4 and P6), ZVI only (P1 and P5), control (P2). The sole exception is P3, Daramend® bagasse.
Between the 44th and the 65th day of treatment (Online Resources 3 and 4), few changes
occurred (Fig 1), as was the case between the 3rd and 7th days.
At the end of 94 days of treatment (T7), P4 (regular Daramend®) and P6 (bagasse + ZVI) differ
significantly from all the other trials, with much lower, slightly positive mean values of + 71 and + 86 mV respectively, but do not differ from each other (Fig 7). The easily biodegradable organic matter of these two treatments remained efficient in keeping mean Eh values below 100 mV over a 3-month period in the experimental conditions of this study. The prolonged lowering of Eh values in the treatment with alfalfa or bagasse probably results from fermentation of these organic components producing organic acids that counter the production of hydroxyl ions resulting from the ZVI corrosion process (Dolfing et al, 2008). The trials P1, P3 and P5 do not differ significantly from each other. The control plot P2 differs significantly from all other plots except P1. Overall, the distribution of the various treatments into 3 distinct groups already observed on Day 35 was maintained at the end of the experiment.
In order to provide an overall view covering the whole duration of the treatment, a statistical analysis was conducted on the basis of a single data-set pooling the 7 measuring campaigns. On this basis, the mean Eh values in P4 and P6 do not differ from each other but are lower than the 4 other trial plots which all differ from each other, with values increasing in the following order: P5 < P1 <P3 < P2 (Fig 8). The mean of all post-treatment Eh values in the plot treated with Daramend® bagasse, at 363 ± 173 mV, was much higher than with the regular
Daramend® treatment, - 8 ± 218 mV. This may be due to a lower reductive capacity of the ZVI
in the regular Daramend® formulation, or to the poorer biodegradability of bagasse compared
to alfalfa. However, the mean of all post-treatment Eh values in the plot treated with the 1 2 3 4 5 6 7 8 9 10 11 12 13 14 15 16 17 18 19 20 21 22 23 24 25 26 27 28 29 30 31 32 33 34 35 36 37 38 39 40 41 42 43 44 45 46 47 48 49 50 51 52 53 54 55 56 57 58 59 60
bagasse + ZVI mix prepared on site with the same % of ZVI as in the Daramend® bagasse, 33
± 41 mV, is much closer to the mean for the regular Daramend® than for the Daramend®
bagasse. It is therefore tempting to attribute the difference in the mean Eh values of the two bagasse-based amendments to differences in ZVI efficiency. However, the characteristics (not measured) of the bagasse used in each of the two corresponding amendments may also have been different. The available data therefore cannot explain why the Eh values resulting from the Daramend® bagasse treatment differ so clearly from those obtained with the regular
Daramend® andthe bagasse + ZVI mix.
Comparison between measuring campaigns for each treatment
In addition to figure 1 providing an overview of all the data at a glance, we produced box and whisker plots to better visualise the changes in Eh over time for each treatment and to bring out the statistically significant differences between measuring campaigns.These plots are included in the manuscript for the coarse ZVI treatment (Fig 9), the control (Fig 10) and the regular Daramend® (Fig 11). The corresponding figures for the treatments with Daramend®
bagasse (P3), fine ZVI (P5), and the mix Bagasse - ZVI (P6) are provided as Online Resources 5 to 7.
In the coarse ZVI trial P1 (Fig 9), all values after T0 are lower than at T0. The values for the T1, T2 and T3 dates do not differ from each other, with lower T1 and T2 values than on the last 4 dates, T4 to T7. T7 exhibits the highest value of all dates except T5 (T5 on the penultimate measurement date and T7 at the end of the treatment period). The T4 values are in an intermediate position, higher than at T1 and T2 but not higher than at T3, and lower than at T5 and T7 but not lower than at T6. These differences over time indicate an initial, rather short, period of time from T0 to T2, i.e. 7 days, when the Eh values were significantly lower than during the rest of the treatment. This is followed by an intermediate phase (T3) that shows Eh values returning close to zero and differs significantly from the previous and next phases. The third and final phase has Eh values in the 400 - 500 mV range, shows little significant change from T4 to T7 and leads to a mean value at the end of the treatment (T7) which is the highest of all trial plots but still significantly lower than the mean value before the treatment started (T0).
In the control P2 (Fig 10), only T1 and T2 differ significantly, with higher values, from the 6 other measuring campaigns. The T1 and T2 values do not differ from each other but show a slight increase compared to T0. The values from T3 to T7 do not differ from each other and return to levels that are not different to T0, except the T6 value which is slightly lower than at T0. This somewhat erratic variation over time reflects the intrinsic heterogeneity of a field plot and the absence of any action in the control plot that could have had a consistent influence on mean Eh values.
In P3 (Daramend bagasse, Online Resource 5), all values after T0 are lower than at T0 and do not differ from each other, except the T4 value which is slightly lower than at T3, T6 and T7.
In the regular Daramend® trial P4 (Fig 11), all values after T0 are much lower than at T0 and
do not differ from each other, except the T7 value which is slightly higher than at T3 and T5. This very consistent effect of the treatment over time very probably reflects the lasting effect of the easily biodegradable organic matter making up 70 % of the amendment mass.
For the fine ZVI trial P5 (Online Resource 6), the changes over time are strikingly similar to those observed for P1. All values after T0 are lower than at T0. For three dates, T1, T2 and T3, the values do not differ from each other but are lower than for the 4 later dates. T7 exhibits the highest value of all dates except T6, from which it does not differ. T4, T5 and T6 do not differ from each other.
1 2 3 4 5 6 7 8 9 10 11 12 13 14 15 16 17 18 19 20 21 22 23 24 25 26 27 28 29 30 31 32 33 34 35 36 37 38 39 40 41 42 43 44 45 46 47 48 49 50 51 52 53 54 55 56 57 58 59 60 61
As in P6 (Online Resource 7), all values after T0 are much lower than at T0 and do not differ from each other.
Redox potential in the 20 - 40 cm soil layer
Most of the data for the 20 – 40 cm soil layer (Fig 12), whether on changes over time with any given treatment or on the differences between treatments at each measuring date, are very similar to the observations made for the 0 - 20 cm soil layer. The presentation and discussion concerning the 20 – 40 cm data is therefore much shorter than for the 0 – 20 cm layer. Accordingly, the focus is on the comparison between treatments for each measuring campaign, with a selection of box and whisker plots presented as Online Resources.
On the day before the experiment started, T0, the range of mean Eh values (563 ± 39 to 610 ± 76 mV) was very similar to that observed in the 0 – 20 cm layer (533 ± 80 to 581 ± 54 mV). At T0, the statistical analysis (Online Resource 8) divided the 6 treatments into 4 groups in each of which no treatment results are statistically different to the other treatment results in the same group (P1 ; P4 ; P3 = P5 = P2 ; P5 = P2 = P6), while only some treatment results for any given group may differ from some treatment results in another group (example above: P3 ≠ P6 but P5 and P2 = P6). This reflects an overall similarity between the trial plots, an interpretation which is further supported by the fact that no one treatment differs from all of the others. Two days after adding the amendments, the ranking of the Eh values for the various plots was very similar to that observed in the 0 – 20 cm soil layer, with mean values of + 664 mV for the control plot, -111 and – 132 mV respectively for the coarse and fine ZVI plots, and positive values for the three treatments combining organic matter and ZVI, at + 112 mV in P6, + 80 mV in P4 and + 307 mV in P3. Statistically, P1 and P5 do not differ from each other but are different to all the others; the same holds for P4 and P6, while P2 and P3 differ from each other and from all the others (Online Resource 9). Interestingly, this division into 3 groups corresponds almost exactly (with the sole exception of P3) to the 3 different types of treatments, as also observed for the 0 – 20 cm layer.
Between Day 3 and Day 21(July 18) the mean Eh in the control plot dropped slightly, while the mean redox potential in the ZVI-only plots increased, by 111 mV in P1 and by 46 mV in P5, although the mean values were still negative, at - 1 mV in P1 and – 86 mV in P5. Over the same period, the mean redox potential dropped by 160 mV to - 80 mV with the regular Daramend® treatment and by 25 mV to - 13 mV with the ZVI/bagasse mix. The redox potential
in P3 (Daramend® bagasse) remained positive, at + 388 mV (Fig 12).
Subsequently, the redox potential in the ZVI-only trial plots continued to rise, remaining slightly negative up to Day 35 (30/07) in P5 but becoming clearly positive (+ 150 mV in P5 and + 390 mV en P1) by Day 64 (29/08) and beyond. During the same 5-week period, the redox potential in the plots with added organic matter did not vary significantly and up to the end of the treatment, on 25/09, remained slightly negative in the plot treated with regular Daramend®,
slightly positive in the plot treated with the ZVI/bagasse mix, and clearly positive in the plot treated with Daramend® bagasse (Fig 12).
At Day 65, P4 (regular Daramend®) and P6 (bagasse + ZVI) differ significantly from all the
other trials, with much lower, slightly positive mean values, but do not differ from each other (Online Resource 10). The trials P1 and P3, with values close to that of the control, do not differ significantly from each other but differ significantly from all the other trials. The control plot P2, with the highest mean value, differs significantly from all other plots. P5 is in an intermediate position with a mean value which makes it differ from all the other treatments. Overall, the distribution of the various treatments into 3 distinct groups already observed on Day 3 was maintained until this late stage of the experiment.
1 2 3 4 5 6 7 8 9 10 11 12 13 14 15 16 17 18 19 20 21 22 23 24 25 26 27 28 29 30 31 32 33 34 35 36 37 38 39 40 41 42 43 44 45 46 47 48 49 50 51 52 53 54 55 56 57 58 59 60
At the end of 94 days of treatment (T7), all the treatment results differed: the highest value was measured in the control plot P2 and the lowest values in P4 and P6. The value closest to P2 was measured in P1, while the values for P3 and P5 came between P2 and P1 on the one hand and between P4 and P6 on the other hand (Online Resource 11).
As also done for the 0 - 20 cm layer, a statistical analysis of a single data-set pooling the 7 measuring campaigns provides an overall view covering the entire duration of the treatment. The mean Eh values in P5 and P6 do not differ from each other but are lower than the 4 other trial plots which all differ from each other with values increasing in the following order: P4 < P1 <P3 < P2 (Fig 13). The overall picture is therefore very similar in the 2 soil layers.
Effect of the ploughing ending the treatment
Ploughing in order to return the soil to its initial aerobic status caused the values for redox potential to rise to almost T0. For the 0 – 20 cm layer in P4 for instance, the mean Eh was 529 ± 63 mV before the addition of the amendment and 474 ± 88 mV two weeks after the tilling that ended the treatment. Given that the mean Eh in P4 had dropped to - 106 ± 194 mV 21 days after the start of the treatment, the quite drastic effect of applying an ISCR treatment on redox conditions in soils is therefore easily and quickly reversible.
Synthesis and link with literature data
Despite the fact that ISCR clearly relies on reducing conditions, most papers published on the use of Daramend® or ZVI for the remediation of soil polluted by chlorinated contaminants do
not include data on soil redox potential (Abbey et al, 2003; Kim et al, 2010; Phillips et al, 2005; Zhuang et al, 2014). In a clayey soil with a water content set in laboratory conditions to 80 % of the water-holding capacity (Dalgren et al, 2009), the lowest, transitory, redox potential of – 300 mV (relative to the standard hydrogen electrode) was obtained by the 20th week of
treatment after the addition of 2% Daramend® and an additional 1.5 % of ZVI (w/w). In another
case study with a silty loam soil, a total of 11% (w/w) Daramend® amendment and 0.2%
granular ZVI (Phillips et al, 2006) resulted in redox potentials as low as −553 mV (values probably not corrected for the standard hydrogen electrode potential; when corrected for this potential, a - 553 mV is in fact around – 330 mV). The lowest negative values recorded here are lower than these published values. In the case of our two treatments with ZVI only, the higher percentage of ZVI added may explain the lower Eh reached. The same reasoning holds in our trial with an added 6% dose of Daramend®, compared to the study with the clayey soil.
As in the study by Philipps et al, this involved a double dose of Daramend® compared to the
one we used, but a much lower ZVI dose. The lower Eh reached in our study suggests that ZVI plays a major role in achieving very low Eh values. However, because the soils treated in the 3 studies were all different, this suggestion must be taken as only an indication of the relative contribution of ZVI to the overall effect observed on Eh values.
The trials with ZVI only produced the most negative values and had average values more negative than the Daramend® treatments up to the seventh day of treatment (Fig 4). This may
be correlated with the higher percentage of ZVI in the ZVI-only treatments (4% with coarse and fine ZVI) vs. 1.8 % for the regular Daramend® and Daramend ® bagasse. In contrast, the
easily biodegradable organic matter in the regular Daramend ® and the mix bagasse – ZVI
succeeded in maintaining much lower Eh values than in the control plot for the entire duration of the experiment, and lower values than in the ZVI plots from Day 35 onwards (Figs 6 and 7). Over the duration of the treatment, the coefficient of variation (CV) of all Eh values in the control plot was 10 % for the 0 – 20 cm layer (n = 233) and 9% for the 20 – 40 cm layer (n = 305). In the treated plots, the variability was much higher, with, for instance, CVs of 146 % and 153 % respectively for the 0 – 20 cm and 20 – 40 cm layers in P1, with a maximum of 2725 % for the 0 – 20 cm layer in P4 (mean ± standard deviation: - 8 ± 218 mV, n = 230). This very high 1 2 3 4 5 6 7 8 9 10 11 12 13 14 15 16 17 18 19 20 21 22 23 24 25 26 27 28 29 30 31 32 33 34 35 36 37 38 39 40 41 42 43 44 45 46 47 48 49 50 51 52 53 54 55 56 57 58 59 60 61
variability of the Eh values in the trial plots reflects the fact that despite the effort of multiple cross-ploughing just after adding the amendments, their incorporation did not result in homogeneous redox conditions on the scale of the volume (a few tens of cm3) in which redox
is measured.
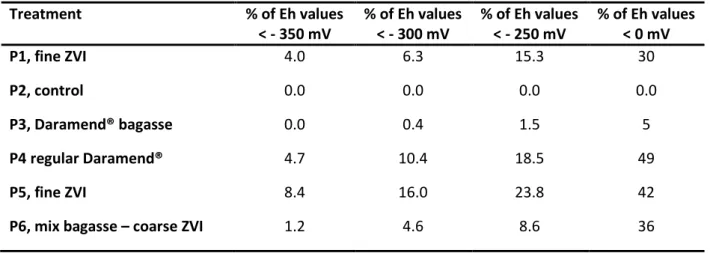
In view of the results presented below on the analyses for CLD and its degradates in the soil samples, taken together with the Eh measurements, the abundant Eh data collected needed to be synthetized. This was achieved by grouping together, for each treatment, the values of both the 0 – 20 and 20 – 40 cm layers for all post-treatment dates in a single data set. This simplification was possible because for 5 of the 6 trial plots, P5 being the exception, the Eh data after addition of the amendments do not differ significantly in the 0 - 20 cm layer from the results for the 20 - 40 cm layer (Online Resources 12 to 17). In addition, taking Eh values for the whole 0 – 40 cm layer is fully consistent with the fact that the analyses for CLD and its degradates were performed on samples representing the 0 – 40 cm layer (see Materials & Methods). This dataset was then used to allow direct comparisons between the treatments by calculating the percentage of Eh values below certain thresholds (Table 3). When the 3 lowest thresholds were considered, the trial plots ranked as follows: P5 > P4 > P1 >> P6 >>> P3 > P2. When the percentage of values < 0 mV was considered instead, the ranking changed slightly: P4 > P5 > P6 > P1 >> P3 > P2. Lastly, when the lowest mean value was cosnidered, the ranking was P5 = P1 > P4 > P6 > P3 >> P2 (Fig 21).
Chlordecone and its degradation products in the soil
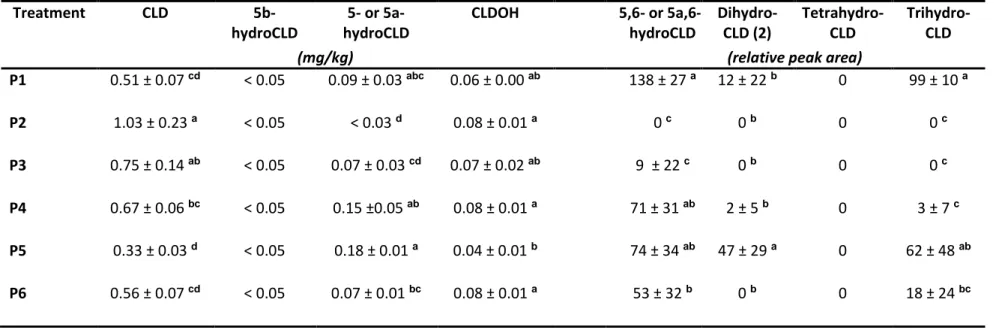
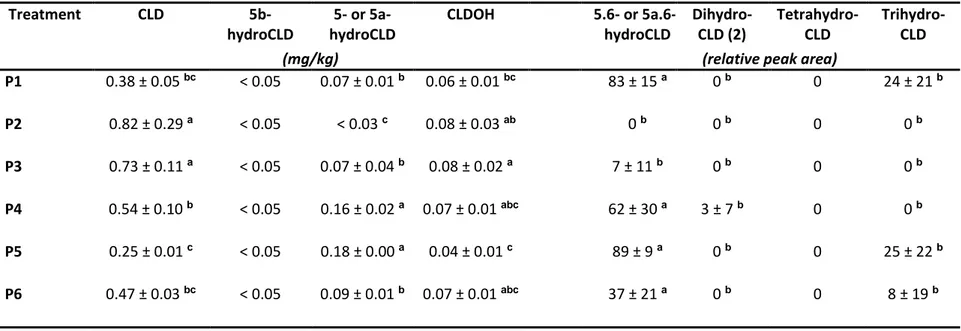
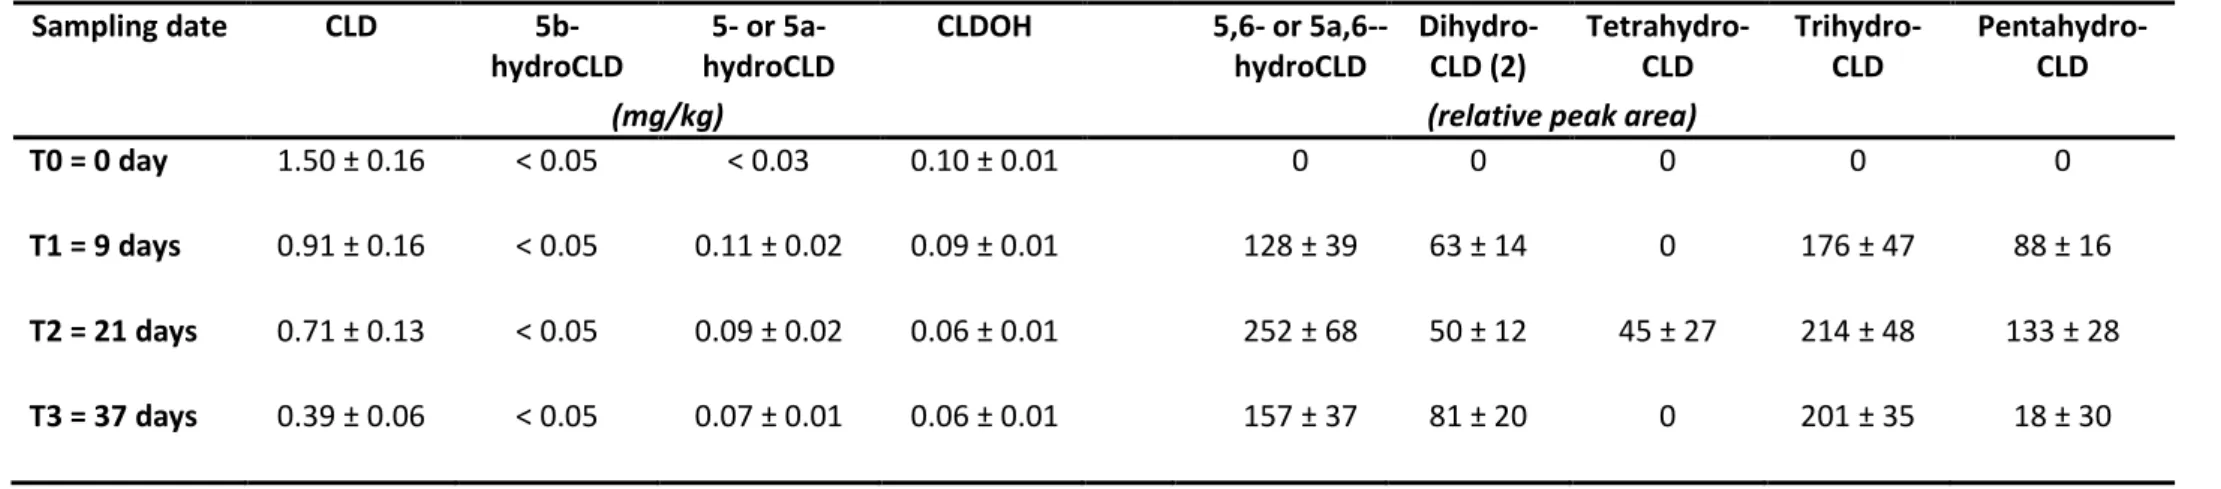
Three soil sampling campaigns were conducted 24, 64 and 94 days after incorporating the amendments.
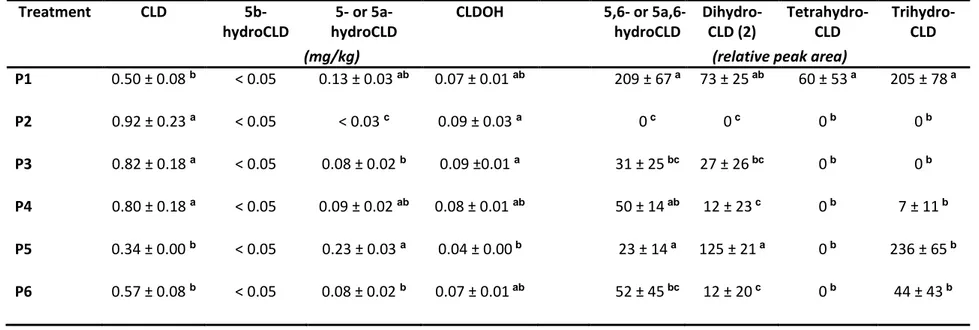
24 days after incorporation of the amendments (Table 4)
A clear drop in CLD concentrations was observed in the P1 and P5 plots where ZVI only had been added and, to a lesser extent, in P6. In terms of lowering CLD concentrations, 63 % efficiency was achieved in the best of cases (fine ZVI, Table 8). The second best result, a 45 % reduction, was obtained with coarse ZVI. The two commercial amendments were substantially less effective (11 and 14 %), while the local bagasse with a coarse ZVI mixture produced an intermediate result (39 %).
Chlordecol concentrations were very similar in most trial plots, the lowest value being recorded in the fine ZVI plot P5, significantly lower than in P2 and P3.
No 5b-hydroCLD was detected in any of the plots. It can however be quantified in soils where CLD concentrations are higher than those in the parcel analysed here, as it has two possible sources: impurities in the commercial formula containing the CLD or natural degradation of the CLD (Devault et al, 2015). On the other hand, concentrations of 5- or 5a-hydroCLD (another mono-hydroCLD, CLD – 1 Cl, absent from the commercial formulas of chlordecone) were clearly quantifiable (at least twice the quantification limit of 0.03 mg/kg), the value in the fine ZVI trial plot P5 representing 67 % of the residual CLD concentration and being the highest of all trials and significantly higher than P2, P3 and P6.
Four other products of dechlorination (two dihydroCLD, one trihydroCLD and one tetrahydroCLD) were observed in the treated plots. They could not be quantified in mg/kg given the absence of analytical standards, but the relative peak area provided a semi-quantitative descriptor. TetrahydroCLD appeared only in the coarse ZVI plot P1, which ranked second only to P5 for the trihydroCLD. For the two dihydroCLD, the highest values were again observed in P1 and P5, together with P4 for the 5,6- or 5a-hydroCLD.
1 2 3 4 5 6 7 8 9 10 11 12 13 14 15 16 17 18 19 20 21 22 23 24 25 26 27 28 29 30 31 32 33 34 35 36 37 38 39 40 41 42 43 44 45 46 47 48 49 50 51 52 53 54 55 56 57 58 59 60