AERODYNAMICS OF A
FAN BYPASS DUCT SYSTEM
by
KEITH R. DALBEY
B.S., Aesospace Engineering
University at Buffalo, 1998
Submitted to the Department of Aeronautics and Astronautics
in partial fulfillment of the requirements for the degree of
Master of Science
in Aeronautics and Astronautics
at the
MASSACHUSETTS INSTITUTE OF TECHNOLOGY
June 2001
©
2001 Massachusetts Institute of Technology
All rights reserved
MASSACHUSETTS NSTITUTE
OF TECHNOLOGY
SEP 11R
LIBRARIES
Department oifAeronautics and Astronautics
May 25, 2001
eVO
Certified by.
Choon S. Tan, Ph.D.
Senior Research Engineer
Thesis Supervisor
Accepted by...
Wallace E. Vander Velde, Sc.D.
Author
AERODYNAMICS OF A
FAN BYPASS DUCT SYSTEM
by
KEITH R. DALBEY
Submitted to the Department of Aeronautics and Astronautics on May 25, 2001, in partial fulfillment of the
requirements for the degree of Master of Science
in Aeronautics and Astronautics
Abstract
Two problems of interest to the operation and design of turbofan engines are exam-ined. The first is inlet-fan interaction and its effect on flow separation in the inlet due to high angle-of-attack or cross wind. The second is the response of a fan bypass duct system to core engine surge.
These two problems have been examined using an approach that consists of body force representation of fan, fan-exit-guide-vane, and core compressor. The blade free regions are described by the Navier-Stokes equation for the first problem and the Euler equation for the second problem.
Computed results for the inlet-fan system yield a variation in angle-of-attack at which flow separation occurs in the inlet that is in agreement with experimental results. They also show that the presence of the fan increases the angle-of-attack at which separation occurs by about 3" over that computed in flow-through simulations. These computed trends are in accord with experimental observations. The implication of both experimental and computed results is that the interaction between inlet flow and the fan is beneficial and therefore an aggressive approach to the design of fan bypass duct systems can be considered.
The same methodology was applied to calculate the flow response in a bypass duct to core compressor surge. Preliminary results appear to illustrate its utility in such a flow situation.
PREFACE
This research was supported by a NASA-Glenn' grant (NAG3-2078, John Rhode, Technical Monitor) and funds from the Department of Defense NDSEG fellowship program.
The author would like to acknowledge the contributions made by Pratt and Whitney in East Hartford, Connecticut and by the following research engineers at Boeing in Seattle, Washington: Brian Hsaio, Matt Naimi, and Jeffrey Lewis.
Appreciation is expressed to Yifang Gong, Ph.D. whose previous work laid the foun-dation for this project. Special acknowledgment is given to Dr. Choon Tan, Thesis Supervisor, for his excellent guidance and support; it was truly a privilege to work under him.
Contents
1 INTRODUCTION
1.1 BACKGROUND ...
1.2 REVIEW OF PREVIOUS WORK ...
1.2.1 EFFECT OF FAN ON INLET SEPARATION ...
1.2.2 RESPONSE OF FAN DUCT SYSTEM TO CORE
EN2GINE SURGE ... 1.3 TECHNICAL OBJECTIVES ...
1.3.1 EFFECT OF FAN ON INLET SEPARATION ... 1.3.2 RESPONSE OF FAN DUCT SYSTEM TO CORE
ENGINE SURGE ... 1.4 CONTRIBUTION OF THESIS ... 1.5 ORGANIZATION OF THESIS ...
2 TECHNICAL APPROACH
2.1 MODELING THE BULK INFLUENCE
FLOW IN A BLADE FREE REGION
2.2 GOVERNING EQUATIONS ...
2.3 BODY FORCE FORMULATION FOR PRESENT APPLICATION ... 12 12 13 13 20 20 20 21 21 22 23 OF FAN/COMPRESSOR ON . . . . 23 . . . . 26 . . . . 27 2.4 IMPLEMENTATION ... 28
2.4.2 DETERMINATION OF BODY FORCE ... 31
2.4.3 BODY FORCE COEFFICIENTS Kn AND K. ... 31
2.5 EXAMPLES OF APPLICATION ... 32
2.5.1 NASA 22" RIG ... 32
2.5.2 GENERATION OF BODY FORCE COEFFICIENTS .... 33
2.5.3 COMPUTATION WITH ACTUATOR-DUCT ... 34
2.6 FORMULATING A BODY FORCE REPRESENTATION FOR THE CORE COMPRESSOR ... ... 39
2.7 CHAPTER SUMMARY ... . 40
3 AERODYNAMICS OF AN INLET-FAN SYSTEM 42 3.1 INTRODUCTION ... 42
3.2 ACTUATOR-DUCT VS. FLOW-THROUGH SIMULATION ... .. 44
3.2.1 EFFECT OF INLET ANGLE-OF-ATTACK VARIATION ON PEAK-TO-PEAK TOTAL PRESSURE DEFICIT ... 44
3.2.2 ANGLE-OF-ATTACK AT WHICH BOUNDARY LAYER SEPARATES IN INLET ... 44
3.2.3 LOCATION OF BOUNDARY LAYER RE-ATTACHMENT ... 47
3.3 ACTUATOR-DUCT VS. EXPERIMENT COMPARISONS ... 48
3.3.1 VARIATION IN ANGLE-OF-ATTACK WITH FLOW SEPARATION VS. CHANGE IN FAN SPEED ... 48
3.3.2 PEAK-TO-PEAK TOTAL PRESSURE DEFICIT AS A FUNCTION OF FAN SPEED AND ANGLE-OF-ATTACK 50 3.4 CHAPTER SUMMARY ... . 51
4 AERODYNAMICS OF A FAN BYPASS DUCT SYSTEM 4.1 INTRODUCTION ...
4.2 COMPRESSOR INSTABILITY ... 4.3 CORE COMPRESSOR SURGE ...
4.4 CANDIDATES FOR KEY FLOW PHENOMENA ...
4.5 RESULTS AND DISCUSSION ... 4.6 CHAPTER SUMMARY ...
5 SUMMARY
5.1 RESEARCH CONTRIBUTIONS ... 5.2 IMPLICATIONS OF RESEARCH ...
5.3 RECOMMENDATION FOR FUTURE STUDY ... A NOMENCLATURE
B THE ACTUATOR-DUCT MODEL
B.1 CENTRAL TENETS OF THE MODEL . . . .
B.2 ISOLATION OF FLOW IN ADJACENT BLADE PASSAGES ...
B.3 THE BODY FORCE FORMULATION ...
B.3.1 DERIVATION OF THE BASIC FORMULATION ....
C MODIFICATIONS TO THE BODY FORCE FORMULATION
68
. . 70
71
C.1 THE NORMAL FORCE ...
C.1.1 GENERALIZED FOR THREE-DIMENSIONAL
BLA D ES . . . . C.1.2 ACCOUNTING FOR BLADE CURVATURE SEPARATELY C.2 THE PARALLEL OR VISCOUS FORCE ...
D CAPABILITIES OF THE FORMULATION
52 . . . . 52 52 53 55 55 56 63 63 64 65 66 67 67 73 73 73 74 77 79
List of Figures
1-1 A fan bypass duct system in which the fan, fan-exit-guide-vane (fegv), and core compressor are replaced by regions of body force distribution that reflect their bulk influence on the flow. . . . . 13 1-2 A flow-through nacelle system with no turbomachinery components in
the fan bypass duct or in the core compressor. . . . . 14 1-3 Flow-through experiment total pressure recovery map, measured at 24'
angle-of-attack [12]. . . . . 15 1-4 Powered fan experiment total pressure recovery map, measured at 24'
angle-of-attack. No contours are shown since they are plotted at every 5% of Pt less than 100% [12]. . . . . 15
Ptoo
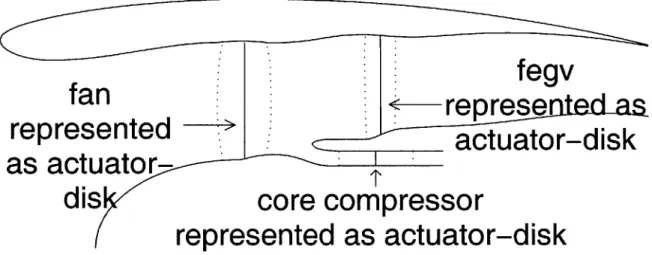
1-5 A fan bypass duct system in which the fan, fan-exit-guide-vane (fegv), and core compressor are replaced by actuator-disks across which flow properties are changed discontinuously. . . . . 18
2-1 A grid representative of the ones that calculations, in which the core compressor was surged, were performed on. . . . . 30 2-2 Fan duct system boundary conditions. . . . . 30 2-3 Comparison of fan-exit-guide-vane trailing edge Pt, Tt, and swirl
pro-files as computed by actuator-duct and CFD using fan-2 fegv geometry. Fan speed was 824 rad/sec. R1 = r - rhub; R2 = rcasing - rhub [7]. . . 35
2-4 Comparison of nozzle exit Pt, Tt, and swirl profiles as computed by actuator-duct and CFD using fan-2 fegv geometry. Fan speed was 824 rad/sec. R1 = r - rhub; R2 = rcasing - rhub [7]. . . . . 36 2-5 Comparison of mass averaged fan-exit-guide-vane trailing edge to
sta-tion 12.5 (see Figure 3-1) total pressure ratio as a funcsta-tion of fan-nozzle exit to free stream total pressure ratio for fan-i fegv configuration [7]. 38 2-6 Comparison of mass averaged fan-exit-guide-vane trailing edge to
sta-tion 12.5 (see Figure 3-1) total pressure ratio as a funcsta-tion of fan-nozzle exit to free stream total pressure ratio for fan-2 fegv configuration [7]. 38 2-7 Specified core compressor pressure characteristic. . . . . 40
3-1 Actuator-duct model with the locations where measurements were taken, stations 2 and 12.5 [7]. . . . . 43 3-2 Computed peak-to-peak total pressure deficit at station 2. "Powered
nacelle" refers to calculations with actuator-duct representation of the fan [7]. . . . . 45 3-3 Velocity vectors on a radial-axial plane illustrate the existence of flow
separation in the inlet at 32" angle-of-attack in the flow-through nacelle [7]. . . . . 4 6 3-4 Velocity vector on a radial-axial plane illustrates the absence of
separa-tion in inlet at 324 angle-of-attack in powered nacelle (actuator-duct) simulation; compare with results in Figure 3-3 [7]. . . . . 46 3-5 Velocity vectors on radial-axial plane indicate the location of flow
sepa-ration followed by re-attachment in the inlet-fan system with the pow-ered nacelle at 350 angle-of-attack [7]. . . . . 47 3-6 Velocity vectors in radial-axial plane indicate the location of flow
sep-aration followed by re-attachment in the flow-through system at 350 angle-of-attack; compare with results in Figure 3-5 [7]. . . . . 48
3-7 Angle-of-attack (at which flow separation is observed to occur in the inlet) vs. fan speed for actuator-duct and powered nacelle experiment [7]. . . . . 4 9 3-8 Comparison of peak-to-peak total pressure deficit at station 2 from
experiment with those from actuator-duct calculation/simulation [7]. 50
4-1 Core compressor surge cycle for B = 1.464. The corrected mass flow has been normalized by the value corresponding to the peak of the pressure cparacteristic. The three locations numbered (1), (2), and (3) mark the core conditions at the times the information in Figures 4-6, 4-7, and 4-8, respectively, were plotted. . . . . 54
F
4-2 Normal force coefficient, C, = , for the fan over one 2P fan tip
surge cycle. . . . . 57 4-3 Fan corrected mass flow, mcor, normalized by the fan's value of mrcor
at design point. . . . . 57 F
4-4 Normal force coefficient, C = , for the fegv over one 2P r) f an tip
surge cycle. . . . . 58 4-5 Fan-exit-guide-vane corrected mass flow, mcor, normalized by the fegv's
value of mcor at design point. . . . . 58 4-6 (A) Velocity vectors (B) static pressure contours in a radial-axial plane
at a time about 0.1 of a surge period after the start of the surge cycle. 59 4-7 (A) Velocity vectors (B) static pressure contours in a radial-axial plane
at a time about 0.3 of a surge period after the start of the surge cycle. 60 4-8 (A) Velocity vectors (B) static pressure contours in a radial-axial plane
4-9 Static pressure on the tip casing minus its time averaged (over 1 surge cycle) value. The raised ridge crossed when advancing in time is a pressure wave that originates within the core when the compressor passes the stall/surge inception point and experiences a loss in total pressure capability. . . . . 62
B-1 A correction term is added to the normal force to account for use of axisymmetric momentum equations [5]. . . . . 69 B-2 The r and directions are defined to be parallel and normal to the
channel walls [5]. . . . . 71
C-1 Derivation of the portion of normal force due to curvature. . . . . 75 D-i Far-reaching implications of the body force formulation. . . . . 82
List of Tables
1.1 Comparison of actuator-duct to other simulations of fan for study of fan's effect on inlet separation. . . . . 19
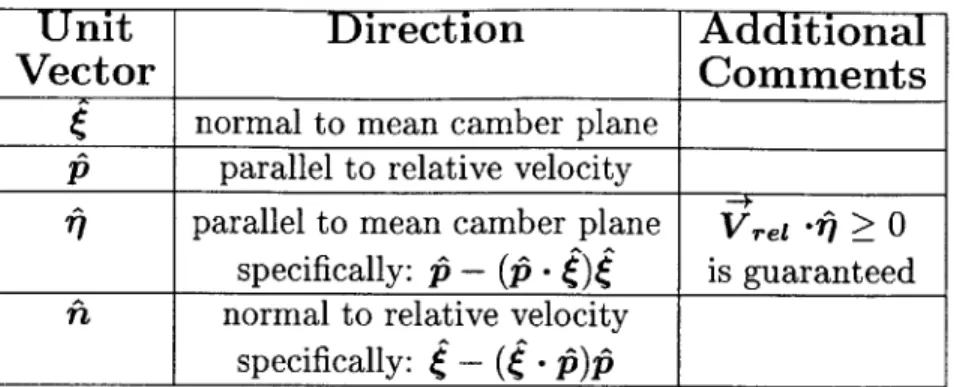
2.1 Blade row modeling of physical effects in discrete blade row . . . . 25 2.2 Direction of unit vectors used in body force formulation. . . . . 28
Chapter 1
INTRODUCTION
1.1
BACKGROUND
Two related problems of interest in aircraft propulsion systems are:
1. The inlet-fan flow interaction and its impact on inlet flow separation due to high angle-of-attack or cross wind.
2. The response of a fan bypass duct (the fan and fan-exit-guide-vane) to core engine surge.
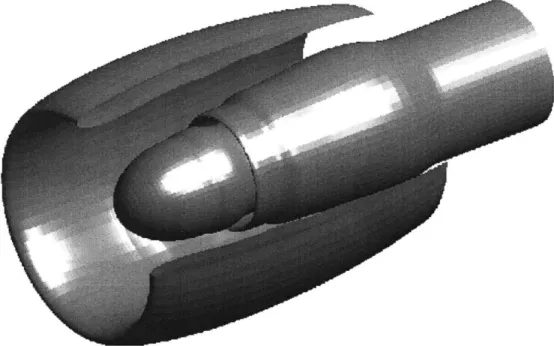
The common theme that threaded through these two problems is the representation of blade rows with finite regions of distributed body force that respond to local flow conditions. The representation of the blade rows by a finite region of body force
(Figure 1-1) has also been referred to as the actuator-duct model [5].
The action of a blade row in the flow field gives rise to flow turning (change in the tangential velocity component across the blade row), pressure rise, and energy exchange. In physical terms, these effects can be achieved by replacing the blade rows with a continuous body force. The equivalent body force representation can be arrived
key to such representation is the ability to characterize the body force in terms of the blade row fluid dynamics. A state-of-the-art Computational Fluid Dynamics (CFD) tool can be used to establish the blade row performance characteristics from which a
consistent body force representation can be developed for a blade row. Within this framework, the CFD tool is used to compute the flow field between the blade rows represented as body force distribution, or between the fan, fan-exit-guide-vane (fegv), and the core compressor as in the situation involving the core compressor.
fan
<
fegv
core compressor
Figure 1-1: A fan bypass duct system in which the fan, fan-exit-guide-vane (fegv), and core compressor are replaced by regions of body force distribution that reflect their bulk influence on the flow.
1.2
REVIEW OF PREVIOUS WORK
1.2.1
EFFECT OF FAN ON INLET SEPARATION
Experimental Flow-Through Simulation of Fan
In the past, the first problem, that of determining the angle-of-attack at which in-let separation occurred, was studied by using an experimentally implemented flow-through method [12]. It consisted of:
e Removing turbomachinery components from a nacelle
" Setting the back pressure to obtain the correct mass flow at 00 angle of attack " Setting the nacelle to the desired angle-of-attack
Figure 1-2 shows that the flow-through nacelle includes the center body. It does not include the fan, fan-exit-guide-vane (fegv), or core compressor.
Figure 1-2: A flow-through nacelle system with no turbomachinery components in the fan bypass duct or in the core compressor.
Larkin and Schweiger [12] performed experiments using a flow-through nacelle and a powered test rig with a fan. They found that the presence of the fan increased the maximum separation free angle-of-attack by 3" to 40 over that for the flow-through situation.
Figure 1-3: Flow-through experiment total pressure recovery map, measured at 24' angle-of-attack [12].
Figure 1-4: Powered fan experiment total pressure recovery map, measured at 240 angle-of-attack. No contours are shown since they are plotted at every 5% of pL
Ptoo less than 100% [12].
They also found that the flow-through method has another short coming. It does not reproduce the distortion patterns seen at the fan face in the powered rig. Figures 1-3 and 1-4 are total pressure recovery maps taken from Larkin and Schweiger [12]. The measurements in Figure 1-3 are from a flow-through nacelle at 240 angle-of-attack. Figure 1-4 displays measurements from a powered rig with a fan and was measured at the same angle-of-attack. These are illustrative of the mitigating effect of the fan's presence on flow separation off the inlet at high angles-of-attack.
Because of the flow-through method's limitations, a number of improvements or al-ternative approaches have been tried. Larkin and Schweiger explored the addition of blockage, in the form of screens and rods, to the flow-through nacelle in order to redistribute the flow. The blockage was placed at the location where the fan face would be, had it not been removed.
They found the following two positive results:
* With a proper combination of screen and rods, the flow-through method is capable of duplicating the powered-fan separation angle-of-attack.
9 Although the separated flow total pressure deficit was greater for the flow-through method with blockage added than for the powered fan, the circumfer-ential width of the region of total pressure deficit was similar.
However, even with the use of screens, the flow-through method is somewhat lacking. Larkin and Schweiger found the proper arrangement of screens and rods, post facto, and they acknowledged this deficiency. They "recommended that a fan simulation design method for total pressure pattern simulation be developed" [12]. Thus there is a need for an adequate methodology to account for the influence of fan on the inlet
Numerical Flow-Through Simulation of Fan
As computational resources increased, numerical flow-through simulations came into use. In 1993, lek et al [8] performed numerical flow-through simulations similar to Larkin's and Schweiger's experiments to determine the effect of adding blockage, with similar results.
In the end, numerical implementations of the flow-through method have the same limitations as experiments:
" Without the proper blockage, the flow-through method significantly under pre-dicts the separation angle-of-attack because the interaction between the fan and inlet separation is not captured.
" Even with the proper blockage, the flow-through method over predicts the magnitude of the total pressure deficit.
* Existing methods of determining the proper blockage are post facto, and as such they are not suitable for predictive use.
Actuator-Disk Representation of Fan
Bush [1] and Joo and Hynes [10] used an actuator-disk representation of the fan to capture fan and inlet flow interaction and to determine its effect on inlet separa-tion in a computasepara-tionally affordable manner. The actuator-disk model represents a blade row as a plane/disk (Figure 1-5) across which certain appropriate flow variables change discontinuosly to reflect the action of the blade row on the flow. While the work reported in [1] and [10] proved useful, there are situations where it is more
ap-propriate to use the actuator-duct representation of the blade row [7].
fegv
represented
re
actuator-disk
s
as
actuator-dis
core compressor
represented as actuator-disk
Figure 1-5: A fan bypass duct system in which the fan, fan-exit-guide-vane (fegv), and core compressor are replaced by actuator-disks across which flow properties are changed discontinuously.
Navier-Stokes Simulation of Fan
In principle, the Navier-Stokes equations can be solved within the entire blade row to capture the fan's interaction with inlet flow. However, this would be computationally more demanding. Besides the issues to be examined here do not warrant information on flow length scales on the blade-passage level.
Comparison of Actuator-Duct to Previous Fan Simulation Techniques In this thesis, the replacement of the fan, fan-exit-guide-vane, and compressor by an appropriate body force representation is used to account for their bulk influence on the flow in the inlet and the blade free regions between the turbomachinery components.
This approach is also known as the actuator-duct method. A comparison of the actuator-duct to other methods of representing the fan follows in Table 1.1.
Flow- Actuator- Actuator-
Navier-Through Disk Duct Stokes
Computationally yes yes yes no
affordable
Captures fan inlet no yes yes yes
flow interaction
Resolves blade passage no no no yes
flow field details I
Table 1.1: Comparison of actuator-duct to
effect on inlet separation.
other simulations of fan for study of fan's
From the table it can be seen that, for studying the effect of the fan on inlet separation, actuator-duct representation of the fan compares favorably to:
" flow-through representation because it captures the fan inlet flow interaction, in-cluding the change in swirl across the blade row, while the flow-through method does not.
" Navier-Stokes simulation of the fan. This is because actuator-duct is computa-tionally affordable and Navier-Stokes simulation is not.
While it is true that Navier-Stokes simulation of the fan has the "advantage" of pro-viding detailed information about the flow within the fan's blade passages and the actuator-duct does not, this information is not essential for determining the fan's bulk influence on the flow in the inlet for the first or second problem.
1.2.2
RESPONSE OF FAN DUCT SYSTEM TO CORE
EN2GINE SURGE
The second problem, that of the fan bypass duct's response to core engine surge, is of engineering interest. Of specific interest is the response of the flow and the associated pressure distribution changes in the fan bypass duct system due to core compressor surge. Some work has been done, for instance, an in-house study by Jeffrey P. Lewis [13] of Boeing Commercial Aircraft Company, but this topic remains largely unex-plored.
In this thesis, a framework is proposed that could enable the practical analysis of flow in the fan bypass duct in such a situation. Preliminary results from the calcula-tions/analysis using such a framework are presented for illustrative purpose.
1.3
TECHNICAL OBJECTIVES
1.3.1
EFFECT OF FAN ON INLET SEPARATION
The objective is to assess the utility of the actuator-duct model of the fan/compressor for determining the effect of fan on inlet flow separation. This is illustrated by com-paring the:
* effect of fan on inlet separation relative to the flow-through simulations
1.3.2
RESPONSE OF FAN DUCT SYSTEM TO CORE
ENGINE SURGE
The objectives are to:
1. Formulate a methodology that can potentially be used for simulating the re-sponse of fan duct flow to core engine surge.
2. Use (1) to quantify the change in pressure distribution in the fan duct system due to core engine surge and establish the cause and effects.
1.4
CONTRIBUTION OF THESIS
The following are contributions of this thesis:
1. A framework for simulating flow in an inlet-fan-duct system. This consists of representing the fan, fan-exit-guide-vane, and core compressor as finite regions of body force that appear as a source term to the flow equations (i.e. Navier-Stokes) governing the flow in the inlet.
2. Application of (1) to assess the impact of fan on inlet flow separation at high angle-of-attack or under cross wind.
3. Application of (1) to formulate a methodology for simulating the response of fan bypass duct flow field to core engine surge.
1.5
ORGANIZATION OF THESIS
This thesis is organized as follows. Chapter 2 describes the technical approach. It is followed by the application of the method to determine the effect of fan on inlet separation in Chapter 3. In Chapter 4, the formulation of a methodology framework for simulating fan duct system response to core engine surge is discussed. Chapter 5 contains the summary, conclusions, and a recommendation for future study.
Chapter 2
TECHNICAL APPROACH
2.1
MODELING THE BULK INFLUENCE OF
FAN/COMPRESSOR ON FLOW IN A BLADE
FREE REGION
As alluded to in Chapter 1, an approach is suggested that allows the effective analy-sis of flow in the inlet-fan-duct as an aerodynamic system. In essence, it would take advantage of modern CFD where it is appropriate to do so, and take advantage of modeling the response and dynamics of the component when it is expeditious to do so.
In this chapter, the proposed conceptual framework, including the implementation, is elaborated upon.
In addressing the flow in a subsonic inlet-fan-duct or inlet engine system, it is useful to characterize the flow variation on the following two length scales: (1) the blade pitch and (2) the scale through which the components interact. In general, the second one is much larger than the blade pitch.
The modeling of the response and dynamics of the component can be implemented through the use of modern CFD tools. For instance, the pressure rise characteristic and loss characteristic of a blade row (such as the fan and fan-exit-guide-vane) can be established through local calculations. This information can then be used to represent the component as a body force distribution in the analysis of the global aerodynamic
(the inlet-fan-duct-core engine) system analysis/simulation.
The flow field in the blade free regions can be described by the Navier-Stokes equation so that the presence of the fan and fan-exit-guide-vane then appears as a source term to the Navier-Stokes equation. The aerodynamic coupling among the components would perceive the presence of the blade (or a fan or a core compressor) as a region of continuous body force distribution (i.e. actuator-duct), rather than the detailed events in the individual blade passage. This is so because the interaction occurs on a length scale much larger than the spacing between the blades.
However, the effects of the blade passage event should be reflected in the representa-tion of the blade row by a continuous body force distriburepresenta-tion. Thus, in the analysis of the inlet-fan-duct-core-engine system, local calculations of components such as the fan and core compressor are implemented to establish physical information needed for representation as a body force distribution. This is then in turn used in the global aerodynamic system to assess the component interaction on its performance.
The proposed approach has the flexibility for analyzing the response of the inlet-fan-core-engine system to inlet/exit distortions as well as self-induced flow distortion. It can also be used to calculate the pressure forces acting on the inlet-fan-duct when the core engine surges.
In summary, the proposed approach consists of two levels of analysis/simulation :
1. Global inlet-fan-duct-core-engine system analysis. The fan, fan-exit-guide-vane, and core compressor are represented as a body force distribution appearing as a source term to the flow equations describing the flow through the system.
2. Local CFD calculation at the component level. This is used to establish information for use in the representation of the component as a body force rep-resentation.
The above description represents the overall approach to address the technical objec-tives and issues outlined in Chapter 1.
The use of body force to represent blade action is not a new concept. Smith [16] gave a review of prior work on this technique, together with a presentation of his efforts and findings on the subject. Other discussions on the development and use of body force can be found in Denton [2], Horlock and Marsh [6], Marble [14], and Gong [5].
The representation in body force terms of various physical effects in discrete blade row calculations is summarized in the table below.
Discrete Blade Row
Body Force Representation
(Navier-Stokes)
Blade thickness distribution Blockage distribution Blade surface frictional force Streamwise body force
Blade turning force Body force normal to streamwise direction
Viscous dissipation Heat source
2.2
GOVERNING EQUATIONS
The implication of the modeling framework presented in section 2.1 is that the num-ber of blades is assumed to be infinite. This approximation is valid since the length scale of the flow interaction considered here is much larger than the blade pitch. It is because of this implicit assumption that the flow at each circumferential position (i.e. in each infinitesimal blade passage) can be regarded as axisymmetric in a coordinate frame fixed to the blade row.
Thus the governing equations [5] for the blade row can be shown to be:
rpV, rpV2 + P rpVVo rpVV, rV,(pet + P)
a
rpV, rpVxV, rpVoV rpV2 + P rV(pet + P) 0 rpF, -pVV, + rpF pV + P + rpF, rp(F -V+ q) (2.1)where F,, F0, F, and 4 are the body force and of force or heat per unit mass.
heat source terms. They have units
When there are no other heat sources in the fluid, the blade force is the only energy transfer between the flow and outside environment. Under this condition, the work done by the rotor blade row equals the entire source term in the energy equation.
This source term can be expressed as:
F - V+ = For (2.2)
where Q is the blade row's rotational speed, and F is the body force in the circum-ferential direction.
( a+Q )
at 8o\ rp, rpV rpV rpVr rpet +OX2.3
BODY FORCE FORMULATION FOR
PRESENT APPLICATION
The body force formulation of a blade row can be derived in various ways depending on the intended application. For the two problems described in Chapter 1, the simple body force formulation proposed in [5] was utilized.
The force normal to the blade surface is considered to be associated with the pressure difference between the blade's suction and pressure sides. The force parallel to the blade surface is considered to correspond to the viscous shear.
Both the normal (F) and parallel (F,) components in the body force representation can be shown to depend on the local flow properties. Specifically, they can be written as:
On
= -Kn(A, M, Re) (Vrel 'Z7)(Vrel .g) Ah
(2.3) F,
=
-K,(A#, M, Re)where h is the width of the blade passage. in Table 2.2.
Vrel * Vrel
h P
Table 2.2: Direction of unit vectors used in body force formulation.
2.4
IMPLEMENTATION
2.4.1
SOLUTION PROCEDURE
The Effect of Fan-inlet Interaction on Inlet Flow Separation
Hsiao, Naimi, and Lewis [7] of Boeing Commercial Aircraft Company installed the actuator-duct logic in the WIND [18] CFD code. WIND is a Navier-Stokes code sup-ported by the NPARC Alliance, which consists mainly of the NASA Glenn Research Center, the Air Force Arnold Engineering Development Center, and Boeing. The body forces are implemented as source terms in the right hand side of the governing equations. The source terms derived from the body forces are active only within the blade region. To stabilize the solution, source relaxation factors were introduced in the transient stage [7].
Response of Fan Duct System to Core Engine Surge
The CFD code used was a version of UnsComp (UNSteady COMPressor) [5]; how-ever, it was modified to suit the applications considered here. UnsComp solves the
Unit
Direction
Additional
Vector
Comments
normal to mean camber plane
p5
parallel to relative velocityf7 parallel to mean camber plane Vre . ;> 0
specifically: p - (P-) is guaranteed
n
normal to relative velocitycompressible Euler equations. To do so, it employs a standard finite volume spatial discretization and five step Runge-Kutta time marching. Numerical viscosity is han-dled as befitting a Jameson type scheme [9].
The boundary conditions for these calculations are as follows:
* For forward flow, flow angle, total temperature and pressure were specified at the inlet. Static pressure was specified at the bypass duct's outlet and the throttle setting of the core compressor was specified as well (Figure 2-2).
* For reverse flow, static pressure is specified at the inlet; total temperature and pressure were specified at the plenum's throttle and the bypass duct's out-let. Axial flow was also specified at the bypass duct's exit (Figure 2-2).
Flow variables have been non-dimensionalized using the following:
L* =f rant T* = P* = p*RgasT* = p*V*2
LV* = rfanL*p*= to
V =QL* P PO
RgasTtoo
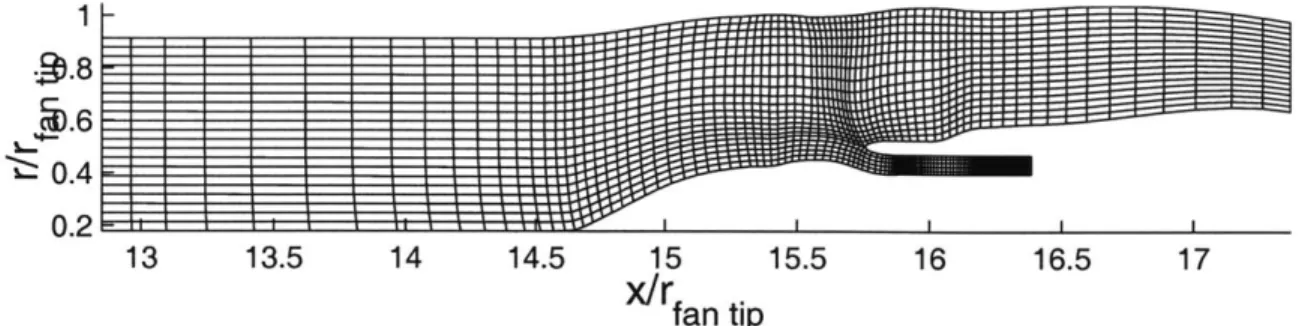
For illustration, a representative grid used in typical calculations involving core com-pressor surge is shown in Figure 2-1.
13 13.5 14 14.5 15 15.5 16 16.5 17 x/r fan tip 1-F
I
.60.2-Figure A grid representative of the ones that calculations, in which the core
compressor was surged, were performed on.
Forward Flow Boundary Conditions
14.5 15.5 16 16.5 17 17.5
Reverse Flow Boundary Conditions
14.5 15 15.5 16 16.5 17 17.5 x/L 2-1: 1.2 1 0.8 0.6 0.4 0.2 0 1.2 1 0.8 S0.6 0.4 0.2 0
2.4.2
DETERMINATION OF BODY FORCE
The inputs needed to enable the use of the body force equation in the solution pro-cedure are:
* blade camber
" blade passage width * local flow conditions
2.4.3
BODY FORCE COEFFICIENTS Kn AND K,
Both K and K, can be determined as follows. Back solving equation (2.3) for Kn and K, yields:
(Vrel -6)(Vel -2.4)
K - _
(F
-P) hVrei V rei
The information needed to determine the coefficients is then the blade camber, the blade spacing, velocity field, and the appropriate body force distribution within the blade passage (which can be determined directly from the flow field) for the fan/blade row at any operating point.
At a given operating point, the deviation angle, Mach number, and Reynolds number in an axisymmetric flow field vary with axial and radial position. This allows the determination of the coefficients as functions of x and r. Once these coefficients are known, it is assumed they can be applied at operating points other than one at which
they were determined.
It has been shown in [5] that such a simplistic approach is adequate for calculating the response of a high speed compressor stage to inlet distortion. Therefore, such an approach was adopted and the results to be presented in Chapters 3 and 4 will illustrate the applicability. It will be demonstrated through computed results, that the actuator-duct model used does indeed yield an adequate representation of the fan
and fan-exit-guide-vane for the applications considered here.
In the next section, we will present examples that involve the use of this framework to demonstrate its utility/applicability.
2.5
EXAMPLES OF APPLICATION
The following examples are taken from [7] to illustrate the utility of the approach described in this chapter.
2.5.1
NASA 22" RIG
The computed spanwise distribution of flow variables based on body force represen-tation of blade row, specifically NASA 22" rig [7] are contrasted against those from direct CFD calculations.
The NASA 22" rig periodic fan-exit-guide-vane (fegv) configuration calculations using an actuator-duct are presented in two sections:
* assessment of the actuator-duct logic in simulating flow turning and loss through the fan-exit-guide-vane
The predicted flow fields for the calculations that used the actuator-duct were com-pared with those from direct CFD calculation with fan-exit-guide-vane geometry.
2.5.2
GENERATION OF BODY FORCE COEFFICIENTS
In the current calculations, the fan-exit-guide-vane body force coefficients were gen-erated using the CFD computed flow field as presented in this chapter.
The procedure for generating body force coefficients from a CFD solution is a reverse process of determining body forces from equation (2.3). Using this procedure, body forces at each computational grid point within the blade region are calculated from a three dimensional flow field. An axisymmetric flow field is first generated from a three dimensional flow field by averaging the flow variables in the circumferential direction. The body forces are extracted from this circumferentially-averaged flow.
With these flow parameters and body forces, the body force coefficients at each com-putational grid point within the blade region can be obtained from equation (2.4) since the blade geometry is known. In these calculations, the fan-exit-guide-vane body force coefficients for fan-1 and fan-2 configurations were generated by CFD solutions at design operating conditions. These coefficients were applied to the cal-culations at other operating conditions [7].
2.5.3
COMPUTATION WITH ACTUATOR-DUCT
The computational mesh used for the 22" rig fegv configuration for the actuator-duct calculation has a total number of grid points around 0.3 million. The computational domain is wedge-shaped, with five grid points in the the pitch-wise direction. The complexity in grid generation was significantly reduced compared to the mesh used in the calculation with the fan-exit-guide-vane geometry. The number of grid points was also reduced so the calculation turn around time was decreased. The periodic boundary condition was specified on the first and last circumferential planes. The space near fan duct surfaces was finely gridded in order to resolve the boundary layer. Within the blade region, the Navier-Stokes equations were solved with body forces as source terms. Outside the blade region, the Navier-Stokes equations without body force terms were solved.
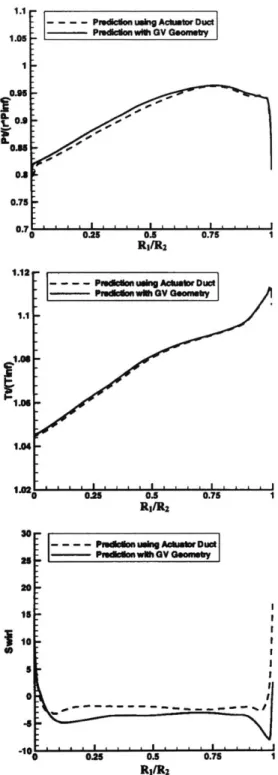
Total pressure (Pt), total temperature (Tt), and swirl profiles were specified at the duct inflow planes. Figures 2-3 and 2-4 show the comparisons of total pressure, total temperature, and swirl angle profiles between actuator-duct and CFD computations. The agreement of total pressure and total temperature is quite good at the fan-exit-guide-vane trailing edge as shown in Figure 2-3.
The computed swirl angle using the actuator-duct is slightly lower than the CFD computation with the actual fan-exit-guide-vane geometry by an average of 20 to 3". At the fan nozzle exit, there are discrepancies between total pressure and total temperature profiles computed in actuator-duct and the fan-exit-guide-vane geome-try calculations, as shown in Figure 2-4. The total pressure and total temperature profiles from the fan-exit-guide-vane geometry show the effect of secondary flow and wake mixing due to the presence of the guide vane. Those flow details can not be
1.1 1.05 1 0.95 0.8 0.75 0.7
--- - - PIdcion using Actustor Duct Pmdelcon wUie GV Geommny
.1 .1 I . I
0.25 0.5
R:/R2
0.75 i
|---
- - P donf uMig Actuator Duct--- PMedcmOnwm GV Geomesy
R/R2
Figure 2-3: Comparison of fan-exit-guide-vane trailing edge Pt, Tt, and swirl profiles as computed by actuator-duct and CFD using fan-2 fegv geometry. Fan speed was 824 rad/sec. R1 = r - rhub; R2 = rcasing - rhub [7].
1.1 0.95 0.9 1.08 1.08 3 0 -25 20 151. 10 5 0 -5 Figure 2-4: actuator-duct 0 0.25 0.5 RI/Ra 0.75 i
Comparison of nozzle exit Pt, Tt, and swirl profiles as computed by and CFD using fan-2 fegv geometry. Fan speed was 824 rad/sec. R1 =
r - rhub; R2 = reasing - rhub
[71.
- - P Pli A ouskg ActamirDuct
--- Precionnw~ GV GeomebyV
study are circumferentially uniform.
In addition to the total pressure, total temperature, and swirl profiles, the mass-averaged total pressures and total temperatures were also compared between the actuator-duct and fan-exit-guide-vane geometry results. Figures 2-5 and 2-6 show the comparisons of the mass averaged total pressure at the fan-exit-guide-vane trail-ing edge and fan nozzle exit. Between the inflow plane and the fan-exit-guide-vane trailing edge, the actuator-duct predicted an average loss 0.2% higher than the
fan-exit-guide-vane geometry computed results for the fan-1 configuration.
For fan-2, the agreement is very good at the fan-exit-guide-vane trailing edge. Be-tween the fan-exit-guide-vane trailing edge and the fan nozzle exit, the actuator-duct model computed total pressure losses were lower than those from fan-exit-guide-vane geometry calculations for both configurations. This is because the loss due to sec-ondary flow and wake mixing was not resolved using the actuator-duct. The com-puted total pressure loss between the fan-exit-guide-vane trailing edge and nozzle exit is higher for fan-2. This is probably because the fan-2 configuration has more guide vanes than the fan-1 configuration and therefore the loss due to the mixing is higher. For total temperature, computed results from both, using the fan-exit-guide-vane ge-ometry and actuator-duct, show no changes between the inflow plane and the fan duct exit [7].
-0-- - PedcionhwllGV,atGVbtalng edge1
-0- - ADpmI, atGVragedge -5-- PmIccilon wiNt GV, at nozzle exit
-- AD Piediction, at nozzle exit
Ek ~
E3
C)-1.3 1.325 1.35
Figure 2-5: Comparison of mass averaged fan-exit-guide-vane trailing edge to station 12.5 (see Figure 3-1) total pressure ratio as a function of fan-nozzle exit to free stream total pressure ratio for fan-i fegv configuration [7].
I
10.995
0.99
- - -- PdeiNOn wiN OV, at GV tranng edge
.- -0- - ADpueison,atGVralngedge
.- * - Plremclon wlth GV, at nozzle exit
- -- AD Pmedldn at zl ei
-3
1.225 1.25 1.275 1.3 1.325
FNPR 1.35
Figure 2-6: Comparison of mass averaged fan-exit-guide-vane trailing edge to station 12.5 (see Figure 3-1) total pressure ratio as a function of fan-nozzle exit to free stream total pressure ratio for fan-2 fegv configuration [7].
1.005 04 1 C 10.995 A. 0.99 1.2 1.225 1.25 1.275 FNPR -n '. . I . . . . I . . . .I . .
2.6
FORMULATING A BODY FORCE
REPRESENTATION FOR THE CORE
COMPRESSOR
Here a total pressure characteristic was assumed, see Figure 2-7. The core compres-sor was further assumed to have no additional losses, and to be quasi-steady and quasi-one-dimensional. The body force applied had two components: one for flow turning and the other was an axial body force responsible for doing work on the flow. Its formulation is derived simply from the steady state ID conservation of energy equation and it is given as:
FxAx = CpAT
FxAx = CpTt,(T - 1)
F2
-
(2.5)
3,5 3
Core Compressor (bladerow 3) Pressure Charaicteristc
Z5 f 2 M' 1 5 1 o5[ 0 0.5 I 1.5 2
Figure 2-7: Specified core compressor pressure characteristic.
2.7
CHAPTER SUMMARY
In this chapter, a framework was suggested that allows the effective analysis of flow in the inlet-fan-duct as an aerodynamic system. It takes advantage of modern CFD tools where it is appropriate to do so and of modeling the response and dynamics of the components when it is expeditious to do so.
Local CFD calculations (or experiments) were implemented to determine the pres-sure rise and loss characteristics of the blade row. This information was then used to
.. .... ...
---0 '
actuator-duct representation) in the system level aerodynamic analysis.
The body force formulation, its implementation, and its inclusion into the governing equations were discussed. In addition, examples were given to illustrate the utility of the approach and its adequacy for the applications considered here: namely fan-inlet flow interaction and the response of the fan duct system to core compressor surge.
Chapter 3
AERODYNAMICS OF AN
INLET-FAN SYSTEM
3.1
INTRODUCTION
In this chapter, calculations that have been performed by the Boeing Commercial Airplane Company (Hsiao, Naimi, and Lewis) as reported in [7] will be used to illus-trate the utility of the approach described in Chapter 2 for analyzing the influence the fan has on flow separation within an inlet. They calculated the flow in the inlet with and without the fan and fan-exit-guide-vane downstream. The CFD package used for implementing these calculations is the WIND code [18] in which body force source terms representing the presence of the fan and fan-exit-guide-vane have been incorporated.
The conclusions to be presented are based on comparisons between different sets of computed results and between computed results and available experimental measure-ments. One set of computed results was from a fan bypass duct system in which both the fan and fan-exit-guide-vane were represented as finite regions of body force. For
against results from flow-through simulations and experimental measurements. In the figure below, most of the "measurements" whether from experiments or compu-tations, were taken at stations 2 and 12.5.
Rotor Zone
Stator Zone
Station 2
Figure 3-1: Actuator-duct model with the locations where measurements were taken, stations 2 and 12.5 [7].
3.2
ACTUATOR-DUCT VS. FLOW-THROUGH
SIMULATION
3.2.1
EFFECT OF INLET ANGLE-OF-ATTACK
VARIATION ON PEAK-TO-PEAK TOTAL
PRESSURE DEFICIT
Figure 3-2 shows the variation in the peak-to-peak total pressures deficit at station 2 with the angle-of-attack as computed from actuator-duct and flow-through sim-ulations. The figure shows that the peak-to-peak total pressure deficit, defined as
Tmax-P is
is greater for the flow-through method than for the actuator-duct.
PToo
This trend is in accord with the results found by Larkin and Schweiger [12]. See Figures 1-3 and 1-4. It can be deduced from this that the presence of the fan would tend to increase the separation free angle-of-attack over that of the flow-through sit-uation. The implication is the interaction between inlet flow and the fan is beneficial and therefore an aggressive approach to the design of fan bypass duct systems can be contemplated.
3.2.2
ANGLE-OF-ATTACK AT WHICH BOUNDARY
LAYER SEPARATES IN INLET
Figures 3-3 and 3-4 are velocity vector plots for the flow-through and actuator-duct simulations respectively. These cases were run with the nacelle at 32* angle-of-attack. Note that in the magnified region in the flow-through case, the flow has separated. It re-attached slightly downstream (not magnified). For the actuator-duct simulation, no magnified region is shown because the flow did not separate at this angle-of-attack.
1-
--- P owered-nacelle -- --- Flow-through model 0,25 0,2 E] 15 r-I7 4 8 12 16 20 24 28 32 36 40 Angle-of-AttackFigure 3-2: Computed peak-to-peak total pressure deficit at station 2. "Powered nacelle" refers to calculations with actuator-duct representation of the fan [7].
In the actuator-duct simulation, the fan's presence kept the boundary layer from separating until the angle-of-attack was a few degrees higher, at 354. This can be seen in Figure 3-5. The difference in angle-of-attack at which the boundary layer separated between the actuator-duct and flow-through simulation is again in accord with the measurements reported by Larkin and Schweiger [12]. Their measurements showed that the corresponding difference in angle-of-attack at which separation occurs
is 30 to 40. 0.3 0. I
I
0.1 0 051 0 0lIVI
IWtr
I
I
Figure 3-3: Velocity vectors on a radial-axial plane illustrate the existence of flow separation in the inlet at 320 angle-of-attack in the flow-through nacelle [7].
Rotor leading edge
No Separation
sepa-eparaton Reattachment:
oint point
Rotor leading edge
iiItil
1
P1
~
II
I
I
r
I
I
UT
I
V
Figure 3-5: Velocity vectors on radial-axial plane indicate the location of flow sepa-ration followed by re-attachment in the inlet-fan system with the powered nacelle at
350 angle-of-attack [7].
3.2.3
LOCATION OF BOUNDARY LAYER
RE-ATTACHMENT
Figure 3-5 shows that in the actuator-duct simulation the boundary layer re-attaches upstream of the fan's leading edge. At the same angle-of-attack, the flow re-attaches farther downstream (within the blade row) for the flow-through simulation. This can be seen in Figure 3-6. This again demonstrates the influence the fan has on the behavior of the boundary layer in the inlet.
SRuattachment
Rotor Iead
4 iiiiif i
Ing edge
Figure 3-6: Velocity vectors in radial-axial plane indicate the location of flow sep-aration followed by re-attachment in the flow-through system at 350 angle-of-attack; compare with results in Figure 3-5 [7].
3.3
ACTUATOR-DUCT VS. EXPERIMENT
COMPARISONS
3.3.1
VARIATION IN ANGLE-OF-ATTACK WITH FLOW
SEPARATION VS. CHANGE IN FAN SPEED
Figure 3-7 shows the value of angle-of-attack at which separation occurs in the inlet for three different fan speeds: 8740, 7740, and 5010 rpm (915, 811, and 525 rad/sec respectively.) While the angle-of-attack computed from the actuator-duct model was 2" to 3" higher than the experiment, the computed trend is in agreement with the
experimental measurements. O Predictont O3 Measure me at
0
0
00
0 5000 6000 7000 RPM I... .1 8000 9000 10000Figure 3-7: Angle-of-attack (at which flow separation is observed to occur in the inlet) vs. fan speed for actuator-duct and powered nacelle experiment [7].
This observed difference of about 20 to 30 in the angle-of-attack between the powered nacelle experiment and actuator-duct simulation is also found in the comparison be-tween experimental and numerical values of angle-of-attack (at which flow separation is observed in the inlet) from the flow-through model. Thus it can be inferred that the observed difference is a systematic difference between the two sets of data and that the effect elucidated in Figure 3-7 can be attributed to the presence of the fan.
38 37 36 35 34 d) 4a 33 32 31 30 29 4U00 I I I I I I
3.3.2
PEAK-TO-PEAK TOTAL PRESSURE DEFICIT AS
A FUNCTION OF FAN SPEED AND
ANGLE-OF-ATTACK
Figure 3-8 shows the variation of the computed and measured peak-to-peak total pressure deficit with angle-of-attack for the same three speeds as used for the results in Figure 3-7. In general, the agreement between the measured and computed values are good up to the value of angle-of-attack at which the inlet flow is observed to separate. 0.3 - -Q- - 8740 RPM, Predlction - -0- - 7740 RPM, Prdlctlion 5-
--2- - 5010 RPM, Predictlion S 740 RPM, Test Data 7740 RPM, Test Data A 6010 RPMITestdata 0.15 0,0. 01 0 4 8 12 16 20 24 28 32 36 40 An e-of-AtackFigure 3-8: Comparison of peak-to-peak total pressure deficit at station 2 from experiment with those from actuator-duct calculation/simulation [7].
3.4
CHAPTER SUMMARY
It can be inferred from the results presented in this chapter that the use of an actuator-duct representation of the fan provides a practical and adequate methodology for addressing fan-inlet aerodynamic coupling. In summary, the results are:
" In qualitative agreement with experiment. The computed values of angle-of-attack (at which flow separation occurs in the inlet) using the actuator-duct model is about 3' greater than the flow-through method. The uncertainty in the measurements (and calculations) is up to 1 less than the measured values. " The actuator-duct representation of the fan is shown to be adequate for
describ-ing fan-distortion interaction.
* The computed variation in the angle-of-attack at which flow separation occurs in the inlet as a function of fan speed is in agreement with that from experiments.
Chapter 4
AERODYNAMICS OF A FAN
BYPASS DUCT SYSTEM
4.1
INTRODUCTION
The results presented in this chapter are to be viewed as preliminary. The investiga-tion has not been carried out to the extent that permit one to establish the cause and effects of flow changes in the fan bypass duct system associated with core compressor surge. Therefore, this chapter will only demonstrate the applicability and utility of the framework introduced in Chapter 2.
4.2
COMPRESSOR INSTABILITY
When the flow in an axial compressor is throttled from the design point to the stall limit, aerodynamic instability ensues. This instability will take the form of either surge or rotating stall. Surge is a large amplitude oscillation of the annulus average flow through the compressor. In rotating stall, there are one to several cells of stalled flow rotating around the circumference while the total mass flow remains constant
a discriminator between surge and stall in defined as:
B = Qrtu, 2-yRgasT'
a compression system is the B-parameter,
Volpienum
V olcompressor (4.1)
For details, reference should be made to [3] [4]. Two values of B for the compression system are examined, 0.732 and 1.464. As the results are similar, only those for the value of B = 1.464 are presented.
4.3
CORE COMPRESSOR SURGE
The core compressor was surged by reducing the throttle from 0.4 to 0.23 times the exit area of the core. The change in throttle area was chosen to be approximately the minimum needed to induce surge in the B = 0.732 case. The pressure rise char-acteristic associated with a computed surge cycle is shown in Figure 4-1. For details on surge refer to [3] and [4].
core compressor surge cycle, B=1.464
3.5 - 3.-- 2.5- 2-1.5 1 0.5- 0--0.5 0 0.5 1 1.5 2m
cor
Figure 4-1: Core compressor surge cycle for B = 1.464. The corrected mass flow has been normalized by the value corresponding to the peak of the pressure characteristic. The three locations numbered (1), (2), and (3) mark the core conditions at the times the information in Figures 4-6, 4-7, and 4-8, respectively, were plotted.
4.4
CANDIDATES FOR KEY FLOW
PHENOM-ENA
There are three plausible phenomena that could be responsible for the observed puted change in pressure distribution within the fan duct system due to core com-pressor surge. These are:
" the change in mass flow with time over a surge cycle
" path of the hot gas associated with the reverse flow in the compressor
* the pressure wave originating from within the core compressor due to the oc-currence of surge
4.5
RESULTS AND DISCUSSION
In this section, preliminary computed results are presented to illustrate the plausible response in the fan bypass duct system due to core compressor surge. The response is measured in terms of the change in integrated value of the force normal to the blade (for both the fan and fan-exit-guide-vane) computed according to:
FnJ pF -n r dO dr dx (4.2) or on a non-dimensional basis, the normal force coefficient.
C= 1 * U2 ,, (4.3)
where Uti, is the fan blade tip speed, rti, is the fan tip radius, and p* =
R-RgasTtoo
The other flow quantity that was computed is the change in fan mass flow (as well as in the fan-exit-guide-vane) with time over a period of surge. For the situation of
compression system with a B value of 1.464, a set of representative (but preliminary) results are shown in Figures 4-2 and 4-3 for the fan and in Figures 4-4 and 4-5 for the fan-exit-guide-vane.
The computed result shown in Figure 4-2 and 4-3 indicates that over a surge cycle, the change in the normal force component acting on the fan can be as high as about 17% of dynamic head (based on fan tip speed) while the change in mass flow is about 10% of that of design. For the situation of the fan-exit-guide-vane, the computed change in the normal force component is only about 7.5% dynamic head (considerably less than that for the fan.) While the corresponding change in mass flow is only about 4% of that at design. Representative flow pattern and static pressure distributon in the fan bypass duct are shown in Figures 4-6, 4-7, and 4-8 and their corresponding operating points are denoted as (1), (2), and (3) in Figure 4-1. The computed pressure difference (i.e. a measure of the loading) on the tip casing is shown in Figure 4-9, and it can be as high as about 0.4 dynamic head.
4.6
CHAPTER SUMMARY
In this chapter, the framework introduced in Chapter 2 has been implemented for a representative fan duct system responding to core engine surge. Very preliminary results were presented with the purpose of illustrating the utility of the approach. While the computed results are to be viewed as preliminary, they do indicate that the pressure changes on the fan and tip casing can be of the order of two-fifths dynamic head based on the fan tip speed.
fan normal force coefficient, B=1.464
- - --- - - - design point ...- ... -...
time averaged over 1 surge cycle
- unsteady ----. - - . --- -- - - -- - - - -- - - -- - - -- - - - -- - - -- - -- -- -- - -- - - - - ---. --- -- ---- - - ---. - --- --- ---- -----.. . ---.. ..- =..: .=.: =. .:. ... ::: _ -= -. ... ..- : = _ -_- _ .. -.. --- _- -- - _-- _--_-I~~ . . . . . . . .. . . . .;.. ; - - . . . . .. . . .;.. ;.. 0 0.1 0.2 0.3 0.4 0.5 0.6 0.7 0.8 0.9 1
time in surge periods
Figure 4-2: surge cycle.
Normal force coefficient, Cn = F , for the
2 ( fan tip
fan over one
fan normalized corrected mass flow, B=1.464
0.98 0.96
Eo094
0.92 0.9 0 0.1 0.2 0.3 0.4 0.5 0.6 0.7 0.8 0.9 1time in surge periods
Figure 4-3: Fan corrected mass flow, mh,, normalized by the fan's value of rhco,. at design point.
.4
* 1.3
c 1.2 0

![Figure 1-3: Flow-through experiment total pressure recovery map, measured at 24' angle-of-attack [12].](https://thumb-eu.123doks.com/thumbv2/123doknet/13894983.447716/15.918.300.583.177.453/figure-flow-experiment-total-pressure-recovery-measured-attack.webp)

![Figure 2-5: Comparison of mass averaged fan-exit-guide-vane trailing edge to station 12.5 (see Figure 3-1) total pressure ratio as a function of fan-nozzle exit to free stream total pressure ratio for fan-i fegv configuration [7].](https://thumb-eu.123doks.com/thumbv2/123doknet/13894983.447716/38.918.284.578.183.442/figure-comparison-averaged-trailing-pressure-function-pressure-configuration.webp)
![Figure 3-1: Actuator-duct model with the locations where measurements were taken, stations 2 and 12.5 [7].](https://thumb-eu.123doks.com/thumbv2/123doknet/13894983.447716/43.918.126.768.259.764/figure-actuator-duct-model-locations-measurements-taken-stations.webp)
