HAL Id: hal-01965450
https://hal-amu.archives-ouvertes.fr/hal-01965450
Submitted on 26 Dec 2018
HAL is a multi-disciplinary open access
archive for the deposit and dissemination of sci-entific research documents, whether they are pub-lished or not. The documents may come from teaching and research institutions in France or abroad, or from public or private research centers.
L’archive ouverte pluridisciplinaire HAL, est destinée au dépôt et à la diffusion de documents scientifiques de niveau recherche, publiés ou non, émanant des établissements d’enseignement et de recherche français ou étrangers, des laboratoires publics ou privés.
Nonadiabatic dynamics simulations of photoexcited
urocanic acid
Deniz Tuna, Lasse Spörkel, Mario Barbatti, Walter Thiel
To cite this version:
Deniz Tuna, Lasse Spörkel, Mario Barbatti, Walter Thiel. Nonadiabatic dynamics simulations of photoexcited urocanic acid. Chemical Physics, Elsevier, 2018, 515, pp.521-534. �hal-01965450�
Summary
8/29/2018 1:55:32 AM
Differences exist between documents.
New Document:
ua-om2mrci-tsh-dynamics-R1
40 pages (6.88 MB) 8/29/2018 1:55:04 AM
Used to display results.
Old Document:
ua-om2mrci-tsh-dynamics
40 pages (6.88 MB) 8/29/2018 1:55:04 AM
Get started: first change is on page 1. No pages were deleted
How to read this report Highlight indicates a change.
Deleted indicates deleted content. indicates pages were changed. indicates pages were moved.
Nonadiabatic Dynamics Simulations of Photoexcited
Urocanic Acid
Deniz Tunaa,1,∗, Lasse Spörkela, Mario Barbattib, Walter Thiela
aMax-Planck-Institut für Kohlenforschung, 45470 Mülheim an der Ruhr, Germany bAix Marseille Univ, CNRS, ICR, Marseille, France
Abstract
Urocanic acid (UA) is a UV filter found in human skin, which has been linked to photoimmunosuppression and the formation of skin cancer. Its UV-light-induced photoisomerization and radiationless deactivation mecha-nisms have been addressed previously by static calculations. In this paper, we present nonadiabatic trajectory-surface-hopping dynamics simulations of photoexcited UA using the semiempirical OM2/MRCI methodology and an adaptive-timestep algorithm. We have simulated almost 6000 trajectories, each for a simulation time of 1.6 ps, covering the entire conformational space of the E and Z isomers of both possible tautomers of the isolated neutral form of UA (overall 32 conformers). Initial conditions for the excited-state dynamics were obtained from 1 ns ground-state dynamics simulations. We find that UA has an ultrashort excited-state lifetime, which is due to ultrafast radiationless excited-state deactivation driven by E↔Z photoisomerization and excited-state intramolecular proton-transfer (ESIPT) processes. The computed S1 excited-state lifetimes for the E and Z isomers of the N1H and N3H tautomers range from 271 to 506 fs. The photoisomerization quantum yield is calculated to be 43% (32%) for the combined E (Z) isomers of both tautomers. The shorter lifetime and the lower photoisomerization quantum yield of the Z isomers can be rationalized by the larger number of available excited-state deactivation processes: the Z isomers can undergo ESIPT and
∗Corresponding author
Email address: tuna@kofo.mpg.de (Deniz Tuna)
1Author’s current affiliations: Department of Chemistry and The PULSE Institute,
Stanford University, Stanford, California 94305, United States; SLAC National Accelerator Laboratory, Menlo Park, California 94025, United States
photoisomerization, whereas the E isomers can only deactivate via the latter process. The intramolecular hydrogen bond that is present in many Z con-formers can prevent successful photoisomerization to an E isomer. We find no evidence for an excitation-energy-dependent quantum yield for photoisomer-ization (EEDQY-PI) in isolated (E)-UA, which has previously been detected spectroscopically in aqueous solution. However, we do find an EEDQY-PI as well as a complementary excitation-energy-dependent quantum yield for ESIPT (EEDQY-ESIPT) for the N1H-Z isomers, which demonstrates the competition of the photoisomerization and ESIPT processes. The present comprehensive study lays the groundwork for future photodynamics simula-tions of UA in the aqueous phase.
Keywords:
UV photostability, UV filter, photoisomerization, excited state dynamics, excited state deactivation, nonadiabatic dynamics, trajectory surface hopping, conical intersection, semiempirical methods, quantum chemistry, excited state intramolecular proton transfer, ESIPT, photoisomerization quantum yield
Graphical abstract
1. Introduction
Urocanic acid (UA) is a naturally occurring UV chromophore. It is found in human skin, in the uppermost layer of the epidermis, the stratum corneum. The E isomer of UA is produced by the enzyme histidine ammonia-lyase act-ing on histidine. When (E)-UA absorbs UV light, it can undergo E→Z photoisomerization. This leads to a buildup of (Z)-UA in the upper lay-ers of skin. A few decades ago, UA was believed to act as a UV filter and
thus as a natural sunscreen, but later evidence suggested that the Z isomer can suppress the immune system and through a complex mechanism might even facilitate the onset of skin cancer.[1] Over the last few decades, UA has attracted multidisciplinary interest in the fields of photochemistry, photobiol-ogy, spectroscopy, immunolphotobiol-ogy, dermatolphotobiol-ogy, biochemistry and bacteriology. Three reviews on various aspects of UA[1, 2, 3] and a comment[4] summarize relevant aspects of this molecule. UA has recently been the focus of study in a multitude of scientific fields such as macromolecular chemistry, transition-metal chemistry, genetics, medicine and dermatology.[5, 6, 7, 8, 9, 10, 11, 12] Spectroscopic and kinetic studies on UA in aqueous solution are available in abundance.[13, 14, 15, 16, 17, 18, 19, 20, 21, 22, 23, 24, 25] Probably the most important result of these studies is the identification of a wavelength-dependent quantum yield for E→Z photoisomerization.[13, 17] In contrast, we are aware of only a single spectroscopic investigation on isolated UA that reported its fluorescence excitation and fluorescence emission spectra in a supersonic jet.[26]
UA has also been a popular subject in computational chemistry.[27, 28, 29, 30, 31, 32, 33, 34, 35, 36, 37, 38, 39, 40, 41] Early studies focused on the relative energies of the different tautomers and isomers.[29, 30] The confor-mational dynamics in aqueous solution were explored by molecular dynamics (MD) simulations.[35] Vertical excitation energies were reported for various species and protonation states of UA.[27, 31, 32, 33, 34, 40, 41] Static compu-tational studies on the photoreactivity of UA focused on photosensitization (triplet-excited UA can react with 3O
2 to produce 1O2),[38] on hydroxyl-radical scavenging[39] and on photoisomerization.[36, 37, 41]
In aqueous solution, (E)-UA exhibits an excitation-energy-dependent quan-tum yield for photoisomerization (EEDQY-PI). When UA is excited at the red tail of the absorption spectrum around 310 nm (4.0 eV), the E→Z photoisomerization quantum yield is at its maximum of 50%. When it is excited at the blue maximum of the absorption spectrum around 265 nm (4.68 eV), the E→Z photoisomerization quantum yield is at its minimum of 5%.[13, 17] Several explanations for this effect have been proposed over the last 20 years, i.e. different rotamers in the ground state,[27] a manifold of excited states,[15, 16, 17, 2] different tautomers in the ground state,[40] different energy windows for exciting the bright ππ∗ state and the different order of nπ∗ and ππ∗ states in the two tautomers.[41] An open question is whether this effect can be observed only in the condensed phase or also in isolated UA.
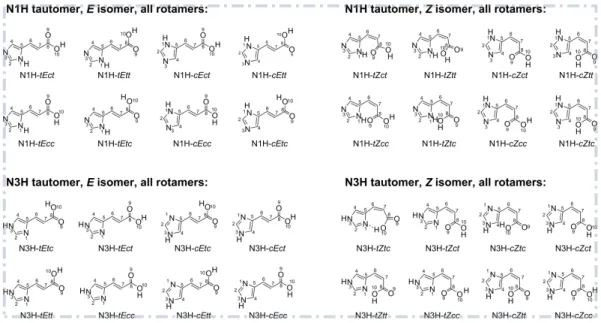
Figure 1: Structural formulas (including atom numbers) of a conformer of the N3H tau-tomer of UA and its photoisomerization product. The designations of the isomers used in this work are given below the structures. The four relevant torsion angles defining the tautomers, isomers and conformers are given at the bottom.
Figure 1 shows the structural formulas of the E and Z isomers of one conformer of the N3H tautomer of UA as well as the four dihedral angles used to distinguish the different isomers and conformers. The notation used in this work was introduced in a previous study[41] and is briefly described again here. The prefix before the dash specifies the protonation site of the imidazole moiety (N1H or N3H), i.e. the tautomeric form. The suffix after the dash denotes the torsion angles of the four relevant bonds. Three of these are single bonds, which are characterized by the descriptors “t” for “trans” and “c” for “cis”. The descriptors “E” and “Z” specify the torsion angle of the isomerizing C=C bond. The isomer N3H-tEtc, for example, is protonated at the N3 position of the imidazole moiety and exhibits a C4–C5–C6–C7 torsion angle of ∼180◦ (t), a C5–C6–C7–C8 torsion angle of ∼180◦ (E), a C6–C7–C8–O9 torsion angle of ∼180◦ (t) and a C7–C8–O10–H10 torsion angle of ∼0◦ (c). Upon photoisomerization, the N3H-tZtc isomer is formed. This example is shown in Figure 1.
The semiempirical orthogonalization-corrected OM2 (orthogonalization model 2) method goes beyond the MNDO (modified neglect of diatomic overlap) model of the NDDO (neglect of diatomic differential overlap) ap-proximation by including explicit orthogonalization corrections into the one-electron Hamiltonian.[42, 43, 44] This remedies many problems resulting from the shortcomings of the MNDO model and lays the groundwork for the de-velopment of a method that can be applied for realistic computations of electronically excited states. The semiempirical self-consistent-field (SCF) solution serves as the reference for a multireference configuration interaction (MRCI) treatment, which can be applied to species with strong multirefer-ence character and to electronically excited states.[45, 46]
Based on previous static explorations of photochemical reaction paths,[41] photoisomerization and excited-state intramolecular proton transfer (ESIPT) are the main photoinduced processes expected to be of significance for the excited-state dynamics in UA. These two types of photoreactions have been studied extensively with computational methods in the past.[47, 48, 49, 50, 51, 52, 53, 54] In the present work, we report on a comprehensive nonadia-batic MD study initiated in the low-lying electronically excited states of iso-lated UA. The dynamics simulations employ the semiempirical OM2/MRCI method[45, 43, 44] and Tully’s fewest-switches trajectory-surface-hopping (TSH) approach.[55, 56, 57, 58, 59] The OM2/MRCI method has been suc-cessfully applied in many recent excited-state TSH studies of medium-size organic chromophores.[43, 46, 60, 61, 62, 63, 64] In the present study, we focus on the excited-state lifetimes and on the competition between pho-toisomerization and ESIPT processes in the various tautomers, isomers and conformers of UA, and we also ascertain whether the simulations provide any evidence of an EEDQY-PI being present in isolated UA.
2. Computational Methods
The MNDO99 program was used for the OM2/SCF and OM2/MRCI calculations.[65] Vertical excitation energies were computed at the OM2/MRCI level using the previously published ground-state equilibrium geometries of eight selected E and Z isomers of both UA tautomers.[41] These structures had been optimized with the second-order Møller-Plesset (MP2) method and the cc-pVDZ basis set (MP2/cc-pVDZ) without imposing any symmetry re-strictions using the Turbomole 6.3.1 program package.[66]
For the OM2/MRCI calculations of vertical excitation energies and the simulation of the TSH dynamics, we adopted a (12,10) active space com-prising eight π MOs (4 occupied, 4 unoccupied) and two occupied n MOs. This active space covered both the lowest-lying nπ∗ state (involving the nO
lone-pair MO at the acid moiety, usually S1 or S2) and the second higher-lying nπ∗ state (involving the nN MO at the imidazole moiety, usually S4 or higher). A visual presentation of the MOs comprising the (12,10) active space is shown in Figure S1 in the Supporting Information for the N3H-tEct isomer. For many molecular conformations, especially in the N3H tautomer, the two relevant lone-pair MOs are strongly localized on either the nitrogen atom of the imidazole ring or the oxygen atom of the acid moiety as well as clearly separated in energy. In other conformations they undergo strong
mixing and are almost equal in energy (especially in the N1H tautomer, see Fig. S2 in the Supporting Information for a visual presentation of the two lone-pair MOs of the N1H-tEct isomer). For these reasons, it is advisable to include both lone-pair MOs in the active space to ensure a balanced treat-ment. With this choice, the active space contains a contiguous block of the six highest occupied MOs, that is, HOMO to HOMO−5.
For preparing the initial conditions for the excited-state dynamics simu-lations, we ran self-consistent-charge density functional tight binding (SCC-DFTB) ground-state dynamics simulations with ChemShell 3.5.0[67, 68] us-ing a timestep of 1 fs, an NVT ensemble and a Nosé–Hoover-chain thermostat of chain-length 10 at 300 K with a characteristic timestep of 0.05. An initial equilibration run of 2 ps was followed by a production run of 1 ns.
During the TSH simulations, we employed the half-electron restricted open-shell Hartree–Fock (ROHF) formalism for all OM2/SCF calculations preceding the OM2/MRCI calculations. The ROHF MOs were optimized for a configuration with two singly occupied MOs (HOMO and LUMO of the closed-shell configuration). This provides a better description of mul-ticonfigurational situations like S1/S0 conical intersections (with biradical character) that play an essential role in excited-state dynamics simulations. For the MRCI treatment, three configuration state functions were chosen as references, namely the ROHF SCF configuration and the two closed-shell configurations derived therefrom (i.e., all singlet configurations that can be generated from HOMO and LUMO of the closed-shell ground state). The MRCI wave function was built by allowing all single and double excitations from these three references.
For the nuclear propagation of the TSH dynamics under NVE conditions, we used a regular timestep of 0.2 fs. The timestep for the integration of the electronic Schrödinger equation was 0.001 fs. The fewest-switches criterion for surface hopping[55] was applied to all points along the trajectory with an energy gap between adjacent electronic states of less than 10 kcal/mol. An empirical decoherence correction of 0.1 a.u. was used.[69]
The simulations employed the recently proposed adaptive-timestep rithm for stabilizing the OM2/MRCI excited-state dynamics.[70] This algo-rithm is applied whenever a trajectory encounters a region with active-space problems, i.e. when there is strong mixing or even switching of active and inactive MOs; in such cases, the timestep for the propagation of the nuclear dynamics is successively halved until the problematic region has been left behind, after which the timestep is restored to its original value. The use of
this algorithm leads to a significantly lower number of unsuccessful trajec-tories and, more importantly, ensures that the total energy stays constant during long simulations. We adopted the following criteria: the timestep was adapted when the total energy changed by more than 0.0001 kcal/mol, or when the overlap of active MOs was less than 0.97 between consecutive timesteps of the nuclear propagation.
We propagated four batches of excited-state trajectories for the four classes of isomers and performed our standard post-processing to filter out any problematic trajectories. The first post-processing procedure removes trajectories that exhibit sudden energy jumps between two consecutive timesteps of more than 5 kcal/mol. The second filter checks whether a trajectory has run for the requested number of steps; if not, it is rejected unless the system has already remained in the S0 state for at least 50 fs. In this latter case, it has successfully completed the radiationless deactivation to the ground state and can therefore be included in the principal photochemical analy-sis. The second filter thus avoids discarding trajectories that exhibit proper excited-state dynamics and abort for technical reasons well after hopping to the ground state (e.g. by visiting unusual ground-state structures).
Excited-state lifetimes of the S2 and S1 states were fitted with a mono-exponential decay function of the form
p(t) = Ae−(t−τd)/τe+ p
0 (1)
where τe is the fitted decay time of the excited state, τdis the initial delay
time that corresponds to the time between first population of an excited state and the onset of its population depletion via internal conversion to a lower state, A is the amplitude and p0 is the fraction of trajectories that remain in the excited state at the end of the simulation time. The reported excited-state lifetime is the sum τ = τe+ τd.
3. Results
3.1. Validation of OM2/MRCI
Before initiating excited-state dynamics simulations, we need to ensure that OM2/MRCI is able to correctly describe the low-lying excited states of UA. For this purpose, we computed the OM2/MRCI vertical excitation energies (VEEs) at the ground-state MP2/cc-pVDZ equilibrium geometries of eight selected conformers of the E and Z isomers of the N1H and N3H tau-tomers and compared them with published MS-CASPT2 and CC2 values.[41]
The current OM2/MRCI and the previous MS-CASPT2 calculations em-ployed the same (12,10) active space comprised of two occupied lone-pair MOs and four occupied and four unoccupied π MOs (see Computational Methods).
The VEEs from OM2/MRCI and those from MS-CASPT2 and CC2[41] are listed in Table S1 of the Supporting Information. In the case of the S1 and S2 states, the OM2/MRCI and ab initio results generally agree well (typically within 0.2 eV). These two states lie close to each other and their order (nπ∗ vs. ππ∗) varies in the set of the eight selected conformers. OM2/MRCI and MS-CASPT2 agree in the predicted order in all eight cases, hence the phys-ical nature of the S1 and S2 states is correctly reproduced by OM2/MRCI. For the S3, S4 and S5 states, there are some larger deviations between the OM2/MRCI and ab initio results, with a tendency of OM2/MRCI to un-derestimate the corresponding VEEs. Our dynamics study involves only the lowest three singlet excited states; most relevant are the lowest two which are well described by OM2/MRCI.
In summary, the use of OM2/MRCI for excited-state dynamics simula-tions of UA appears to be justified by the validation for the lowest nπ∗ and
ππ∗ states (S1 and S2), in particular with regards to the state ordering. We note that the conical-intersection seam[71, 72] mediating S1/S0 deactivation via torsional motion around the central double bond is of ππ∗/S0 type, as in any ethylene derivative.[73] Therefore, the approach toward this conical-intersection seam will be accompanied by a decrease in energy of the ππ∗ state. In conformers where the bright ππ∗ state is the S2 state, a slight torsional motion of the molecule is thus expected to cause a switch in the energetic order of the nπ∗ and ππ∗ states.[41] Further evidence that the to-pography of the nπ∗ and ππ∗ states connecting the E and Z isomers along the photoisomerization coordinate is correctly described by the OM2/MRCI method will be presented later.
3.2. Tautomers, Isomers and Conformers: Sampling of the Conformational Space via Ground-State Dynamics Simulations
For both N1H and N3H tautomers of UA, we consider the E and Z isomers with respect to the central C=C double bond. For each of these isomers, eight different rotamers/conformers exist, as each of the three defining single bonds τ1, τ3 and τ4 (see Fig. 1) can have either trans or cis conformation, resulting in 23 = 8 rotamers/conformers. For each of these eight species, we performed a 1 ns ground-state MD simulation, resulting in a total of 32
Figure 2: Structural formulas of the 32 conformers of UA (each assigned to one of the four “isomer classes” used throughout this work) that were considered as starting structures for the ground-state MD simulations, which were used for the generation of the initial condi-tions for the excited-state MD simulacondi-tions. The nomenclature and atom numbering used throughout this work is given as well. An SCC-DFTB ground-state dynamics simulation of 1 ns length was initiated for each of these conformers. From each of these ground-state MD trajectories 250 geometries were randomly extracted, yielding 2000 starting structures for each of the four classes of isomers and 8000 starting structures in total.
MD simulations starting from all possible conformers of this molecule. All 32 possible rotamers and their connection to the E and Z isomers of the N1H and N3H tautomers are shown in Figure 2. Each ground-state MD simulation was run for 1 ns to ensure that a large number of rotamerizations (i.e. internal rotations around the three flexible single bonds) can take place so that each E and Z isomer is properly equilibrated with respect to all possible rotamers. This was done to avoid any unjustifiable bias in favor of less stable rotamers. In fact, highly unstable rotamers are found to rotamerize almost instantly after the start of the ground-state MD simulation and never reform. Rotamers of medium stability remain present for a longer time (e.g. 100–500 ps) before rotamerizing. Highly stable rotamers, on the other hand, do not rotamerize during the 1 ns simulation and are in addition formed by internal rotations in other trajectories, which were started from less stable rotamers. As a consequence, highly unstable rotamers are practically never
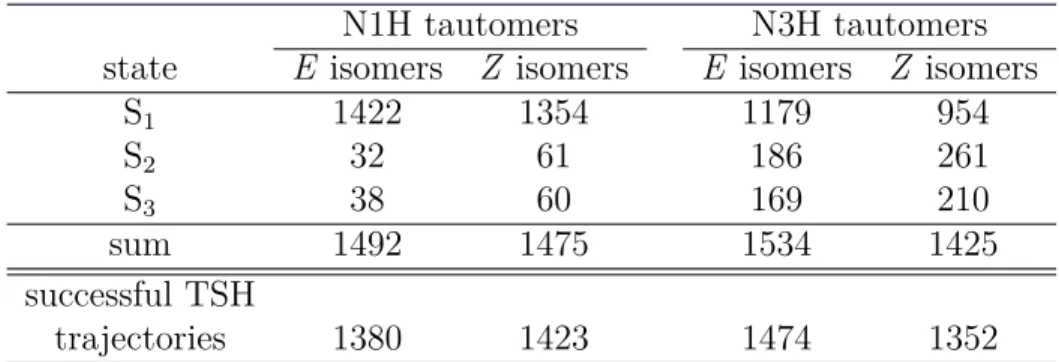
Table 1: Initial conditions for the excited-state MD trajectories: for each of the four classes of isomers (i.e. for the E and Z isomers of the N1H and N3H tautomers, respectively) 2000 structures were randomly sampled from the eight ground-state trajectories initiated from the different conformers of each isomer class (32 conformers and trajectories in total). These 2000 sampled structures per class (8000 in total) were subjected to a filtering pro-cedure (see text). This table lists how many structures passed this propro-cedure and how many of these populate a given excited state with the corresponding initial conditions for the excited-state MD simulations. Also shown are the number of successful excited-state trajectories that passed all post-processing filters after completion of the TSH dynamics.
N1H tautomers N3H tautomers state E isomers Z isomers E isomers Z isomers
S1 1422 1354 1179 954 S2 32 61 186 261 S3 38 60 169 210 sum 1492 1475 1534 1425 successful TSH trajectories 1380 1423 1474 1352
sampled for the initial conditions of the excited-state dynamics simulations, whereas highly stable rotamers are sampled in large numbers.
We carried out the ground-state MD simulations using the SCC-DFTB method.[74] SCC-DFTB was preferred over OM2/SCF because it better re-produced the DFT(B3LYP)/TZVP results for the relative stability of two crucial conformers of UA, N3H-tZtc and N3H-cZct (see Fig. 2).[40] Further details on this are given in the Supporting Information.
From each of the eight ground-state MD simulations conducted for the
E or Z isomers of each of the two tautomers (i.e. for one “block” as shown
in Figure 2), we randomly sampled 250 geometries. The resulting 2000 sam-pled geometries were collected and subjected to a filtering procedure.[75] This procedure involves OM2/MRCI single-point calculations of the vertical excitation energies and oscillator strengths at each of the 2000 sampled ge-ometries. From these data a transition probability was computed and then compared to a random number[75] to decide whether that geometry is kept, and if so, in which of the considered excited states to initiate the nonadia-batic dynamics. This procedure thus generates the excited state(s) at each sampled geometry most likely to be populated by optical absorption. The numbers of passed trajectories for each of the four batches of trajectories (E and Z isomers of N1H and N3H tautomers, respectively) split up into the
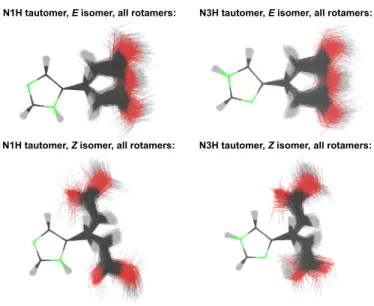
different initially populated excited states, are given in Table 1. It is evident that our filtering procedure preferentially generates the strongly absorbing S1(ππ∗) state, whereas the weakly absorbing S2(nπ∗) and S3(ππ∗) states are populated only sparsely (see also Table S1 in the Supporting Information). In the N1H tautomers, the S1 state is dominating even more than in the N3H tautomers. In total, the processing of each of the four batches resulted in 1425–1534 initial conditions (i.e. structures, velocities, initially populated states), which served as starting points for the excited-state dynamics simu-lations. The initial structures are shown as an overlay in Figure 3.
Figure 3: Overlay of all starting structures used as part of the initial conditions for the excited-state dynamics simulations of the four batches of trajectories. The structural alignments were centered on the imidazole ring. These overlays comprise (starting from the top left and continuing clockwise) 1492, 1534, 1425 and 1475 structures (see Table 1).
In Figure S3 of the Supporting Information, we present the range of the vertical excitation energies for each of the initially populated states, or in other words, the energy initially pumped into the system at the beginning of each excited-state trajectory. In the energy window of very low excitation energies of < 4 eV, we mainly excite the S1 state of the N1H-Z species (with a very minor proportion of N3H-Z species). The excitation of the E isomers of both tautomers requires energies of > 4 eV (N1H) or > 4.25 eV (N3H). For excitation to the S2 and S3 states, all four classes of isomers exhibit roughly the same energy windows, i.e. S2 4.50–5.35 eV and S3 4.75–5.60 eV. These
data confirm earlier findings that both the E and Z isomers of the N1H tau-tomer can be excited at lower energies than those of the N3H tautau-tomer.[41] To visualize the distribution of the initial excitation energies throughout the many starting structures, Figure S4 in the Supporting Information shows histograms of the vertical excitation energies of the initially populated state for each starting structure. The isomers of the N1H tautomer exhibit one “absorption band” with a very weak tail, whereas the N3H tautomer shows a shoulder toward higher excitation energies for the E isomers and two sizable bands for the Z isomers. Hence, the excited-state trajectories of the N1H tautomer start with excitation energies of mainly 3.70–4.70 eV, whereas the trajectories of the N3H tautomer can also carry larger excitation energies of 4.70 eV upwards. (We should point out that the histograms shown in Figure S4 are not properly simulated absorption spectra, because only the initially populated excited state of each starting structure is considered.)
3.3. Surface-Hopping Dynamics Simulations
In the following, we will present the results of almost 6000 excited-state trajectories. We focus on the excited-state lifetimes, the dynamics of the radiationless deactivation mechanisms and the competition between these mechanisms.
3.3.1. Excited-State Lifetime
Figure S5 of the Supporting Information shows histograms of the S1/S0 hopping times for the four batches of trajectories. The E isomers of the N1H tautomer deactivate faster than the E isomers of the N3H tautomer. For the
Z isomers it is the other way around. The Z isomers of the N3H tautomer
deactivate the fastest.
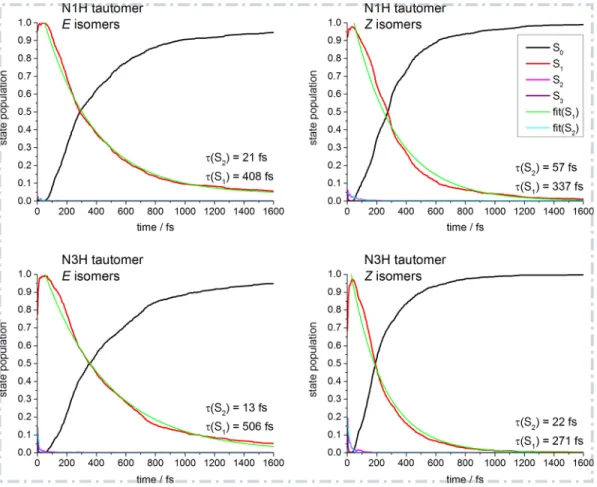
Figure 4 shows the average state populations, the fit of the monoexpo-nential decay of the S2 and S1 populations and the computed excited-state lifetimes of S2 and S1; the lifetime of S3 is negligibly short. These data quan-tify the observations made by inspection of Figure S5: the Z isomers of the N3H tautomer deactivate the fastest with an S1 lifetime of only 271 fs (+ 22 fs for S2). The E isomers of the N1H tautomer deactivate faster than the E isomers of the N3H tautomer (408 vs. 506 fs). The Z isomers of the N3H tautomer deactivate significantly faster than the corresponding E isomers (271 vs. 506 fs), whereas in the N1H tautomer, the difference between Z and
E isomers is less pronounced (337 vs. 408 fs). The N1H-Z isomers, however,
Figure 4: Average state populations of S0–S3 (black, red, magenta, purple) for the four
batches of trajectories collecting the starting geometries of all conformers of a given isomer and a given tautomer. The depletions of the S2and S1 state populations were fitted with
a monoexponential decay function (cyan and green, see text for details). The computed excited-state lifetimes of S2 and S1 (i.e. the sum of the initial delay time and the fitted
decay time of S2 and S1) are printed in the lower right corner.
the S1 populations of the E isomers of both tautomers do not decrease to 0, but instead reach plateau values of 0.06 for N1H-E and 0.05 for N3H-E after the simulation of 1.6 ps.
We have combined the data for the E isomers of the N1H and N3H tautomers (see Fig. S6 of the Supporting Information) and computed their excited-state lifetime, which yields 459 fs for S1 (14 fs for S2). We have done the same for the Z isomers of both tautomers and obtained an S1 lifetime of 307 fs (30 fs for S2). Finally, for a complete mixture (both E and Z isomers
of both N1H and N3H tautomers) the computed lifetime is 373 fs for S1 (22 fs for S2).
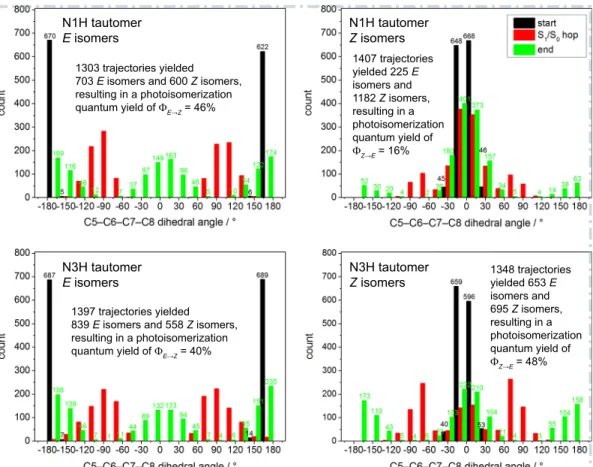
Figure 5: Histograms of the central dihedral angle at the starting geometry (black), the S1/S0hopping point (red) and the final geometry (green) of each trajectory. The analysis
was performed separately for each of the four classes that collect the conformers of a given
E or Z isomer of a given tautomer. The photoisomerization quantum yield was computed
based on the counts of E and Z isomers at the beginning and at the end of each trajectory (numbers on top of each bar). The quantum yield for photoisomerization is computed to be 43% (32%) for the combined E (Z) isomers of both tautomers (see text within the plots for details).
3.3.2. Photoisomerization
Figure 5 presents histograms of the central dihedral angle at three cru-cial points of the dynamics simulations, i.e. the starting geometries, the S1/S0 hopping points and the final geometries of the trajectories. As shown in a pre-vious static study on UA,[41] the optimized S1/S0 conical intersections that
drive the photoisomerization process exhibit a central dihedral angle of∼90◦ and a symmetrical topography with respect to the two “sides” of the lower potential-energy surface (PES) (connecting the ground-state potential-energy wells of the E and Z minima). They should therefore mediate a successful photoreaction, i.e. a photoisomerization, or an aborted photoreaction, i.e. a return to the ground-state reactant with retention of the configuration, at roughly equal probability. Not surprisingly, the dihedral angle encountered at the S1/S0 hopping points is given by a Gaussian distribution around the value of 90◦.
Figure 6: Overlay of the S1/S0hopping points of the Z isomers of the N1H tautomer (1407
structures in total): only the nuclei are shown as dots. The red ellipse marks the region of the intramolecular hydrogen bond between the NH or CH group of the imidazole ring and the oxygen atom of the acid moiety. The green ellipse marks the region of the central C5−C6−C7−C8 moiety, with a dihedral angle mostly in the range between −60 and 60◦
due to the intramolecular hydrogen bond.
We first discuss the photoisomerization of the Z isomers. Upon irradia-tion, the Z isomers of the N1H tautomer rarely undergo isomerization but mainly deactivate back to the reactant. This is clearly seen in the histograms for the starting and final geometries (Fig. 5), which show peaks for the central dihedral angle close to 0◦; maybe more surprisingly, many of the correspond-ing hoppcorrespond-ing points also have small dihedral angles and the expected values of around ±90◦ are encountered quite rarely. For the N1H-Z isomers, even the hopping points have their maxima around 0◦; for the N3H-Z isomers the maxima are found around ±75◦. Inspection of all S1/S0 hopping points of the batch of trajectories for the Z isomers of the N1H tautomer (Fig. 6) ra-tionalizes this finding: most of the hopping points contain a hydrogen bond between the imidazole and the acid moieties of the molecule, which is marked by the red ellipse in Figure 6. Such hydrogen bonds strongly stabilize the
Z form and trap the molecule in a structure with a central dihedral angle
not far from 0◦ (marked by the green ellipse in Fig. 6). Hence, the molecule only rarely breaks free from these hydrogen bonds during the dynamics. In many trajectories, the central part of the molecule moves toward the S1/S0 conical-intersection seam for isomerization, against the restraint of the in-tramolecular hydrogen bond. This seam is encountered in the region around
±60◦ where internal conversion to the ground state with retention of
config-uration becomes feasible. Under the restraint of the intramolecular hydrogen bond, it is very difficult to reach the crossing region around ±90◦, hence the likelihood of forming the E isomer as the photoproduct is very low. By con-trast, in the Z isomers of the N3H tautomer there must be significantly less propensity to such intramolecular hydrogen bonding or these hydrogen bonds are less stable—details on this will be presented below—hence the S1/S0 hop-ping points show a more Gaussian-like shape closer to ±90◦. Consequently, the Z isomers of the N3H tautomer yield significantly more E photoproduct than the Z isomers of the N1H tautomer. As a sidenote, it has to be pointed out that in many trajectories with a central dihedral angle around±0◦at the hopping point the isomerization process is not at all responsible for the nona-diabatic event, but instead an excited-state intramolecular proton transfer (ESIPT) is active. This type of deactivation process, which competes with the photoisomerization process in the Z isomers, entails that the central di-hedral angle undergoes only minor changes during the nonadiabatic event, because the molecular motion driving the nonadiabatic transition is a proton transfer. This is demonstrated in Figure S7 in the Supporting Information, which shows that the central dihedral angle is found close to 0◦ when the ESIPT mechanism is responsible for the S1/S0 surface hop. We will discuss the ESIPT process in detail in the next subsection.
Figure 5 also reports on the quantum yields for photoisomerization, but this aspect will be discussed in more detail in a later subsection.
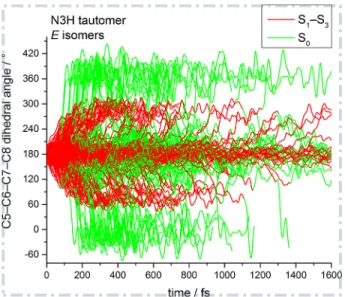
Figure 7 shows the time evolution of the central C5−C6−C7−C8 dihe-dral angle of 200 randomly selected trajectories of the E isomers of the N3H tautomer. As already mentioned, the deactivation from S3 and S2 to S1 takes at most 25 fs (with the exception of the N1H-Z isomers). Hence, the red parts of the trajectories essentially evolve on the S1 PES, whereas the green parts evolve on the S0 PES. In contrast to the Z isomers discussed above, the E isomers show only one dominating mechanism for excited-state deactivation, i.e. E→Z photoisomerization. The molecule begins to initiate the photoisomerization motion mostly within 150 fs after excitation and it
Figure 7: Time evolution of the central C5−C6−C7−C8 dihedral angle of the E isomers of the N3H tautomer for 200 randomly selected trajectories. Red and green lines depict the parts of the trajectories evolving on an excited state (S1–S3) and on the ground state
(S0), respectively.
reaches the conical-intersection seam around ±90◦ about 100 fs after exci-tation or later. During the evolution in the S1 state, the central dihedral angle changes by roughly ±90◦ until the S1/S0 intersection seam is reached. At the S1/S0 seam, the majority of trajectories deactivate to S0. Thereafter, the central dihedral angle evolves further to ∼0 or 360◦ and thus to a Z isomer, or it reverts back to 180◦ and restores the E configuration. Part of the trajectories retain a dihedral angle around 180◦ throughout the dynamics run and an even smaller part remains in the S1 state until the end of the 1.6 ps simulation. Finally, all trajectories that aborted before the end of the intended runtime had populated the S0 state for at least 50 fs, consistent with the cutoff value adopted in our filtering procedure (see Computational Methods).
We mention at this point that we also observed a rare side process, i.e. a ring-opening/ring-breaking reaction. This is documented in Figure S8 of the Supporting Information.
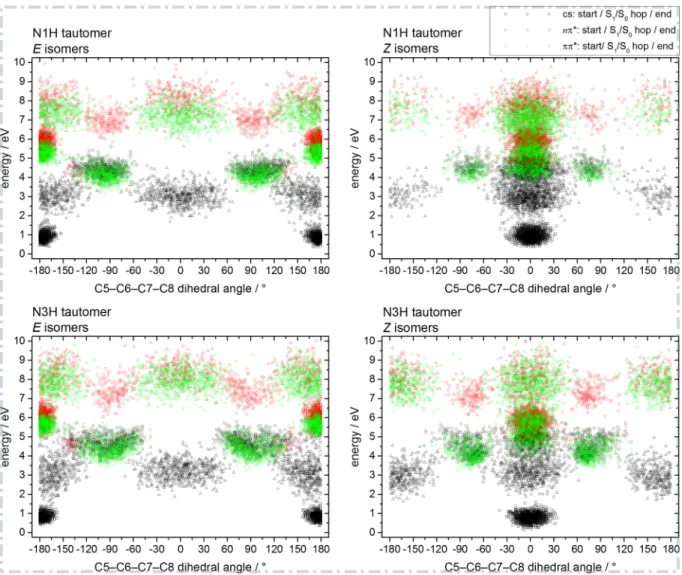
As a last point in this subsection on the photoisomerization reaction, we present further evidence that OM2/MRCI correctly reproduces the nature of the low-lying excited states along the photoisomerization coordinate. Figure 8 shows a plot of the instantaneous energies of the closed-shell (black
sym-Figure 8: Dynamical reconstruction of the critical points on the PESs of UA along the photoisomerization coordinate. Plotted are the instantaneous energies of the closed-shell (black symbols), nπ∗(red) and ππ∗(green) diabatic states at the starting geometry (square symbols), the S1/S0 hopping point (circles) and the final geometry (triangles) of each
trajectory. The energies are given relative to the OM2/MRCI S0 energies of the
lowest-energy conformer of each tautomer/isomer class, i.e. each plot has its own relative lowest-energy scale.
bols), nπ∗ (red) and ππ∗ (green) diabatic states for the critical points along the trajectories. These are the starting geometry (square symbols), the S1/S0 hopping point (circles) and the final geometry (triangles) of each trajectory.
This plot confirms in a dynamical context the static picture explored in a previous ab initio study on the photoisomerization of the tEtc and
N3H-tEct conformers (see Figs. 2 and S2 of ref. 41), in which the diabatic state
order was found to be closed-shell, nπ∗, ππ∗ in the planar E and Z minima and closed-shell, ππ∗, nπ∗ at the S1/S0 conical intersections. This scenario is confirmed by Figure 8 for the E isomers of the N3H tautomer. For the starting and final geometries (clusters of squares and triangles, respectively), the nπ∗ state is the S1 state and the ππ∗ state is the S2 state for geome-tries that are planar or close to planar. As soon as the molecule is distorted strongly enough from the planar configuration, the ππ∗ state is shifted down in energy and becomes S1. In the present dynamics study, most starting geometries show an out-of-plane displacement, which is why they can show the reverse S1(ππ∗), S2(nπ∗) sequence. It is evident that each S1/S0 hopping point (clusters of circles) is part of a ππ∗/closed-shell conical-intersection seam with dihedral angles around ±90◦ (clusters of circles) and that the nπ∗ state lies energetically well above this seam. In summary, the OM2/MRCI dynamics simulations yield a state order that is consistent with the available
ab initio results at the minima and conical intersections,[41] but it can change
at significantly distorted geometries that are visited during the simulations. Analogous plots were generated for the other three classes of isomers (see Figure 8). We note briefly that the results for the N3H-Z isomers show the same trends as described above. In the case of the N1H tautomer, the previous static ab initio study placed the nπ∗ state above the ππ∗ state even for the planar E and Z minima,[41] which is also confirmed by our OM2/MRCI dynamics data.
3.3.3. Excited-State Intramolecular Proton Transfer
Why do the Z isomers deactivate faster than the E isomers? The only deactivation mechanism accessible to the E isomers of both tautomers is pho-toisomerization (apart from a very rare side reaction involving ring opening). As already mentioned above, this process can have two outcomes: retention of the configuration of the central double bond, i.e. aborted photoreaction (E→E or Z→Z), or isomerization, i.e. successful photoisomerization (E→Z or Z→E). A second deactivation mechanism was observed only in the Z iso-mers, namely the previously predicted ESIPT process.[41] ESIPT is known to be ultrafast in many similar systems[76, 77, 53, 78, 79, 80] and is thus ex-pected to accelerate the deactivation of the photoexcited Z isomers. Finally, the ring-puckering deactivation process inherent to the imidazole moiety that
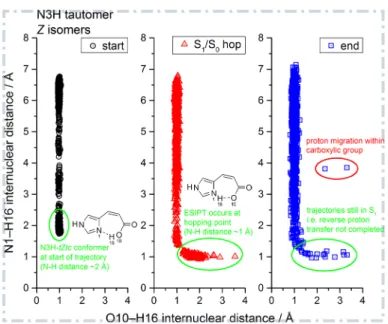
Figure 9: ESIPT process in the N3H-tZtc conformer, in which the proton is transferred from the OH group of the acid moiety to the nitrogen atom of the imidazole moiety. The three plots show the distribution of the O10–H16 and N1–H16 internuclear distances in the trajectories of the Z isomers of the N3H tautomer: left, starting geometry (black circles); middle, S1/S0 hopping point (red triangles); right, final geometry (blue rectangles). The
N3H-tZtc conformers and ESIPT-related structures are marked by green ellipses. In some trajectories the proton remains on the imidazole ring at the end (green ellipse, right). These trajectories are still in the excited state at the end of the simulation time, which corresponds to ∼1% of the total number of simulated trajectories.
was explored in a previous static study[41] could not be identified in any of our dynamics simulations.
Figure 9 addresses the ESIPT process in the Z isomers of the N3H tau-tomer. As described in an earlier study,[41] the excitation to an nπ∗ state (involving a lone-pair MO located at the acid moiety and a π∗ MO located mainly on the imidazole ring) will enhance the acidity of the acid moiety and the basicity of the imidazole nitrogen atom by shifting electron density from the acid to the imidazole moiety. This can induce an intramolecular excited-state proton transfer. Figure 9 shows the O10−H16 and N1−H16 distances in the starting geometries of all trajectories of the Z isomers of the N3H tautomer (black symbols, left). Here, the N3H-tZtc conformer is found at the lower end of the plot (marked by a green ellipse), where the N1−H16 distance is rather short (around 2 Å), indicating the presence of a hydrogen bond between the N1 atom of the imidazole moiety and the H16
Figure 10: Time evolution of the O10−H16 internuclear distance in 71 selected trajectories of the N3H-tZtc conformer during the ESIPT process. Shown are the first 500 fs of the 1.6 ps simulation time. Red and green lines depict the parts of the trajectories evolving in an excited state (S1–S3) and in the ground state (S0), respectively.
atom of the carboxylic OH group. At the hopping points (red symbols, mid-dle) the lower tail of the curve (green ellipse) represents structures formed by ESIPT, featuring covalent N1−H16 bond lengths (ca. 1 Å) and larger O10–H16 internuclear distances in the hydrogen-bonding range. At the final geometries (blue symbols, right), this lower right tail has almost completely disappeared, because the H16 atom has returned to the O10 atom and the N1–H16 hydrogen bond of roughly 2 Å length has reformed; the few remain-ing trajectories (∼1%) in this tail (green ellipse) have not yet deactivated to the ground state at the end of the simulation (1.6 ps). In two trajecto-ries the proton of the acid moiety has undergone a site exchange within the carboxylic group, which leads to large N1–H16 and O10–H16 distances (red ellipse).
Figure 10 shows the time evolution of the O10−H16 internuclear distance in 71 selected trajectories of the Z isomers of the N3H tautomer. In some of these trajectories, the O10−H16 bond length barely changes and only oscil-lates around its equilibrium value, but in most cases the O10−H16 distance increases sharply. This latter motion starts around 50 fs after excitation and initiates the ESIPT process. Thereafter, deactivation to S0 can occur readily, sometimes 75 fs and typically 100–150 fs after excitation. After in-ternal conversion to S0, the proton moves back to the acid moiety. Figure 10 shows that the fastest trajectories have the proton returned to where it
came from as soon as 100 fs after excitation. Hence, the ESIPT process can be faster than the photoisomerization process. This is to be expected, because ESIPT mainly involves the motion of the migrating proton whereas photoisomerization requires larger distortions of heavy-atom motions.
We also observed ESIPT processes in the reverse direction. For example, in the Z isomers of the N1H tautomer the proton moves from the N1H atom of the imidazole ring to the O=C moiety of the acid group (see Fig. S9 in the Supporting Information). We note that the lowest ππ∗ excitation leads to a shift in electron density that facilitates this ESIPT, since the π (π∗) MO has more electron density on the imidazole ring (acid moiety). Because of the large number of trajectories undergoing this reverse ESIPT, the Z isomers of the N1H tautomer barely isomerize overall (see Fig. 5) and have a very short excited-state lifetime (see Fig. 4).
We also observed such a reverse-direction ESIPT for the C−H→O=C proton transfer (see Fig. S10 in the Supporting Information for a plot on the N1H-Z isomers).
The analysis of the prevalence of the ESIPT processes is shown in Figure 11. These histograms were used to count the number of ESIPT events for the
Z isomers of the two tautomers. Two different types of ESIPT processes are
possible in each tautomer (see structural formulas in Fig. 11 and in Figs. 9, S9, S10). The C−H· · ·O → C· · ·H−O process (imidazole moiety to acid moi-ety) is universal to both tautomers. The second process is an N−H· · ·O → N· · ·H−O process (imidazole to acid) in the N1H tautomer and an O−H· · ·N
→ O· · ·H−N process (acid to imidazole) in the N3H tautomer. To define a
successful occurence of an ESIPT event, we used the difference in the inter-nuclear distances between the acceptor and H atoms and the donor and H atoms, d(H· · ·Y) − d(X−H), with X being the proton donor and Y being the proton acceptor in the atom triple X−H· · ·Y. If this value becomes negative at the hopping point, the proton is closer to the acceptor atom than it is to the donor atom, in which case we consider a successful ESIPT event to have occurred during the nonadiabatic transition. The histograms in Figure 11 show the counts for the values of the difference in the internuclear distances for the starting structures (black), the S1/S0 hopping points (red) and the final structures (green). The bars of negative values for the hopping points (marked by purple rectangles) allow us to count the number of ESIPT events (see text in Fig. 11). The C−H· · ·O → C· · ·H−O process, which is possi-ble in both tautomers, is found for 17% and 14% of trajectories in the N1H and N3H tautomers, respectively. In the N3H tautomer, the O−H· · ·N →
Figure 11: Histograms of the differences in internuclear distances (black: starting geome-tries; red: S1/S0hopping points; green: final geometries of each trajectory) of each atom
triple involved in the two possible ESIPT processes of the Z isomers of each of the two tautomers. The two defining internuclear distances d (see label on x axes) are indicated by double-ended arrows on the structural formulas. A negative difference of the internu-clear distances at the S1/S0 hopping point indicates that the S1/S0 deactivation process
involves an ESIPT. The counts for these negative values at the hopping points were used to determine the fraction of trajectories that deactivated via ESIPT; these are marked by purple rectangles. The total fraction of trajectories undergoing ESIPT deactivation is 68% (23%) for the N1H (N3H) tautomer.
O· · ·H−N process is an even rarer event occurring in only 9% of trajectories. The fact that OM2/MRCI underestimates the stability of the N3H-tZtc iso-mer (see Supporting Information), which is the only isoiso-mer capable of this type of ESIPT process, is surely one factor for this low prevalence. All in all, the N3H tautomer undergoes excited-state deactivation via ESIPT by only 23% when the two processes are combined. On the other hand, the N1H tautomer shows a large prevalence for ESIPT via the N−H· · ·O → N· · ·H−O
process at 52%. In total, the N1H tautomer thus undergoes excited-state deactivation via ESIPT by 68%.
These numbers demonstrate that the Z isomers of the N1H tautomer, which show a very low quantum yield for photoisomerization (to be discussed in detail below) of only 16% (see Fig. 5), deactivate predominantly via ES-IPT instead. The N3H-Z isomers, which show a significantly larger quantum yield for photoisomerization of 48%, deactivate via ESIPT significantly less. In summary, in each of the two tautomers, one of the two competing deac-tivation mechanisms available in the Z isomers dominates strongly over the other one.
Figure 12: Mean energy (in kcal/mol) at each timestep of the active excited state (S3, S2
or S1) in all trajectories of the N1H-Z (red) and N3H-Z (green) isomers within the
excited-state segment of each trajectory (i.e. from starting structures to S1/S0 hopping points).
At early times the averaging includes all simulated trajectories; over time, the number of trajectories included in the averaging decreases as more trajectories have deactivated to S0, hence the increase in fluctuations. Shown are the first 1.2 ps of the total simulation
time of 1.6 ps.
Why do the Z isomers of the N1H tautomer deactivate so predominantly via ESIPT, whereas those of the N3H tautomer do not? Our starting geome-tries for the Z isomers of the two tautomers, which we obtained by randomly sampling from ground-state MD simulations initiated from all possible con-formers, mainly consist of the two most stable intramolecularly hydrogen-bonded conformers of each of the tautomers (these are N1H-tZct, N1H-cZct, N3H-tZtc, N3H-cZct, see Fig. 2). These two most stable conformers of each tautomer exhibit the very intramolecular hydrogen bond that is the prereq-uisite for either one of the two possible ESIPT processes in these conformers
(Fig. 11). It is reasonable to assume that the more stable these intramolec-ularly hydrogen-bonded conformers are, the less likely it is for these species to undergo photoisomerization and the more likely it is for them to undergo ESIPT. Our dynamics data offer some insight into this: Figure S11 in the Supporting Information shows the absolute energies of the nπ∗and ππ∗states at the starting geometries and at the S1/S0 hopping points of the N1H-Z and N3H-Z trajectories. On average, the Z isomers of the N1H tautomer have lower excited-state energies than those of the N3H tautomer, both at the starting geometries and at the hopping points found around 0◦. Since prac-tically all of these points represent a structure that exhibits one of the two intramolecular hydrogen bonds required for an ESIPT process, this picture indicates that these structures are more stable in the N1H tautomer than they are in the N3H tautomer. Extending this analysis beyond these two critical points, Figure 12 shows at each timestep the average energy of the active excited state in all the N1H-Z and N3H-Z trajectories within the excited-state segments (i.e. from starting structures to S1/S0 hopping points). The excited-state potentials of the N1H tautomer are on average lower in energy than those of the N3H tautomer. In conclusion, the Z isomers of the N1H tautomer are more tightly locked in their Z conformation, which facilitates ESIPT and makes photoisomerization less likely. The Z isomers of the N3H tautomer, on the other hand, are less tightly bound by these intramolecular hydrogen bonds and thus more flexible to undergo photoisomerization.
3.3.4. Quantum Yields for Photoisomerization and for ESIPT
For the following analyses on quantum yields we filtered out the few trajectories that were still in S1 at the end of the TSH simulations, as it is unknown which photoproducts these trajectories would form when they eventually deactivate to S0. Hence, our analyses of quantum yields are based on all those trajectories that have deactivated to S0 within 1.6 ps.
We computed the photoisomerization quantum yields for the E and Z isomers based on the analyses shown in Figure 5. For both tautomers com-bined, this gives a quantum yield of 43% for the photoisomerization of the
E to Z isomers and of 32% for the reverse process. While the E isomers
of the two tautomers show only small differences in the quantum yield for formation of the Z isomers (46% vs. 40% for N1H and N3H), the Z isomers of the two tautomers show very different quantum yields (16 vs. 48% for N1H and N3H). The latter was already rationalized with the different stabil-ities of the Z isomers of the different tautomers. As shown above, the overall
lower quantum yield for the photoisomerization of Z to E isomers stems from the fact that many of the Z isomers are more or less tightly locked in their conformation by intramolecular hydrogen bonds and, moreover, they have a strong propensity to deactivate via ESIPT rather than photoisomerization.
Figure 13: Quantum yield for photoisomerization as a function of the vertical excitation energy of the optically excitable initially populated state at the beginning of each trajec-tory. Plots are presented for the four classes of isomers used throughout this article and also for all E and Z isomers of both tautomers combined.
To check whether isolated (E)-UA shows an excitation-energy-dependent quantum yield for E→Z photoisomerization (EEDQY-PI)[13, 17] we com-puted the photoisomerization quantum yield as a function of the vertical ex-citation energy necessary to excite the starting geometry of each trajectory to the initially populated excited state. All bins of the vertical excitation energies with less than ten trajectories were disregarded for this analysis, as the statistical uncertainty would be very large for such small samples. The
resulting plot is shown in Figure 13. For the E isomers, we find no signifi-cant effect as the quantum yield for photoisomerization stays fairly constant around a value of 0.4 (for both tautomers combined). Only one spike for a quantum yield of 0.8 is visible for the N1H tautomer at an excitation energy of 4.8 eV. Hence, isolated (E)-UA does not exhibit an EEDQY-PI (contrary to what was measured in aqueous solution for the E isomers, where a change from 0.50 to 0.05 was observed[13, 17]).
Interestingly, the Z isomers do show an EEDQY-PI. The photoisomer-ization quantum yield of the N1H tautomer is very low, around 0.1, at low excitation energies (3.9–4.1 eV), rises to ca. 0.5 for larger excitation energies (4.2–4.7 eV) and then decreases slightly for even larger energies (>4.7 eV). For the Z isomers of the N3H tautomer, the quantum yield barely varies with energy, being typically in the range of 0.5, with two dips of 0.3 at 4.7 and 5.4 eV. The plot for the combined N1H and N3H tautomers shows that the
Z isomers do exhibit an EEDQY-PI. However, this energy dependence
ap-pears opposite to the one found experimentally for the E isomers in aqueous solution, i.e. the quantum yield increases rather than decreases when going from the lowest to higher excitation energies.
A different presentation of the data for the vertical excitation energies of the initially populated state at the starting geometry and the dihedral angle at the starting and final geometries of each trajectory is given in Figure S12 in the Supporting Information.
The EEDQY-PI found for the Z isomers could be connected to the ESIPT mechanism operating in the Z isomers. To check on this, we also computed the quantum yields for ESIPT for the Z isomers of the two tautomers, to elucidate whether an excitation-energy-dependent quantum yield for ESIPT (EEDQY-ESIPT) exists. These data are presented in Figure 14. The
N1H-Z isomers indeed show an EEDQY-ESIPT. In the low-energy range, where
the quantum yield for photoisomerization increases with higher excitation energies (< 4.4 eV), the quantum yield for ESIPT decreases from 0.9 at 3.6 eV to 0.2 at 4.5 eV excitation energy. After this minimum, the quantum yield rises slightly. Thus, the N1H-Z isomers show a complementary behavior in the quantum yields for photoisomerization and ESIPT, which highlights the competition between these two deactivation processes.
The N3H-Z isomers, whose quantum yield for photoisomerization was found to be more or less independent of the excitation energy, also show only slight variations in the quantum yield for ESIPT with varying excitation energy, with values found mostly around 0.2–0.3.
Figure 14: Quantum yield for ESIPT as a function of the vertical excitation energy of the initially populated excited state at the beginning of each trajectory. Plots are presented for the Z isomers of the N1H and N3H tautomers separately and for both tautomers combined.
Figures S13 and S14 in the Supporting Information show histograms of photoisomerization and ESIPT events as a function of the excitation energy.
3.3.5. Summary of Results from the Dynamics Simulations
Table 2 presents a summary of all major quantifiable results obtained from our dynamics simulations, i.e. excited-state lifetimes of the S2 and S1 states and the quantum yield for photoisomerization and ESIPT. All these analyses are given for the four classes of isomers separately, for the E and Z isomers of both tautomers combined and for a full mixture of species.
4. Discussion and Conclusions
In this study, we have presented OM2/MRCI TSH simulations of all pos-sible tautomers, isomers and conformers of isolated neutral UA (Fig. 2). We
Table 2: Summary of lifetimes and of quantum yields for photoisomerization and ESIPT for the four classes of isomers and tautomers, for the E and Z isomers of each tautomer combined and for all species combined.
S2 lifetime S1 lifetime photoisomerization ESIPT isomers / fs / fs yield (%) yield (%)
N1H-E 21 408 46 0 N3H-E 13 506 40 0 E 14 459 43 0 N1H-Z 57 337 16 68 N3H-Z 22 271 48 23 Z 30 307 32 46 full mixture 22 373
have validated the use of OM2/MRCI for the computation of the state order of the low-lying nπ∗ and ππ∗ valence excited states for the S1 and S2 vertical excitation energies for eight different UA species (tautomers, E/Z isomers and conformers). The physical character of the S1 and S2 states is cor-rectly reproduced by OM2/MRCI (Table S1 in the Supporting Information). The characteristic qualitative shape of the S1 and S2 excited-state potential-energy surfaces along the photoisomerization coordinate is also well described by OM2/MRCI. This has been shown by mapping the critical points (starting geometries, S1/S0 hopping points and final geometries) of the excited-state trajectories onto the photoisomerization coordinate space (Fig. 8).
The initial conditions for the dynamics simulations were generated by 1 ns ground-state SCC-DFTB MD simulations, which were performed for each possible conformer of the E and Z isomers of each tautomer of UA (Fig. 2). From these 32 MD trajectories, 8000 structures were randomly sampled and filtered for initial conditions by computing VEEs and oscillator strengths to determine for each structure the bright state(s) most likely to be populated via optical excitation. Almost 6000 initial conditions were obtained in this manner (Table 1, Fig. 3), which served as starting points for the OM2/MRCI TSH simulations.
The computed S1 lifetimes are in the range 271–506 fs (Fig. 4) while the S2 state is much shorter-lived (13–57 fs). The Z isomers deactivate faster than the E isomers. The S1 population of the E isomers does not reach 0, as observed for the Z isomers, but reaches a plateau value of 0.06 and 0.05 for the N1H and N3H tautomers, respectively.
The TSH simulations showed that the E isomers of UA photoisomerize more readily than the Z isomers. The quantum yield for photoisomeriza-tion was found to be 43% for the E isomers, compared to only 32% for the
Z isomers (Fig. 5). This was rationalized by the propensity of the Z
iso-mers to form intramolecular hydrogen bonds (Fig. 6), which lock them in the Z conformation and thus restrain torsional motions towards the E iso-mer. Most notably we found a large difference in the quantum yields for photoisomerization for the Z isomers of the N1H and N3H tautomers (16 vs. 48%). We found that the excited-state energies of the N1H-Z isomers are lower than those of the N3H-Z isomers (Figs. S11, 12), which suggests that the intramolecular hydrogen bonds in the N1H-Z isomers are stronger than in the N3H-Z isomers. Stronger intramolecular hydrogen bonds inhibit the flexibility of the Z isomers required for successful photoisomerization and thus lead to a higher quantum yield for ESIPT.
Ultrafast ESIPT processes are possible in all of the most stable conformers of Z isomers, but not in the E isomers. The deactivation via ESIPT can normally be completed within 50–200 fs after excitation (Fig. 10), whereas via photoisomerization it typically takes 100–400 fs to reach the S1/S0 conical-intersection seam (Fig. 7). Hence, the Z isomers can show a strong preference to deactivate via ESIPT rather than via photoisomerization and they can do so faster than the E isomers. In the dynamics simulations, ESIPT processes (in both directions for the N3H tautomer) were observed (Figs. 9, S9, S10) for two types of intramolecular hydrogen bonds (Fig. 11) found in the different conformers of the Z isomers (Fig. 2). Overall, the ESIPT processes in the
Z isomers contribute to their shorter excited-state lifetimes and their lower
quantum yields for photoisomerization. Surprisingly, however, despite the strong tendency for intramolecular hydrogen bonds, the N3H-Z isomers gave a larger quantum yield for photoisomerization than even the E isomers (48% for N3H-Z vs. 40% for N1H-E and 46% for N3H-E). The quantum yields for ESIPT (Fig. 11) were found at 68% for the N1H tautomer, consistent with its low quantum yield for photoisomerization. The N3H tautomer, which photoisomerizes significantly, correspondingly shows a low quantum yield for ESIPT of only 23%.
We could not find evidence for an excitation-energy-dependent quan-tum yield for photoisomerization (EEDQY-PI) in isolated (E)-UA (Fig. 13). The present simulations thus do not offer support for previous hypothe-ses that the EEDQY-PI could be rooted in the different absorption spec-tra of the tautomers[40] or in the different order of the two lowest excited
states of the tautomers.[41] The same applies to earlier suggestions that the EEDQY-PI might be caused by two electronic states with overlapping ab-sorption spectra[16, 26] or arise from multiple ground-state rotamers.[16] On the contrary, the current results suggest that the EEDQY-PI does not exist in isolated (E)-UA and should thus be an effect that develops in aque-ous solution.[13, 17] However, we did observe an EEDQY-PI in the case of the N1H-Z isomers: the quantum yield is low for low excitation energies and higher for larger excitation energies. This is opposite to the energy dependence that has been experimentally observed for (E)-UA in aqueous solution.[13, 17] We also found a distinct excitation-energy-dependent quan-tum yield for ESIPT (EEDQY-ESIPT) in the N1H-Z isomers (Fig. 14), which is complementary to its EEDQY-PI in the lower ranges of excitation ener-gies. The N3H-Z isomers, on the other hand, show only minor variations in the quantum yield for ESIPT (as they do also for photoisomerization).
Surprisingly, although the excited-state deactivation of the Z isomers is clearly driven by two competing processes—photoisomerization and ESIPT— we could not find evidence for biexponential decay of the excited-state pop-ulations. Our attempts at fitting a biexponential decay function to the S1 population curve failed. Plotting the natural logarithm of the S1 population against time also does not reveal the existence of two processes of different deactivation speeds in the form of a pronounced kink in the line. This sug-gests that on average both photoisomerization and ESIPT processes operate in the same range of timescales from as fast as 50 fs to as slow as 500 fs, thus resulting in monoexponential decay. The computed excited-state lifetime of
∼475 fs for the combined E isomers of the N1H and N3H tautomers (S1+S2, Fig. S6) could be compared with a fs-laser-spectroscopic determination of the excited-state lifetime of gas-phase UA, which could be conducted using commercially available (E)-UA (a mixture of N1H and N3H tautomers).
According to our OM2/MRCI TSH simulations, ESIPT should be the dominating deactivation process in the Z isomers. In the N3H tautomer, such a proton transfer is not only possible in the direction acid moiety→ imidazole ring (as previously explored[41]), but also in the opposite direction. Having observed that the N−H and even the C−H group of the imidazole ring can act as a proton donor raises the question whether this is indeed true or whether OM2/MRCI erroneously overestimates the photoacidity of the annular N−H and C−H bonds. This issue may be resolved in future theoretical studies by exploring the excited-state dynamics of UA with multiconfigurational ab
Furthermore, this study has laid the groundwork for future excited-state dynamics simulations of UA in an aqueous surrounding. Such simulations could elucidate whether the EEDQY-PI found experimentally in aqueous solution[13, 17] can be reproduced computationally. Also, our finding of a complementary behavior of the EEDQY-PI and EEDQY-ESIPT in the N1H-Z isomers raises the question of whether there is also an excitation-energy-dependent quantum yield for proton transfer in the E isomers, which is complementary to the EEDQY-PI measured in water.[13, 17] In this case, however, the proton would not be intramolecularly transferred, as studied herein, but between UA and surrounding water molecules.
Finally, in practical terms, this study is a good example for the capabili-ties of the OM2/MRCI method for excited-state dynamics simulations. We have simulated almost 6000 excited-state trajectories of 1.6 ps length at a regular timestep of 0.2 fs, with a typical runtime of 3−4 hours on a single contemporary CPU. Hence, all these trajectories can be run in a few days when using ∼100 CPUs in parallel. The statistical analysis of such a large number of trajectories leads to well-converged results and allows detailed in-sight not only into the dominant photoinduced processes but also into side events. In addition, as exemplified here for the case of UA, the high efficiency of the OM2/MRCI TSH approach enables comprehensive dynamics studies of all relevant tautomers, isomers and conformers.
Acknowledgement
This work was supported by the European Research Council through an ERC Advanced Grant to W.T. (OMSQC). M.B. acknowledges support from the Excellence Initiative of Aix-Marseille University (A*MIDEX) and the project Equip@Meso (ANR-10-EQPX-29-01), both funded by the “In-vestissements d’Avenir” program of the French Government, as well as from the WSPLIT project (ANR-17-CE05-0005-01). D.T.: I am highly grateful for the guidance, support and experience that I enjoyed during my time in Wolfgang Domcke’s research group. Urocanic acid was the first molecule that Wolfgang Domcke suggested as a potential subject of study to me and it has been a focus of my scientific interests ever since.
References
[1] T. Mohammad, H. Morrison, H. HogenEsch, Urocanic acid photochem-istry and photobiology., Photochem. Photobiol. 69 (1999) 115–135.
[2] J. D. Simon, Spectroscopic and dynamic studies of the epidermal chro-mophores trans-urocanic acid and eumelanin., Acc. Chem. Res. 33 (2000) 307–313.
[3] N. K. Gibbs, J. Tye, M. Norval, Recent advances in urocanic acid photo-chemistry, photobiology and photoimmunology., Photochem. Photobiol. Sci. 7 (2008) 655–667.
[4] N. K. Gibbs, M. Norval, Urocanic acid in the skin: a mixed blessing?, J. Invest. Dermat. 131 (2011) 14–17.
[5] H. C. Arentsen, C. F. J. Jansen, C. A. Hulsbergen-van de Kaa, J. K. Laihia, L. Pylkkänen, L. Leino, E. Oosterwijk, J. A. Witjes, Antitumor effects of cis-urocanic acid on experimental urothelial cell carcinoma of the bladder., J. Urol. 187 (2012) 1445–1449.
[6] G. M. Arocena, A. Zorreguieta, R. Sieira, Expression of VjbR under nutrient limitation conditions is regulated at the post-transcriptional level by specific acidic pH values and urocanic acid., PLoS One 7 (2012) 1–9.
[7] T. Yamaguchi, K. Hiromasa, R. Kabashima-Kubo, M. Yoshioka, M. Nakamura, Galectin-7, induced by cis-urocanic acid and ultraviolet B irradiation, down-modulates cytokine production by T lymphocytes., Exp. Dermatol. 22 (2013) 840–842.
[8] N. E. Wezynfeld, W. Goch, W. Bal, T. Fraczyk, cis-Urocanic acid as a potential nickel(II) binding molecule in the human skin., Dalton Trans. 43 (2014) 3196–3201.
[9] J. E. Ihm, I. Krier, J. M. Lim, S. Shim, D. K. Han, J. A. Hubbell, Improved biocompatibility of polyethylenimine (PEI) as a gene carrier by conjugating urocanic acid: In vitro and in vivo., Macromol. Res. 23 (2015) 387–395.
[10] E. Korhonen, N. Piippo, M. Hytti, K. Kaarniranta, A. Kauppinen, cis-Urocanic acid prevents inflammation and cell death in UVB-treated ARPE-19 cells., Acta Ophthalm. 93 (2015) 0427.
[11] B. Xiao, P. Ma, E. Viennois, D. Merlin, Urocanic acid-modified chitosan nanoparticles can confer anti-inflammatory effect by delivering CD98 siRNA to macrophages., Colloids Surf. B 143 (2016) 186 – 193.
[12] D. L. Pham, K.-M. Lim, K.-M. Joo, H.-S. Park, D. Y. M. Leung, Y.-M. Ye, Increased cis-to-trans urocanic acid ratio in the skin of chronic spontaneous urticaria patients., Sci. Rep. 7 (2017) 1318.
[13] H. Morrison, C. Bernasconi, G. Pandey, A wavelength effect on urocanic acid E/Z photoisomerization., Photochem. Photobiol. 40 (1984) 549– 550.
[14] J. K. Laihia, H. Lemmetyinen, P. Pasanen, C. T. Jansén, Establishment of a kinetic model for urocanic acid photoisomerization., J. Photochem. Photobiol. B 33 (1996) 211–217.
[15] B. Li, K. M. Hanson, J. D. Simon, Primary processes of the electronic excited states of trans-urocanic acid., J. Phys. Chem. A 101 (1997) 969– 972.
[16] K. M. Hanson, B. Li, J. D. Simon, A spectroscopic study of the epider-mal ultraviolet chromophore trans-urocanic acid., J. Am. Chem. Soc. 119 (1997) 2715–2721.
[17] K. M. Hanson, J. D. Simon, The origin of the wavelength-dependent photoreactivity of trans-urocanic acid., Photochem. Photobiol. 67 (1998) 538–540.
[18] A. Kammeyer, T. A. Eggelte, J. D. Bos, M. B. M. Teunissen, Urocanic acid isomers are good hydroxyl radical scavengers: a comparative study with structural analogues and with uric acid., Biochim. Biophys. Acta 1428 (1999) 117–120.
[19] N. Haralampus-Grynaviski, C. Ransom, T. Ye, M. Rôzanowska, M. Wrona, T. Sarna, J. D. Simon, Photogeneration and quenching of reactive oxygen species by urocanic acid., J. Am. Chem. Soc. 124 (2002) 3461–3468.
[20] J. Brookman, J. N. Chaćon, R. S. Sinclair, Some photophysical studies of cis- and trans-urocanic acid., Photochem. Photobiol. Sci. 1 (2002) 327–332.