Coordination between Presynaptic and Postsynaptic Properties
Measured at Single Terminals in Hippocampal Cultures
by
Jonathan G. Murnick
M.Phil. Physiology University of Cambridge, 1996 A.B. Chemistry Princeton University, 1994Submitted to the Department of Electrical Engineering and Computer Science in Partial Fulfillment of the Requirements for the Degree of
Doctor of Philosophy at the
Massachusetts Institute of Technology September 2003
C 2003 Massachusetts Institute of Technology All rights reserved
Signature of A uthor: . ... . ... ... Department lectrical Engineering and Computer Science
August 29, 2003
Certified by: ...
Guosong Liu Associate. Professor of Neurobiology T4hesisj$hervisor Accepted by: ...
Chair, Committee on Department of Electrical Engineering and
MASSACHUSETTS INSTITUTE
OF TECHNOLOGY
Arthur C. Smith Graduate Students Computer Science
Coordination between Presynaptic and Postsynaptic Properties
Measured at Single Terminals in Hippocampal Cultures
by
Jonathan G. Murnick
Submitted to the Department of Electrical Engineering and Computer Science on August 29, 2003 in Partial Fulfillment of the Requirements for the Degree of Doctor of
Philosophy in Electrical Engineering and Computer Science
Abstract
I examined the spatial scale at which pre-synaptic activity interacts with synaptic strength and developmental events in the post-synaptic cell. I performed this work in primary hippocampal cultures of postnatal Sprague-Dawley rats after 8-10 days in vitro. I measured electrophysiologically the functional addition of GluR2 and NR2A subunits to AMPA and NMDA receptors, respectively, as well as the absolute strength of AMPA-and NMDA-mediated currents. I examined both spontaneous quantal events AMPA-and local responses using glutamate iontophoresis at putative single-synaptic sites. I monitored pre-synaptic strength via vesicle staining with FM dyes. I found an inverse correlation between pre-synaptic and post-synaptic strength at individual synapses: Intensity of presynaptic FM-staining was inversely correlated with AMPA current magnitude measured by local iontophoretic stimulation. I also found a negative correlation at individual puncta between FM-staining intensity and decay time of iontophoretically-evoked NMDA decay current. Presumably, this correlation reflects a higher proportion of NR2A subunits at presynaptically more active synapses. I propose that homeostatic feedback mechanisms may operate at a subecellular level to maintain excitatory synaptic input at a single synapse or within a dendritic branch.
In order to stimulate individual synaptic sites, I used a novel iontophoresis system, presented here. The system incorporates a 0.1 ptm electrode tip for local stimulation, combined with fast capacitance compensation to achieve high-speed application from a high-resistance tip. Ejection of fluorescent dye from the electrode shows that transmitter can be limited to the width of a single synapse and to a time scale similar to an endogenous event. The speed and localization of transmitter is confirmed by iontophoretically stimulating single labeled synapses in cultured hippocampal neurons held under voltage clamp. The amount of transmitter ejected is linear and reproducible over a physiologically relevant range, making this technique useful for examining receptor kinetics and receptor insertion/removal. The system should be capable of delivering any charged neurotransmitter.
Thesis Supervisor: Guosong Liu
CHAPTER 1 INTRODUCTION ... 4
CHAPTER 2 BACKGROUND... 7
Techniques for Probing Single Synapses ... 7
Homeostatic Regulation of Synaptic Strength... 10
Activity-mediated Change in Receptor Subtype ... 11
CHAPTER 3 IONTOPHORESIS SYSTEM PERFORMANCE ... 13
Description of System ... ... 13
Speed of Release ... ---... 15
Spatial Localization ...---. ... ---... 18
Control of Transmitter Concentration ... 20
CHAPTER 4 DEVELOPMENTAL CHANGES AT SYNAPSES IN CULTURE .. 24
Presynaptic Function: Vesicle Turnover ... 24
Postsynaptic Properties: GluR2 Insertion ... 29
Postsynaptic Function: AMPA Conductance ... 32
Postsynaptic Properties: Other... .... 34
Possible Pre/Post Interactions...37
CHAPTER 5 PRE/POST SYNAPTIC INTERACTIONS AT INDIVIDUAL SYNAPSES... 39
Overview of Technique... ... ... 39
Inverse Correlation between Pre- and Post-synaptic Strengths ... 41
Pre/Post Synaptic Coordination Originates Locally within Cells...43
Interactions within a Local Dendritic Neighborhood... 45
Stronger presynaptic terminals have a higher postsynaptic fraction of NR2A...47
Presence of GluR2 is not Coordinated with Presynaptic Strength...48
Effect of Activity Block on Pre/Post Relationships ... 49
CHAPTER 6 DISCUSSION... 51
Iontophoresis Technique ... 51
Pre- and Post-synaptic Properties ... 55
Opportunities for Further Study...62
CHAPTER 7 METHODS... 65
Hippocampal Cell Culture and Patch Clamp Recording... 65
Fluorescence Data Acquisition... 66
CHAPTER 8 REFERENCES ... 68
Chapter 1 Introduction
Although the microscopic structure of the brain has been studied for over a hundred years, the brain's fundamental computational unit-the smallest component that takes two or more inputs and produces a non-linear output used for subsequent computations-still is unknown. Conventional wisdom holds that this computational unit is the neuron. In the most basic formulation, a single neuron can receive hundreds to thousands of excitatory and inhibitory inputs to its extensive dendritic tree. The cell soma sums these inputs and, if some threshold is reached, fires an action potential. This "integrate-and-fire" behavior is based on known physiology of active electrical processes within neurons and is widely used as a model for exploring the function of neural circuits.
Many variations of and extensions to integrate-and-fire have been proposed, such as the weighting of inputs based on their timing or their distance from the soma. Still, the widely held assumption is that the basic computation within the brain occurs when a neuron fires or does not fire an action potential.
Recent studies have suggested that the most basic computations in the brain are performed subcellularly-at the level of one dendritic branch or even among a few individual synapses. Several authors have argued that action potentials can and do originate within dendrites under physiological conditions, as well as within the soma. These action potentials may not simply amplify synaptic inputs, but also help create
Since no one has yet deciphered the neural code, it is impossible to say definitively what information a neural circuit derives from a particular firing pattern. Therefore, one cannot be sure when and where a computation is being performed. However, it is possible to infer something about the functional significance of a structure by examining how it is regulated endogenously. In particular for this thesis, I look at activity-dependent regulation of synaptic strength and properties, a long-established principle of neural functioning. Several recent studies have established a principle of activity-mediated homeostatic regulation of synaptic strength. Other work has demonstrated the importance of neural activity in regulating the insertion of GluR2 and NR2A subunits into AMPA and NMDA receptors, respectively.
Most of these studies have been carried out by modifying activity in entire cell cultures or brain slices, or in an entire brain region in vivo (e.g. eye-opening). A few authors have shown that homeostatic regulation of synaptic strength can occur at the level of a single neuron. For example, lowering activity levels of just a few neurons in a cell culture leads to a selective increase in the synaptic input strength to the cells with lower activity. However, if independent neural computations are carried out on a subcellular scale, it would be reasonable to expect that activity-dependent regulation of synaptic properties also occurs at a subcellular level. No study to date has looked at the effects of activity on such a local scale.
In this work, I look at the relationship between presynaptic and postsynaptic strength at single terminals. I also examine the effect of presynaptic activity in regulating postsynaptic receptor subtypes. I find that presynaptic strength and both postsynaptic strength and receptor properties are indeed coordinated at individual synapses.
In order to measure synaptic strength and postsynaptic properties at individual terminals, I needed to develop and refine techniques for single-synapse investigation. I rely heavily on glutamate iontophoresis for direct postsynaptic stimulation of putative synaptic sites. I show that a properly designed iontophoresis electrode can deliver glutamate with a time course similar to endogenous events and a spatial localization small enough to stimulate only a single synaptic terminal.
Chapter 2 Background
Techniques for Probing Single Synapses
The strength of a synaptic connection is determined presynaptically by release probability and concentration of neurotransmitter and postsynaptically by the number and properties of receptors. Recent advances in the understanding of glutamate receptor regulation trafficking during development and plasticity have shown that both the number and properties of AMPA and NMDA receptors are present in different amounts at different times and with different degrees of localization during development (Pickard et al., 2000; Sans et al., 2000; Stocca and Vicini, 1998; Tovar and Westbrook, 1999; Zhu et al., 2000). Similar diversity is thought to occur during plasticity events such as LTP and LTD. This highly dynamic picture demands tools to measure instantaneously the presence and functionality of postsynaptic receptors.
Many studies have fruitfully examined these changes by examining mEPSC's or evoked responses. While these studies have led to an increased understanding of glutamate receptor behavior, it has been difficult to separate clearly pre-synaptic from post-synaptic mediated phenomena. Additionally, synaptic heterogeneity prevents high-level analysis of synaptic function (Hessler et al., 1993; Murthy et al., 1997; Rosenmund et al., 1993). Finally, these approaches cannot directly address synapses receptors on the postsynaptic cell that may not lie directly under a pre-synaptic site (Cottrell et al., 2000).
Other studies have visualized post-synaptic receptors directly using monoclonal antibody staining (Rao et al., 1998) or fluorescent fusion proteins (Zhu et al., 2000). While these techniques can distinguish changes in postsynaptic receptor quantity and localization from changes in presynaptic release, they cannot do so instantaneously. Further, even when they are sensitive enough to distinguish surface from subsurface receptors, they cannot speak to the functionality of those receptors.
The number and properties of functional postsynaptic receptors can be assessed directly by their responses to local application of transmitter. To address questions of postsynaptic receptor identity, functionality, and localization in dynamic living cells, there is a need for techniques that can deliver neurotransmitter directly to receptors with precise spatial and temporal control. An ideal technique for single-synaptic stimulation should mimic the fast time course and highly local spatial distribution of neurotransmitter released from a synaptic vesicle. Current techniques for stimulating an isolated postsynaptic site include excised dendritic patch, laser uncaging, iontophoresis, and caged glutamate. An excised patch can be moved quickly in and out of different solutions within 0.3ms (Fleck et al., 1996; Geiger et al., 1995; Jonas et al., 1994; Jonas and Sakmann, 1992; Sommer et al., 1990; Tong and Jahr, 1994), enabling brief stimulation. It is also possible to select a section of dendrite containing a high synaptic density, thus ensuring stimulation localized to one or few synapses. Still, the synapse is removed from its normal surroundings, which may have undesirable or unclear effects for an experiment (e.g. rundown) (Rosenmund et al., 1995b).
Laser-released caged neurotransmitter allows the study of synapses without disrupting a cell's physical integrity, facilitating direct comparison of responses at different areas of
a dendrite (Callaway and Katz, 1993; Parpura and Haydon, 1999b; Pettit et al., 1997; Wang and Augustine, 1995). However, this technique has a stimulation rise-time about an order of magnitude slower than endogenous stimulation, which can greatly alter the responses of certain receptors (Kullmann, 1999; Trussell et al., 1988). It is also difficult to limit the radius of uncaging beyond about 20ptm, which is too large a region to confine stimulation to a single synapse (Callaway and Katz, 1993; Pettit et al., 1997; Wang and Augustine, 1995). Chemical two-photon uncaging has made some improvement to the spatial localization of this technique (Pettit et al., 1997), but its time course is still slow compared to endogenous release. One recent report has demonstrated two-photon excitation uncaging for AMPA receptor stimulation with near-endogenous space and time resolution (Matsuzaki et al., 2001). However, this approach is very costly and cannot easily be extended to other molecules besides glutamate.
There is still a need for a technique of synaptic stimulation that is fast, local, and usable on intact cells. High speed and localized application of neurotransmitter through iontophoresis may provide a solution to these problems. While many previous studies have described iontophoresis for application of neurotransmitter (e.g., Cash and Yuste, 1999; for review see Curtis, 1964; Hicks, 1984), these applications are generally too slow and broad to mimic the temporal and spatial profile of endogenously released transmitters. Trussel, et al. described an application of glutamate iontophoresis with speed and localization approaching endogenous stimulation (Trussell et al., 1988). However, they suffered from inconsistencies between electrodes and used large holding currents, which limit the linearity and reproducibility of the technique.
In the following chapter, I demonstrate a novel iontophoresis technique generating a highly localized release zone with a diameter of approximately 0.1 tm. This is more than an order of magnitude smaller than any previously reported for iontophoresis, and it allows stimulation at single-synapse resolution, even after accounting for diffusion of transmitter away from the release site. Such a small electrode tip necessarily creates a high-resistance stimulation system, which poses challenges for achieving fast application. However, a commercially available, specialized amplifier with fast capacitance compensation enables responses rivaling endogenous vesicle release, with a linear response and high reproducibility.
Homeostatic Regulation of Synaptic Strength
Several recent studies have established a principle of activity-mediated homeostatic regulation of synaptic strength (Davis and Bezprozvanny, 2001; Liu and Tsien, 1995; Turrigiano et al., 1998). As excitability of a neural network increases, the strength of excitatory synaptic connections decreases to maintain a constant baseline firing rate. Similarly, as excitability goes down, excitatory synaptic connection strength increases to compensate. In cortical cultures, artificially altering excitability has been shown to induce compensatory changes in both AMPA and NMDA receptor number, as well as presynaptic release probability at excitatory terminals (Murthy et al., 2001; Watt et al., 2000). Although the majority of this work has involved perturbations to an entire culture dish, a couple of elegant studies have been able to isolate the effect to single cells. Although it did not involve any exogenous perturbations, one early study showed an inverse relationship between number of inputs to a cultured neuron and the strength of those inputs (Liu and Tsien, 1995). More recent work has used transfection techniques to
selectively reduce the excitability of isolated cultured neurons (Burrone et al., 2002). That study demonstrated an increase in synaptic input to the quieted cells. To date, no study has tried to examine homeostasis at a subcellular level, as I do here.
Activity-mediated Change in Receptor Subtype
Addition of GIuR2 to synaptic receptors
At early stages of development, AMPA-type receptors are thought to consist of heterotetramers of GluRl and GluR4 subunits. As development progresses, GluR2 subunits are added to the AMPA receptor structure, producing tetramers composed of GluRl and GluR2, or possibly GluR1, GluR2 and GluR4 (Pickard et al., 2000). The addition of GluR2 converts AMPA receptors from permeable to calcium-impermeable. Since calcium concentration is a potent intracellular signal, particularly at synapses, this change in permeability likely has important functional consequences. Each of these changes in postsynaptic receptors has been shown to be activity-dependent, in that blocking neural activity leads to slowing or abolishment of the developmental switch (Barria and Malinow, 2002; Kumar et al., 2002; Liu and Cull-Candy, 2002; Zhu et al., 2000). However, it is not known if neural activity independently triggers each of these three changes. Possibly, activity triggers one postsynaptic change, which then triggers others in a cascade; or, one developmental switch may be permissive for another.
Switch from NR2B to NR2A subunits
Hippocampal NMDA receptors are composed of two subunits: NR1 and either NR2B or NR2A. Early in development, only NRl/NR2B receptors are present in the hippocampus and other brain areas. As development progresses, the fraction of NMDA receptors composed of NR1/NR2A increases (Tovar and Westbrook, 1999). Eventually,
NR2A-containing and NR2B-containing NMDA receptors are present in roughly equal numbers, and the NR2A fraction stabilizes. NR2B-containing receptors have a channel-open time about twice as long as NR2A-containing receptors, and they therefore pass more calcium into the cell when opened (Brimecombe et al., 1997). Given the importance of calcium as a molecular signal, one would predict significant functional consequences of this switch. Indeed, knockout mice overexpressing NR2B in adulthood perform better on memory tasks than their wild-type counterparts (Tang et al.). Importantly, the insertion of NR2A is known to depend on neural activity, and it can be regulated either up or down by changes in activity (Quinlan et al., 1999; Yoshii et al., 2003).
Chapter 3 lontophoresis System Performance
Deleted:
Description of System
Mic'*elecI used an MVCS 02 (NPI Electronic. Tamm, Germany) high-speed iontophoresis amplifier to control transmitter release through the iontophoresis electrode. Although the MVCS 02 headstage is designed to hold a glass electrode directly, I found that configuration to cause excessive drift of the electrode tip, probably due to thermal fluctuations within the headstage. Instead I held the glass electrode with a standard electrode holder (Warner Instruments MEW-F15T), which I connected to the iontophoresis headstage with a 3-inch wire. Grounding was achieved with a pellet attached to the patch clamp headstage. The patch clamp amplifier and iontophoresis amplifier grounds were both connected to a common ground in the instrument rack; no separate bath ground was used for the iontophoresis.
{Deleted: I fabricated iontophoresis microelectrodes from quart glass capillary tubes
Deleted:
(O.D. = 1.0mm, I.D. = 0.7mm, Sutter Instrument Co.) pulled in a single, stage, with a Deleted:
horizontal pipette puller (Sutter Instrument Co. P-2000) These electrodes have a tip opening of approximately 0.1 [tm, based on electron microscopy performed by the puller manufacturer. When filled with 150mM glutamatic acid (pH adjusted to 7.0 with NaOH), they had a resistance of approximately I OOMO. Although the results described here were collected using quartz microelectrodes, I have also successfully fabricated
electrodes using aluminosilicate glass, which can be shaped at lower temperatures. However, I have also found that using small-diameter capillary glass (O.D. = 1.0mm, as opposed to 1.2mm or 1.5mm) is critical for electrode consistency.
Occasionally, glutamate leaked slightly from the electrode tips, as visualized by increased noise in a patch recording when placed near a synapse. However, these leaks could be eliminated with 1-2nA of positive holding current. Electrodes with a resistance of less than 80MQ tended to have larger leaks that were not controllable with holding
SDeleted
current. _I placed the electrode tip, within 1.0tm, and ideally within 0.5pm, of a synapse to avoid the slowing and broadening of transmitter flux associated with diffusion (Figure 3.2A). In certain experiments, the iontophoresis electrode additionally contained 5mM Oregon Green dye (Molecular Probes).
With resistances in the hundreds of MO, the system's time constant r =R C became an obstacle to fast stimulation. I measured a time constant of approximately 200 ins, implying that the electrode capacitance was approximately 2 nF. To mimic endogenous release, glutamate should be released in a single pulse lasting no longer than ims; unfortunately, this type of pulse would be low-pass filtered by the electrode so as to practically disappear. To help minimize this problem, I decreased R and C as much as possible. I decreased R by pulling electrodes with a short shank, as a long, thin shank increases electrode resistance. I also decreased C by lowering the extracellular solution level as much as possible without affecting the cells' viability; this modification
Deletec decreases C, since largely the submerged portion of the electrode contributes to
capacitance. To compensate for the remaining RC filtering, the MVCS 02 is equipped with positive-feedback capacitance compensation in the stimulation current. Figure 3.1 A
illustrates the improvement to the ejection response achieved with capacitance compensation.
To properly adjust the capacitance compensation, I applied a -lOnA square-wave pulse at 20Hz to the iontophoresis electrode after filling it and immersing the tip in the bath. I monitored the tip voltage on an oscilloscope while adjusting the compensation so that the voltage also described a square wave. This method also gave us a measure of the electrode resistance via the relationship V = IR. Typically the initial electrode resistance was > 500MQ, possibly due to microscopic air bubbles in the tip. At this point, I "zapped" the electrode once or twice with a -250nA pulse for 5-10s, after which the resistance would have a stable value around 100MQ. I reapplied a square wave periodically during the course of a recording session to monitor R and adjusted the compensation if necessary, but it typically varied very little over the course of several hours.
Speed of Release
Endogenous synaptic transmission is characterized by fast release of transmitter from a vesicle, which is located across the synaptic cleft from the postsynaptic receptors. Ideally, I would like the iontophoretic pulse to reproduce, as accurately as possible, the fast and highly localized properties of vesicular release. To assess the speed of ejection, I added Oregon Green fluorescent dye to the iontophoresis electrode, in addition to glutamate. Oregon Green was chosen because it has physical properties close to glutamate's: It is a small molecule with a single negative charge at physiological pH. It also has a fluorescence emission that is not pH-sensitive, so any pH changes between the electrode interior and the bath solution should not produce artifacts. The dye has a higher
molecular weight than glutamate (glutamate M.W. = 164; Oregon Green M.W. = 332), so it is expected to diffuse more slowly in the bath after ejection. The glutamate ejected from the tip will not be as spatially localized as the dye. Still an increase in molecular weight by a factor of 2 would decrease the diffusion constant by a factor of
approximately_1A which should minimally affect the results.
B
D
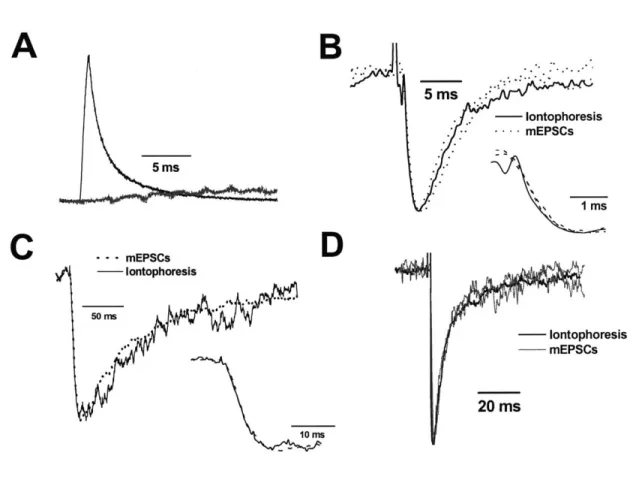
5 ms ... mEPSCs - lontophoresis 50 mns 10 ms 5ms - lontophoresis - mEPSCs 1ms -- lontophoresis mEPSCs 20 msFigure 3.1. Temporal resolution of iontophoretic application. A Fluorescence intensity over time following a ims / -50nA iontophoretic ejection of glutamate and Oregon Green, measured at the tip of the electrode (black trace). The gray trace shows the same current pulse without capacitance compensation. B, C, D Comparable time-course of iontophoretic and synaptic AMPA and NMDA receptor currents. B AMPA receptor current, locally evoked by a 1 ms iontophoretic application of glutamate (-50 nA, solid, average of 4 consecutive traces) to an isolated FM1-43 labeled synapse, overlaid with two amplitude-matched mEPSCs recorded from the same cell (dashed). C NMDA receptor current waveforms (solid; average of 4 consecutive traces; recorded in 0 Mg2+ and 5pM NBQX), locally evoked as in B, overlaid with an NMDA-only mEPSC waveform recorded from the same cell (-50 nA, dashed; average of 100 events, not the same cell as in B). Inset: Same waveforms scaled to better compare the activation kinetics of both receptor currents. D Both AMPA and NMDA receptor components, locally evoked by a 1 ms iontophoretic glutamate application (-25 nA, black, average of 4 consecutive traces; recorded in 0 Mg2+, different cell from B,C) to an isolated FM 1-43 labeled synapse, overlaid with two amplitude-matched mEPSCs recorded from the same cell (gray).
Deleted
A
Deleted:
I examined the dye concentration during a ims iontophoretic pulse at a point directly in front of the electrode tip. As shown in Figure 3. 1A, the dye concentration rises sharply and linearly for the duration of the constant-current pulse, reaching its peak 1.1 ms after the ejection begins. After the pulse is complete, the response drops quickly as dye
diffuses away from the tip, falling by a factor of e by 1.4 ms after the peak.
When this system was used to deliver glutamate to activate glutamate receptors at a postsynaptic site labeled with FM 1-43, both AMPA and NMDA receptor mediated responses could be detected (Figure 3.lB&C}. To determine whether this glutamate transient is sufficiently fast to mimic the activation of AM PA receptor during endogenous
Deleted:
synaptic transmission, I compared, spontaneous AMPA-mediated mEPSCs to Figure 2B
Deleted:
iontophoretically evoked EPSCs of similar amplitudefrom the same cell (Figure 3.1B}. Note that the rise times of the iontophoretic event is similar to the mEPSCs (20%-80%
Deleted:
rise ionto.: 0.65 ins, mEPSC avg.: 0.75 is). _Jjie falling phases of the AMPA currents
Deleted:
are similar, as well (80%-20% decay ionto.: 8.2 ms; mEPSC avg.: 5.8 ms).
Deleted:
An analogous comparison can be made for the time course of NMIA-receptor- synaptic technique ccu an endogen
mediated responses (Figure 3.1CL Endogenous and iontophoretic EPSCs match both on Deleted: Deleted:
the rising and falling phases (20%-80% rise ionto.: 7.1 ms, mEPSC avg.: 6.8 ms; 80%- NMDAcui
Deleted:
20% decay ionto.: 138 ms, mEPSC avg.: 124 ms). -The matching decay phases of the NMDArec application endogenou:
endogenous and iontophoretic responses suggest that the ejected transmitter concentration drops quickly enough that it does not lead to additional or prolonged currents, compared to endogenous events. Since modest changes in the time course of neurotransmitter concentration can lead to large changes in relative AMPA and NMDA
receptor activation (Renger et al., 2001), I also compared endogenous to iontophoretic events recorded in 0 Mg>. Both a fast-decaying AMPA component and a slowly-decaying NMDA component of EPSCs were present under these conditions (Figure 3.1D). Both components of mEPSCs and iontophoretic EPSCs are again similar, showing that the iontophoretic glutamate concentration time course is near enough to endogenous to mimic the proportion of AMPA:NMDA receptor activation.
Spatial Localization
I assessed the spatial spread of dye after ejection at several different ejection currents to determine the spatial concentration profile of glutamate. If the technique is to be useful to study isolated synapses, it must be able to stimulate synaptic receptors without activating receptors at nearby synapses. Figure 3.2B shows the peak intensity after ejection along a line drawn perpendicular to the tip at a distance of 0.5pm. This is where a dendrite would normally lie in relation to the tip during stimulation of a synapse. Typical currents used for synaptic stimulation are 100nA and smaller. As is evident from the figure, the dye concentration is 80% less than the peak concentration at a distance of about 0.5 pm from the tip.
A
B
25 nA -50
nAsca
m 0-- 100 nAline--
200 nA -6 -3 3 6 Distance (pm)C
D
Figure 3.2. Spatial resolution of the iontophoresis application. A High magnification confocal image of the tip of an iontophoretic electrode apposed to an isolated FM1-43 labeled synapse. B Maximum dye fluorescence after iontophoretic ejection of dye/glutamate mixture at varying ejection currents. Fluorescence was measured with a microscope line scan along a line perpendicular to and 0.5 ptm away from the pipette. This is the typical location of a dendrite during iontophoretic stimulation of a synaptic site. Fluorescence is in arbitrary units. C AMPA-mediated response at a series of locations separated by
1.Opm. White dots (along dendrite) indicate locations of ejection, and yellow dots (connected by line) indicate strength of AMPA response. The two white traces show representative raw responses at corresponding locations, directly over the FM-labeled site, and 8pm away. D NMDA-mediated responses (in 5jiM NBQX) at 0.7pm intervals along a path parallel to the dendrite. White traces show responses directly over the FM-labeled site, and 4.2 pm away.
Figure 3.2C shows the AMPA current in response to a 50nA pulse of glutamate for
-Deleted: different positions of the iontophoresis tip with respect to an FM-labeled synaptic site
the tip is moved away in 0.5pm increments. At a distance of 1.5pm, there is no discernible current, indicating that it is possible to resolve AMPA-mediated responses from synapses separated by at least 1.5pm. Figure 3.2D shows the same experiment in conditions allowing for the observation of NMDA-receptor-mediated current. The NMDA receptor, with its slower kinetics, can act like an integrator of low transmitter levels (Dub6 and Liu, 1999; Kullmann et al., 1999; Lester et al., 1990). It is more sensitive than the AMPA receptor to low transmitter levels and correspondingly shows a
{Deleted measurable response at a greater tip distance,
Control of Transmitter Concentration
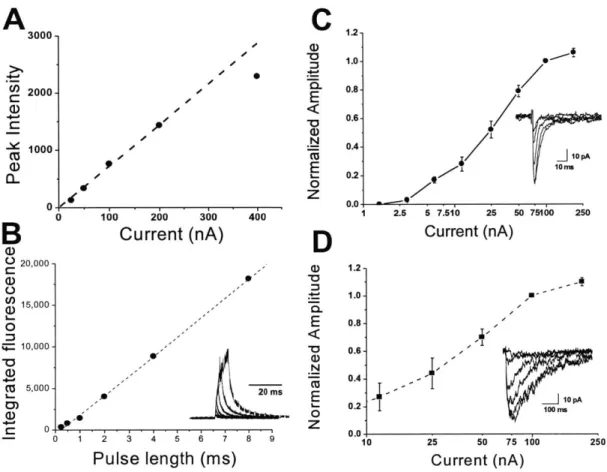
One of the most powerful features of the iontophoresis technique is the ability to precisely control the amount of glutamate applied to the synapse. Figure 3.3A shows that the amount of dye, and therefore glutamate, ejected is linear over the range of 25-200nA. Thus, a linear change in the ejection current translates into a proportional change in the quantity of neurotransmitter ejected. At higher currents, the iontophoresis device cannot achieve the necessary driving force through the high-resistance electrode. In our hippocampal culture system, 200nA is more than sufficient to saturate the response of a single synapse, so this presents no problem. However, NPI Electronic produces a higher-voltage device that can presumably extend this linear range to higher ejection currents, if the experimental situation were to demand it. Figure 3.3B shows that the apparatus is linear with respect to ejection time, as well. At a constant ejection current, the amount of dye ejected is proportional to the ejection time. Since I examined times up to 8 ins, diffusion of dye away from the tip could occur to a significant extent during the course of ejection. For these long ejection times, peak dye concentration was therefore no longer
proportional to ejection time. Instead, I measured integrated dye fluorescence over 30 ms during and after ejection, which measured the total amount of dye during the response that flowed past a point directly in front of the tip.
or 100 200 300 Current (nA) y
C
a ) E ~0 a) N 20 s 0 z 2 3 4 5 6 7 8 9Pulse length (ins)
12- 1.0- 0.5- 0.6- OA- 0.2-0.0 1.2- 1.0- 0.8- 0.6- 0.4-/LI 7S0A 0 rr 2.5 5 7.510 25 Current (nA) 0.2 10 50 75100 pA so0 100 nwm 25 50 75 100 Current (nA) 250
Figure 3.3 Linearity of iontophoresis ejection. A Peak fluorescence intensity during the first 2 ms after ejection, at a point 0.5rn in front of the pipette, from raw traces in Figure 3.2B. Fluorescence intensity is in arbitrary units at several ejection currents ranging from -25 to -400 nA, applied for 1 ms. Dashed line is a least-squares fit to the points between -25nA and -200nA. B Integrated fluorescence at a single point in front of the tip, with an ejection current of -8nA and ejection times ranging from 0.25 to 8 ms. Dashed line is a least-squares fit to all points. Inset shows raw traces. C Dose-response curve for AMPA-mediated responses. Inset shows raw traces. Note the log scale. D Dose-response curve for NMDA-mediated responses (in 5 pM NBQX). Inset shows raw traces.
With the ability to control transmitter concentration, it is possible to measure kinetic properties of synaptic receptors without removing them from the rest of the cell. Dose-response curves for iontophoretic glutamate application to AMPA and NMDA receptors are shown in Figure 3.3C&D. Note that the AMPA and NMDA receptors have a similar
A
3000-2000. 1000. CU Q) 0-0B
20,000-C) 15,000-a)' L.. 0 10,000-CU 5,00 0 -0 B,-. 0 1t
EC50, which cannot be predicted from Kd values for the two receptor types. Particularly
in the case of the NMDA receptor, the EC50 is controlled by the interaction between the
receptor's kinetic parameters and the fast glutamate transient (Dube and Liu, 1999). Therefore, to understand the response to endogenous transmission, it is important to use a technique such as iontophoresis that can apply glutamate with a similar time course to vesicle release.
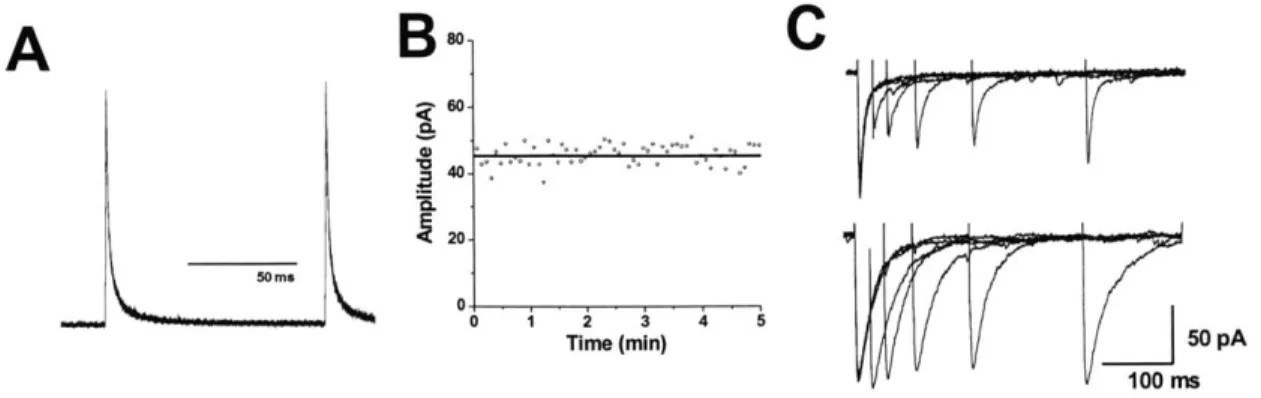
The iontophoresis system can release pulses of glutamate at rates of up to 100Hz, and the pulse sizes are reliably identical at rates up to 10Hz (Figure 3.4A). At rates above 10Hz, I have found that there can be interaction between pulses, such that a second pulse is consistently larger or smaller than the initial pulse. The repeatability of release over
Deletec
short time scales lends itself to the study of fast receptor desensitization (Figure 3.4B), Multiple
The consistency of iontophoretic release is useful for measurement of many other receptor properties. For example, Figure 3.4C shows the response of a single synapse to two different transmitter concentrations over a period of 10 minutes. Since the amount of glutamate applied is constant from trial to trial, the variation in the response is likely due to stochastic properties of channel opening. One could perform noise analyses on these data to calculate parameters such as number of channels per synapse and opening probability (Sigworth, 1981).
A
1 50 meB0
C
0 0 im i 4 Time (min) 50 pA 100 msFigure 3.4 Reproducibility of iontophoresis ejection. A Dye fluorescence directly in front of the pipette during two successive ejections of -32 nA, separated by 100 ms. B Stability of the response to stimulation of an isolated FM-labeled site to repeated -50 nA applications of glutamate at 0.2 Hz. C Desensitization of AMPA receptors, shown with paired pulses of -100 nA glutamate at varying time intervals (20, 40, 80, 160, 320 ms). Top: control conditions; Bottom: in the presence of 50 ptm cyclothiazide, which blocks desensitization of AMPA receptors.
Chapter 4 Developmental Changes at Synapses in
Culture
Presynaptic Function: Vesicle Turnover
I assessed presynaptic release by staining with the fluorescent dye FM. FM dye specifically stains endocytotic vesicles and is commonly used to label and monitor neurotransmitter vesicles at synapses (Cochilla et al., 1999). In the presence of dye, cells are stimulated to release vesicles. After their release at presynaptic terminals, neurotransmitter vesicles are quickly taken up again via endocytosis, along with any bound FM dye. The cells are then washed in dye-free solution containing tetrodotoxin (TTX), which blocks all action potentials and-therefore-most vesicle release. The dye-labeled terminals are then stable in the presence of TTX for many hours.
high-K+ FM 4-64
exocytosis
-~
Figure 4.1 Cartoon outlining the process of FM staining of
endocytosis
vesicles. After (Ryan et al., 1993).
Two stimulation protocols are commonly used to stain synapses with FM: low-intensity stimulation for staining only the docked or "readily-releasable" vesicles; or high-intensity stimulation for staining the entire recycling vesicle pool (Murthy et al., 2001; Murthy et al., 1997). Low-intensity stimulation consists of a few to a few dozen electrical pulses, causing an equivalent number of action potentials in the cultured neurons. This protocol stains each synapse in proportion to its individual probability of release (P)-the probability per action potential that the terminal releases a vesicle (Dobrunz and Stevens, 1997). High-intensity stimulation is performed with high-frequency electrical pulses or by immersing the neurons in a depolarizing ionic solution (as I do in this study) (Cochilla et al., 1999). Although I am interested in the Pr at each synapse, the high-intensity protocol stains the entire vesicle pool and is not a direct measure of Pr. High-intensity stimulation has two key advantages for my experiments, however: 1) The stained puncta are several times brighter than with low-intensity stimulation, which is helpful for positioning the iontophoresis electrode to stimulate
releasable vesicle stained vesicle wash TTX
individual synapses. 2) High-intensity stimulation can be done via solution changes, while low-intensity stimulation requires electrodes in close proximity to the cell culture. These stimulation electrodes obstruct access for the voltage-clamp and iontophoresis electrodes that I need for single-synapse recording, increasing the practical difficulties of the experiments. Fortunately, the release probability, the docked vesicle pool size, and the full recycling vesicle pool size have been shown to be in direct proportion to one another at hippocampal synapses (Murthy et al., 1997; Murthy and Stevens, 1999). A key assumption throughout this thesis, then, is that the FM intensity at an individual punctum is a reliable indicator of P,.
A
D
25.000 E 20.000 :t 15.000 -- Control 10.000 ~--TTX C. 5.000 0.0008DIV 10DIV 15DIV
70000 60000T 50000 z 40000 E 2 30000 20000 10000 0
8DIV 1ODIV 15DIV
F
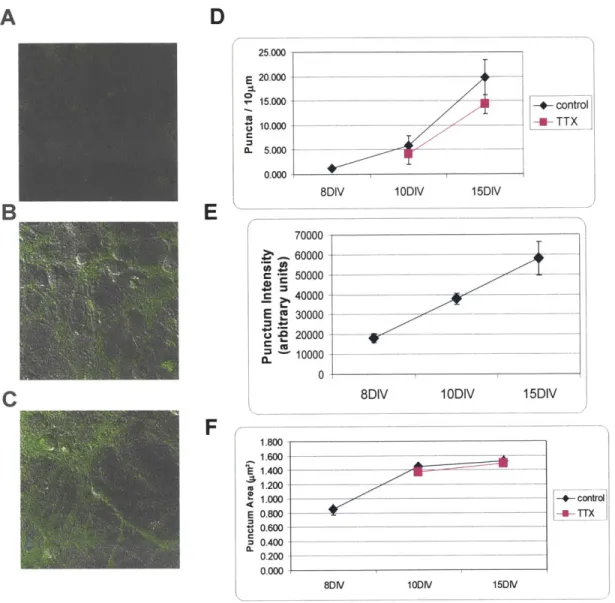
1.800 1600- S1.400-1.200 1.000 -4 control E 0.800TT 0.600 0.400 0. 0.200 0.000 8DV 10DIV 15DW/Figure 4.2 Developmental Increase in FM Staining. A, B, C Typical hippocampal cell cultures stained with FM 1-43 dye to label individual synaptic puncta. A 8 DIV B 10 DIV C 15 DIV D Developmental increase in FM puncta density, in control conditions and in the presence of TTX (applied starting from 7 DIV) E Developmental increase in FM intensity per punctum F Mean area of puncta, quantified with FM staining, in control conditions and TTX (applied from 7 DIV)
Functional maturation of synapses occurs primarily between 8 and 15 days in vitro (DIV) in hippocampal cultures. The number of synapses with vesicles undergoing endocytosis and the number of vesicles per synapse increases rapidly during this period. Figure 4.2 shows the corresponding increases both in puncta density and intensity per punctum. The most marked increase is in the density of mature synapses, which
increases more than fivefold. Normalizing for the length of dendrite controls for the fact that total dendrite length is increasing steadily as the culture matures. Figure 4.2E also shows that the mean FM intensity per punctum also increases during development. Since I assume FM intensity is proportional to Pr, each postsynaptic site is stimulated more and more frequently with glutamate as the neurons mature. Considering also the increasing density of puncta, it is evident that the amount of excitatory input to a given length of dendritic branch increases rapidly during development.
I also monitored the mean puncta size through development (Figure 4.2F). In contrast to density and intensity, size is relatively constant. Mean puncta size is constant from 10-15DIV, when the largest increase in density occurs. This is consistent with previous work indicating that synapse size is constant through development. The modest increase from 8-10DIV may be an artifact of the increasing intensity. As individual puncta become brighter overall, their dimmer edges may become visible above background resulting in apparently larger puncta.
Figure 4.2D&F also illustrate the effect on presynaptic maturation of blocking activity. I used tetrodotoxin (TTX) to block spontaneous electrical activity in the cultures starting at 7 DIV. At 10 DIV and 15 DIV, I measured puncta density and mean area. Mean punctum area after TTX treatment is identical to control conditions. The density also increases rapidly, with a time course similar to control conditions. These data show that density does not quite increase to control levels after eight days of TTX treatment (1 5DIV), although this difference is not statistically significant. Together, these results suggest that activity is not necessary for presynaptic maturation.
It is a welcome observation that vesicle release matures similarly in the presence and absence of activity, as it makes subsequent experiments easier to interpret. I am interested in the coordination of pre- and postsynaptic maturation by neural
activity-specifically excitatory activity at individual synapses mediated by release of glutamate vesicles. If a subsequent experiment shows that blocking activity prevents or delays a postsynaptic developmental event, I can be sure that I am observing a failure of pre and postsynaptic coordination. Conversely, if blocking activity had blocked presynaptic maturation, a failure of postsynaptic development could be interpreted either as a failure of coordination or as a coordinated failure of the prc/postsynaptic unit.
Postsynaptic Properties: GIuR2 Insertion
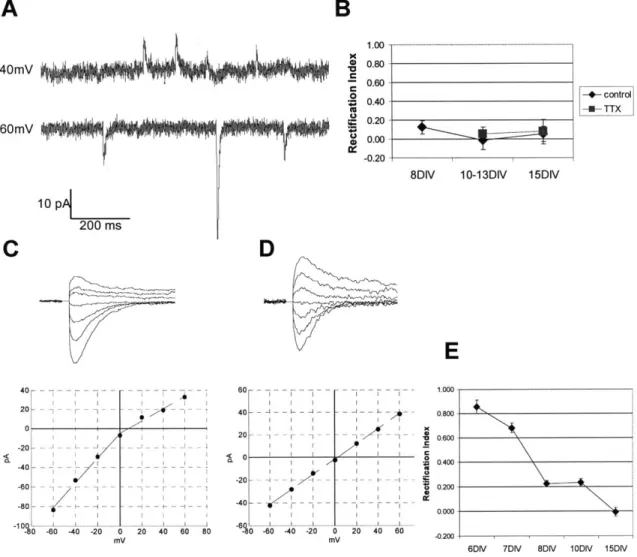
The postsynaptic developemental change that I studied most extensively was the insertion of GluR2 subunits into AMPA receptors. I monitored this insertion by examining the rectification of AMPA-mediated events. AMPA receptors without the GluR2 subunit are inwardly rectifying-they conduct inward (negative) current much better than outward. AMPA receptors that do contain GluR2 are non-rectifying-they have a linear I-V relationship. Typically, the degree of rectification is quantified with a rectification index (RI), derived from the ratio of peak AMPA current at a positive holding potential to peak AMPA current at a negative holding potential (Kumar et al., 2002). I use +40 mV and -60 mV holding potentials here. Since the AMPA receptor channel has a reversal potential of approximately 0 mV in the recording conditions used here, the maximum possible ratio-achieved when the I-V curve is perfectly linear-is about 0.66 (40/60). I define RI here as [1 - (I+40/-60) / 0.66] An RI of zero indicates that
all of the AMPA receptors contributing to a conductance contain the GluR2 subunit. As the fraction of AMPA receptors without GluR2 increases, the RI increases toward one.
8DIV 10-13DIV -4---- control -m-r X 15DIV
E
40- 20--20 -40 -60k -80 10Q1 0 -80 -40 -20 0 m- 60-40 20 -A ---20 --20 40 80 80 ~1 ~2 - 4 80 -40 A -20 0 my _- -4 I -KY> T ----2 I I - --0 p C i 1.000 0.800 0.600 0.400 0.200 0.000 -0.200 7 6D[\/ 7D[\/ BDKI 10DIV 150r'/Figure 4.3. Developmental time course of GluR2 receptor insertion. The amount of GluR2 present at synapses was assessed using the ratio of conductances at +40mV and -60mV. Complete rectification corresponds a rectification index (RI) of 1, while no rectification is an RI of 0. A Rectification in whole cells was quantified by the RI of the mean mEPSC at +40 and -60mV. Sample traces shown are from a 15 DIV cell. B Between 8-15 DIV, when mEPSC's could be recorded, there was essentially no rectification, indicating the presence of GluR2 at nearly every synapse, both in control conditions and after treatment with TTX from 7 DIV. C,D Rectification could be quantified earlier at single terminals using iontophoretic stimulation while holding the cell at positive and negative holding potentials. C Sample traces and I-V curve for a typical synapse at 6 DIV. D Sample traces and I-V curve for a typical synapse at 10 DIV. E Summary data showing that the majority of change in RI occurs before 8 DIV.
I first assessed rectification by comparing the mean amplitudes of mEPSC's recorded at -60mV and +40mV. I used the ratio of these amplitudes to determine RI for a cell
A
+40mV -60mV 10pL
200 msB
C) 0 cc C .9 12 1.00 -- - 0.80-0.60 0.40--0.20-C
0
(Figure 4.3A). A comparison of cells ranging in age from 8-15 DIV shows surprisingly little change in RI (Figure 4.3B). From 10-15 DIV, the RI is approximately equal to zero, indicating that GluR2 is present in all or nearly all AMPA receptors. Even at 8 DIV, RI is equal to 0.13, indicating that GluR2 is present in most AMPA receptors.
Therefore, if there is a developmental increase in GluR2 fraction in this culture system, it must occur primarily before 8 DIV. It was difficult to obtain reliable data on rectification before 8 DIV using mEPSC's. Although recordings from cultures younger than 10 DIV contain numerous NMDA-only "silent" mEPSC's, AMPA-mediated mEPSC's are rare. AMPA-mediated mEPSC's in 8 DIV cultures occur at a rate of approximately two per minute, so even measuring mEPSC rectification at that age required exceptionally long data records.
To measure RI at younger ages, I used glutamate iontophoresis to apply neurotransmitter directly to synapses. With this technique, I could step the holding potential from -60 to +40mV while stimulating with glutamate, thereby measuring the RI at a single synapse. Figure 4.3 shows the results of stimulating several synapses in several cells at different developmental ages, starting at 6 DIV. It is evident that the youngest cultures do display substantial AMPA rectification, indicating a lack of GluR2.
These data show that GluR2 does increase developmentally in these cultures; the majority of GluR2 incorporation occurs between 6-8 DIV. The process is substantially complete before 10 DIV, before the largest changes in presynaptic release measured by FM. Before I observed this result, one plausible theory was that maturation of presynaptic vesicle release allows the postsynaptic cell to sense activity, leading to changes in receptor subtype. This theory seems to be less likely, since GluR2 seems to
be present at most synapses expressing mEPSC's at ages before much FM staining is visible. As a further test of whether GluR2 insertion might be driven by activity, I
examined mEPSC rectification in cells treated with TTX to block activity. After treating with TTX from 7 DIV onward, GluR2 insertion appears to proceed normally (Figure 4.3B). From 10-15 DIV GluR2 is present at maximal levels, identical to the control conditions.
Postsynaptic Function: AMPA Conductance
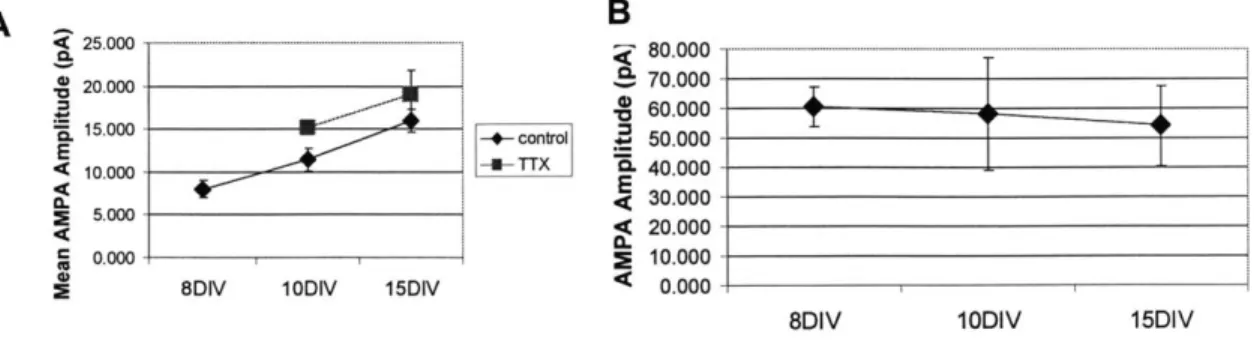
I also looked for any developmental changes in the amplitude of AMPA-mediated
currents, to see if they might occur on a similar time scale to changes in presynaptic release. I followed the mean AMPA mEPSC amplitude from 8-15 DIV (Figure 4.4). It increases consistently, approximately doubling over this time period. This is the same time period over which I found using FM dye that presynaptic release increases most rapidly. Thus, presynaptic release and postsynaptic AMPA strength are two properties that might be coordinately regulated, perhaps in an activity-mediated process. The remainder of this thesis is concerned largely with dissecting the features of this relationship. A - B 25.000 - -- . --... 20.000 70.000 60.000 ---15.000 -- control 50.000 E 10.000 - -- 40.000 ____________________ ~30.000 S5.000 - ~2.0 L.< 20.000 0.000 - 10.000
8DIV 10DIV 15DIV 0.000
8DIV 10DIV 15DIV
Figure 4.4 A Average AMPA-mediated mEPSC size measured from 8-15 DIV, showing a doubling in
mean event size. Treatment with TTX from 7 DIV causes a further increase. B Response to a fixed glutamate pulse averaged over several synapses in several cells from 8-15 DIV. Note the small decrease in
This developmental increase in mEPSC size could be due to an increase in the transmitter released presynaptically, an increase in the postsynaptic AMPA conductance, or some combination of the two. I attempted to distinguish these possibilities using iontophoresis to stimulate directly the postsynaptic receptors. By looking at the postsynaptic current in response to a fixed amount of glutamate, I could assess any changes in postsynaptic conductance specifically. Figure 4.4 shows the response to a fixed -32nA, 0.5ms glutamate pulse averaged over a number of synapses from several cells at 8, 10, or 15 DIV, the developmental period when mEPSC's are known to increase in magnitude. Interestingly, the average AMPA current measured postsynaptically with iontophoresis does not change significantly over this time period, and it may even decrease slightly. Thus, the developmental increase in mEPSC size is due to an increase in presynaptic quantal strength.
It is important to note that this increase in presynaptic strength is distinct from the presynaptic increase in vesicle pool size visualized with FM and described above. The increase in presynaptic strength visualized with FM is presumed to reflect an increased P, i.e. the synapse is stronger because vesicles are released more frequently in response to action potentials. However, mEPSC's are thought to represent single vesicle release events, so a presynaptically-mediated increase in mEPSC size involves an increased amount of transmitter release per vesicle.
Blocking activity with TTX starting at 7 DIV causes an increase in mEPSC amplitude measured 3 days later and a further increase after 8 days (Figure 4.4). This increase is consistent with homeostatic regulation of excitability that has been described recently in
several systems. As network activity is reduced, the strength of excitatory synapses increases to try to compensate for the lack of excitatory input.
Postsynaptic Properties: Other
When I began this work, I examined two other postsynaptic developmental changes to see if they happened with a similar time course to presynaptic maturation: insertion of NR2A subunits into NMDA receptors, and the flop/flip transition in functional AMPA receptors. Both of these transitions proved difficult to characterize in the culture system for various technical reasons described below. The interaction between presynaptic strength and postsynaptic AMPA amplitude proved to be a fertile area for further exploration, so I did not pursue the NR2A orflop/flip transitions.
A classic developmental change in pyramidal neurons is an increase in the fraction of NR2A subunits in NMDA receptors. These subunits endow the NMDA receptor with faster decay kinetics, so it passes less calcium into the postsynaptic cell with each opening event. I tried to identify the addition of NR2A at synapses by examining the sensitivity of mEPSC's to ifenprodil, a drug which selectively blocks NMDA receptors containing the NR2B subunit. Unfortunately, under the 0 Mg2
+ recording conditions I
was using in order to detect NMDA currents in mEPSC's, all NMDA receptors appeared to be in a partially desensitized state. Ifenprodil, as well as presumably blocking NR2B-containing receptors selectively, also seemed to remove the global baseline densensitization. This combination of effects produced results that I could not interpret quantitatively. One potential workaround for this problem, had I chosen to pursue it, would be to use additional pharmacologic agents known to block NMDA desensitization.
As an alternative to ifenprodil sensitivity, it is also theoretically possible to identify the contribution of NR2A subunits to NMDA-mediated currents directly from the faster decay kinetics. In practice, this is often difficult because the conditions used to record NMDA-mediated mEPSC's also unmask random NMDA channel openings throughout the cell, greatly increasing background noise. NMDA-mediated mEPSC's are themselves small and noisy (due to the intrinsic stochastic variations in NMDA channel gating), so even finding mEPSC's in the current recording is a challenge, let alone extracting their decay times. Iontophoretic application of glutamate can get around some of these issues by evoking an event with a known start time, and by allowing repetitive stimulation of the same receptors to average out stochastic variation. I use this technique successfully to measure NMDA decay time at individual synapses (see next chapter), but I have not systematically characterized the developmental time course of NR2A addition in the culture system.
The final postsynaptic change I attempted to follow was the transition of AMPA receptor subunits from the flop to flip forms. This change occurs via a posttranslational modification of the AMPA subunit mRNA transcript, before the protein is synthesized. This modification is known to occur more frequently as development progresses. Functionally, it subtly changes the kinetics of the receptor and may also affect the regulation of insertion and removal of AMPA receptors into the cell membrane. The flop/flip transition has not been well-studied physiologically in intact cells, perhaps partially due to the experimental difficulties in doing so. The standard method for differentiating the flop and flip states is to use the drug cyclothiazide (CTZ), which selectively blocks desensitization of receptors containing flip subunits. After treating
with CTZ, the decay of AMPA mediated currents changes from a single exponential to a sum of 2-3 exponentials. Looking for a developmental increase in flip-type subunits amounts to looking for a developmental change in the parameters of these exponentials, which I found difficult to quantify. An additional problem with these experiments is that, once applied, CTZ takes at least thirty minutes to wash out, severely limiting the number of experiments that can be done with each culture coverslip. Once it was obvious that the effects of CTZ did not change dramatically over development, I chose not to spend any more patience or culture resources in this experimental direction.
70000 60000 50000 40000 E 30000 _ _ _ _ _ _ _ _ _ 10000 a 0 1.00 .3 0.80 0.60--08 0.40 -0.20 20.00 -0.20-CL 20000 18.000 16.000-U) 14.000 1 2.000 E 10.000 8.000 6.000 .4.000 C 2.000-* 0.000-80.000 -__ _ _ _ _ _ _ _ _ 7C 70.000 .60.000-5 0.000-*4 0.0 00-< 301*000 _ _ _ _ _ _ _ _ _ _ 4 20.000 -_ _ _ _ _ _ _ _ _ _ _ _ =10.000 -___________________ S0.000 - ____________________
8DIV 1ODIV 15DIV
Figure 4.5 Correspondences between pre and postsynaptic developmental events. This figure aligns data
Possible Pre/Post Interactions
In Figure 4.5, I align the developmental timecourses reported in the previous sections. This chart can suggest which properties might or might not be coordinated between the pre and postsynaptic sides of the synapse. Specifically, I would look for postsynaptic developmental changes that happen over the same time scale as presynaptic maturation. I intentionally chose the period 8-15 DIV, since this is the time frame when presynaptic terminals in culture are known to rapidly increase their Pr. This fact is confirmed by the observed increase in FM staining intensity.
The next plot to consider is the insertion of GluR2 subunits to AMPA receptors, quantified by the RI. Although this process is known to be activity-dependent in several systems, it does not here appear to depend on mature presynaptic vesicle release. Therefore I do not expect to find any relationship between presynaptic strength and GluR2 content at individual terminals.
The final two plots are the most intriguing and deserving of closer study. I have shown a developmental increase in average mEPSC amplitude, which reflects properties of both pre and postsynaptic sides of the terminal. The iontophoresis response, reflecting postsynaptic strength only, is constant or decreases slightly over this developmental period, implying that the presynaptic side must increase to produce an overall increase in mEPSC amplitude. The mEPSC amplitude reflects quantal event strength, which is independent of Pr, so I tentatively assume that there is an increase in quantal glutamate content over development. In the next chapter, I examine the relationships between presynaptic strength-quantified by FM intensity, reflecting Pr-and postsynaptic glutamate currents. It is important to keep in mind that while Pr is a very important component of presynaptic strength, it is likely not the only component. Other factors,
such as quantal glutamate content, may also contribute, but I do not have the experimental tools here to measure those factors at single terminals.
Chapter 5 Pre/Post Synaptic Interactions at Individual
Synapses
Overview of Technique
The experiments described in this chapter all involve correlating the presynaptic strength at an individual terminal with the postsynaptic electrophysiological properties at the same or nearby terminals. Figure 5.1 summarizes the basic techniques I used to measure these values. Briefly, a culture coverslip was initially stained with FM 4-64 dye using high-K+ stimulation to visualize synaptic puncta. Then, a morphologically pyramidal neuron was selected for whole cell patch clamp based on its transmitted light image. Next, I patched the cell and held it under whole-cell voltage clamp using a patch solution containing Alexa 488 dye. The dye quickly diffuses to fill the dendritic tree and allows visualization of branches up to a few hundred microns from the soma. At this point, I saved a high-resolution fluorescence overview image showing both the dendritic tree and synaptic puncta. I chose one of the puncta to stimulate and brought the iontophoresis electrode directly to that punctum. I stimulated that terminal with glutamate while altering the holding potential of the voltage clamp to measure various synaptic properties, as I describe elsewhere. For each punctum that I stimulated, I saved for later reference another image of the electrode positioned adjacent to that punctum. I repeated this process with as many different puncta as I could until I lost the patch or broke the iontophoresis electrode by crashing it into the bottom of the chamber. Later, I
analyzed offline the high-resolution overview image using custom-written scripts in Matlab to identify and measure the intensity of individual puncta. By comparing this image with the reference images of the iontophoresis electrode next to each stimulated punctum, I could accurately identify the stimulated puncta and correlate their intensities with their measured electrophysiological properties. The initial high-resolution overview image was used for all FM intensity measurements, because the FM dye bleaches quickly with repeated imaging.
B A D C E glutamate nidlw -19nA
20
5 rnsFigure 5.1 Summary of Techniques. A Sample experimental preparation: FM 4-64 dye (red) stains individual terminals, while a single patched neuron is filled with Alexa 488 dye (green) to visualize its dendritic tree structure. B Higher magnification image (white box in (A)). The yellow arrow marks the terminal chosen for stimulation with iontophoresis. C Image in (B) after processing with image enhancement and segmentation algorithms. D The glutamate iontophoresis electrode is brought to within 1 mm of a terminal. (See scale bar in (B).) E A negative current pulse is applied to the iontophoresis electrode to eject a fixed amount of glutamate. The blue current is recorded in the voltage-clamped postsynaptic neuron. It is a typical response mediated by AMPA receptors. Unless otherwise noted, a -32 nA pulse applied for 0.5 ms is used throughout this work.