Weak-Lined T Tauri Star System HD 98800
The MIT Faculty has made this article openly available. Please share
how this access benefits you. Your story matters.
Citation Kastner, Joel H. et al. “The Coronal X-Ray Spectrum of the Multiple Weak-lined T Tauri Star System HD 98800.” The Astrophysical Journal 605.1 (2004): L49–L52.
As Published http://dx.doi.org/10.1086/420769
Publisher IOP Publishing
Version Author's final manuscript
Citable link http://hdl.handle.net/1721.1/71920
Terms of Use Article is made available in accordance with the publisher's policy and may be subject to US copyright law. Please refer to the publisher's site for terms of use.
arXiv:astro-ph/0403062v1 2 Mar 2004
The Coronal X-ray Spectrum of the Multiple Weak-Lined T Tauri
Star System HD 98800
Joel H. Kastner1 , David P. Huenemoerder2 , Norbert S. Schulz2 , Claude R. Canizares2 , Jingqiang Li1and David A. Weintraub3
ABSTRACT
We present high-resolution X-ray spectra of the multiple (hierarchical quadru-ple) weak-lined T Tauri star system HD 98800, obtained with the High Energy Transmission Gratings Spectrograph (HETGS) aboard the Chandra X-ray Ob-servatory (CXO). In the zeroth-order CXO/HETGS X-ray image, both principle binary components of HD 98800 (A and B, separation 0.8′′) are detected;
com-ponent A was observed to flare during the observation. The infrared excess (dust disk) component, HD 98800B, is a factor ∼ 4 fainter in X-rays than the appar-ently “diskless” HD 98800A, in quiescence. The line ratios of He-like species (e.g., Ne ix, O vii) in the HD 98800A spectrum indicate that the X-ray-emitting plasma around HD 98800 is in a typical coronal density regime (log n∼< 11). We conclude that the dominant X-ray-emitting component(s) of HD 98800 is (are) coronally active. The sharp spectral differences between HD 98800 and the clas-sical T Tauri star TW Hya demonstrate the potential utility of high-resolution X-ray spectroscopy in providing diagnostics of pre-main sequence accretion pro-cesses.
Subject headings: stars: individual (HD 98800, TW Hya) — stars: pre-main sequence — stars: coronae — X-rays: stars — accretion, accretion disks
1
Chester F. Carlson Center for Imaging Science, Rochester Institute of Technology, Rochester, NY 14623; jhk@cis.rit.edu
2
MIT Center for Space Research, 70 Vassar St., Cambridge, MA, 02139
3
1. Introduction
The Einstein and ROSAT missions established the ubiquity of X-ray emission from low-mass, pre-main sequence (PMS) stars. These early X-ray observations, and subsequent observations by the ASCA satellite X-ray observatory, left unsolved the fundamental problem of the physical origin of the X-ray emission, which could be solar-type coronal activity, star-disk interactions, or some combination of these mechanisms. Much of the X-ray data pointed to the likely importance of magnetic activity (Feigelson & Montmerle 1999). To make further progress, it is necessary to determine the temperature distributions, densities, and elemental abundances of the X-ray-emitting plasmas of PMS stars, so as to provide constraints on models of X-ray emission from coronal and star-disk interactions and to compare with, e.g., the physical conditions characterizing well-established stellar coronal X-ray sources (such as RS CVn systems and other close binaries).
With the advent of X-ray gratings spectrometers aboard the Chandra X-ray Observatory and the XMM-Newton satellite observatory, astronomers are now beginning to explore the X-ray spectral characteristics of PMS stars. In this regard, the TW Hya Association (TWA) represents an especially useful young PMS cluster. The TWA is a group of about 30 PMS stars (Zuckerman et al. 2001 and references therein) located only ∼ 50 pc from the Sun and far from the nearest star forming clouds (Kastner et al. 1997). Its age (∼ 5 − 10 Myr; e.g., Weintraub et al. 2000, Zuckerman et al. 2001) likely corresponds to the epoch of Jovian planet formation in the early solar system. The TWA’s proximity, relatively large ratio of X-ray to bolometric luminosity (log LX/L⋆ ∼ 3, where LX is measured within the ROSAT
spectral bandpass of 0.1 to 2.4 keV; Kastner et al. 1997), and lack of cloud absorption lead to uniformly high X-ray fluxes among its member stars. In terms of ROSAT X-ray spectral properties, the TWA appears to represent a transition stage between cloud-embedded PMS stars and the zero-age main sequence (Kastner et al. 2003).
The CXO/HETGS spectrum of TW Hya itself is perhaps the most extreme and in-triguing of the many Chandra/HETGS spectra of X-ray active stars obtained to date, in several key respects (Kastner et al. 2002): (1) Ne is highly overabundant and Fe severely underabundant, even in comparison with stars exhibiting strong coronal abundance anoma-lies; (2) the temperature distribution derived from fluxes of temperature-sensitive emission lines is sharply peaked, at log T = 6.5; (3) perhaps most significantly, density-sensitive line ratios of Ne ix and O vii indicate plasma densities log n ∼ 13. This is more than an order of magnitude larger than density estimates similarly obtained for coronally active late-type stars.
TW Hya remains the TWA’s only unambiguous example of an actively accreting (i.e., “classical”) T Tauri star. Given the evidence that TW Hya likely is surrounded by a
cir-cumstellar disk from which it is still accreting (e.g., Muzzerole et al. 2000), we used the Chandra/HETGS results to explore the hypothesis that X-ray emission from classical T Tauri stars might originate from accretion streams that connect the circumstellar disk to the star (Kastner et al. 2002). Both the density range and the characteristic temperature of X-ray emission obtained from modeling the CXO/HETGS spectrum are consistent with recent models of magnetospheric accretion onto T Tauri stars (Kuker, Henning, & Rudiger 2003).
In this Letter, we report on the results of CXO/HETGS observations of a second well-studied TWA member, HD 98800 (TV Crt). HD 98800 is a hierarchical quadruple, weak-lined T Tauri Star (wTTS) and is one of the best examples of a solar-mass “Vega-type” (infrared excess) system (Zuckerman & Becklin 1993; Sylvester et al. 1996; Soderblom et al. 1996, 1998). HD 98800 is a visual double with a separation of ∼ 0.8′′. Each visual component
is itself a spectroscopic binary, and one of these (HD 98800B) is double-lined (Soderblom et al. 1996). Although the HD 98800B binary system harbors a dust disk, the system is apparently non-accreting; models indicate that the dust disk has an inner gap extending to ∼2 AU (Prato et al. 2001). The HD 98800 system displays an X-ray luminosity similar to that of its fellow TWA member TW Hya (Kastner et al. 1997). Given that HD 98800 does not appear to be accreting, it makes an excellent target for further investigation into the origins of X-ray emission from PMS stars with CXO/HETGS.
2. Observations
We observed HD 98800 with Chandra/HETGS for 98.9 ks on 2003 March 7 (observa-tion identifier 3728) in the default configura(observa-tion (timed exposure, ACIS-S detector array) and under nominal operating conditions. Data were re-processed with Chandra Interactive Analysis of Observations (CIAO; version 3) software to apply updated calibrations, and events were cleaned of the detector artifacts on CCD 8 (“streaks”). We applied subpixel event position corrections to the zeroth-order events, following an algorithm for CXO back-illuminated CCD data described in Li et al. (2003). Spectral responses were generated with CIAO; corrections were also made for ACIS contamination. Lines were measured with ISIS1
(Houck & DeNicola 2000) by convolving Gaussian profiles with the instrumental response, and emission measure and abundances were modeled with custom ISIS programs (see, e.g., Huenemoerder et al. 2003b, for a detailed description of the technique).
The resulting Chandra/HETGS spectral image of the HD 98800A/B binary yielded 5163
1
zeroth order counts, 4099 first order medium energy grating (MEG) counts, and 1336 first order high energy grating (HEG) counts. The integrated flux (1.5-25 ˚A) obtained from the first-order MEG and HEG data is 2.5 × 10⁻¹²ergs cm−2s−1 (1.6 × 10⁻³photons cm−2s−1),
corresponding to a luminosity Lx= 6.9 × 10 29
ergs s−1 at the distance to HD 98800 (D = 48
pc; Favata et al. 1998).
3. Results
3.1. Zeroth-order image and light curve
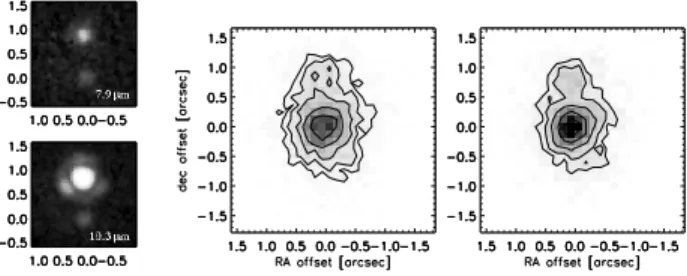
Zeroth-order CXO/HETGS images of HD 98800, before and after applying subpixel event position corrections, are presented in Fig. 1, alongside Keck Telescope images obtained in the thermal infrared (Prato et al. 2001). The primary components (HD 98800A and B) are well resolved in the zeroth-order image, following event position correction. In addition, light curves of the zeroth order sources and nearby background demonstrate that component A flared during the course of the observation (Fig. 2), while component B did not display measurable variations in count rate. Prior to the onset of the flare, the CXO/HETGS count rate of HD 98800A was a factor ∼ 4 larger than that of HD 98800B. Fig. 2 demonstrates that the HD 98800A flare was seen predominantly in hard (< 7 ˚A) X-rays.
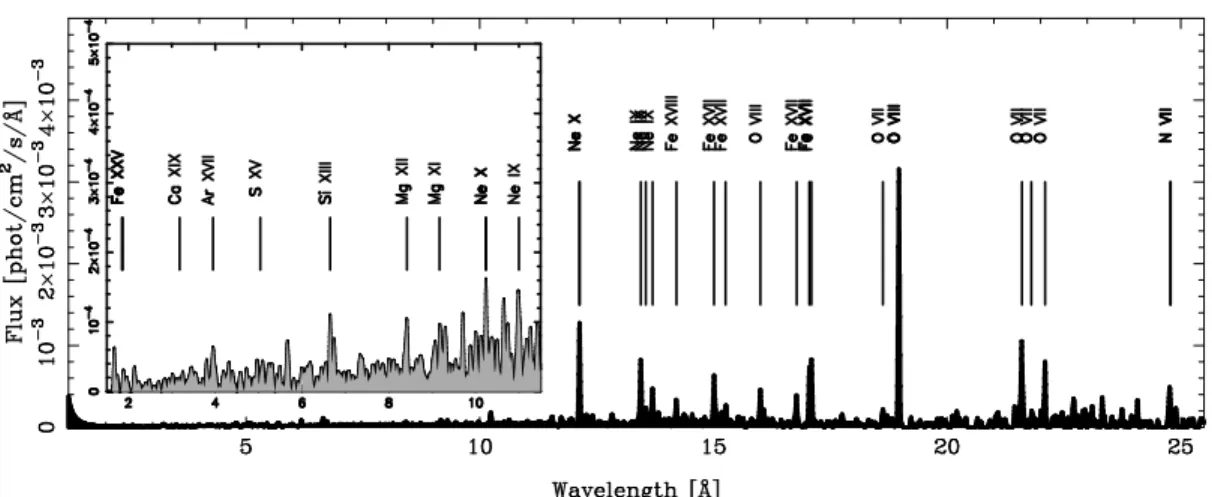
3.2. First-order (MEG+HEG) spectrum In Fig. 3 we present the spectrum of HD 98800A+B2
from 2 ˚A to 25 ˚A. In the range from 12 ˚A to 25 ˚A, the spectrum is dominated by emission lines from highly ionized Ne, O, and Fe. Lines of O viii (16.0, 19.0 ˚A), O vii (21.6, 22.0 ˚A), Ne x (12.1 ˚A), Ne ix (13.4, 13.7 ˚
A), and Fe xvii (15.0, 17.1 ˚A) are particularly prominent. Several weaker lines (e.g., Ne ix, Ne x, Mg xi, Mg xii, Si xiii, Ar xvii) are clearly detected shortward of 12 ˚A, as well.
In Fig. 4, we display narrow spectral regions around the 13.4, 13.55, and 13.7 ˚A triplet (forbidden, intercombination, and resonance lines, respectively; hereafter f, i, r) of the He-like ion Ne ix. In this triplet, as in the He-He-like O vii and Mg xi triplets (not shown), the intercombination line is the weakest of the three lines, and the f:i ratio lies between ∼ 0.5
2Our initial tests of a modified event repositioning technique — in which different position corrections are
used for front-illuminated and back-illuminated devices (Li et al. 2004) — were inconclusive as to potential improvements in the spatial or spectral resolution of the dispersed spectra. Hence, we present here the combined dispersed spectrum of components A and B.
and ∼ 1.0 (see also Huenemoerder et al. 2003a). For the Ne ix triplet, the (f:i) ratio is diagnostic of electron density over the range log n ∼ 11 − 13 and, in the case of HD 98800, the Ne ix f:i ratio suggests a density at the lower end of this range.
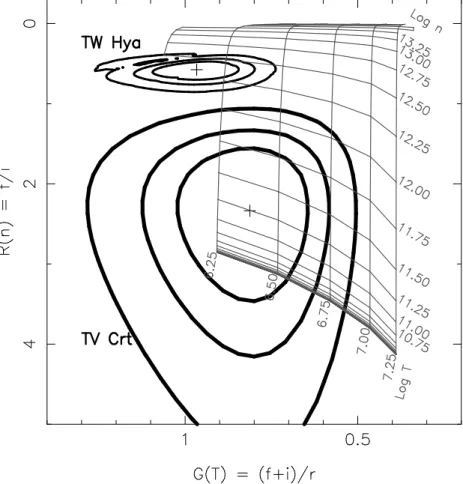
To better constrain the possible range of n for HD 98800 we used models, based on the Astrophysical Plasma Emission Database (APED; Smith et al. 2001), in which the He-like triplet line emissivities are calculated as functions of density and temperature (Brickhouse, pvt. communication). For HD 98800, the comparison between the measured Ne ix f:i ratio and the APED-based model calculations indicates log n ∼ 11.25, with a rather firm upper limit of log n < 12 (Fig. 5). From the O vii f:i ratio, which has a useful diagnostic range of about log n ∼ 9.5 − 12, we derive an upper limit of log n < 11.5. (These upper limits need not be identical, since the lines are formed at different temperatures, and may not be spatially coincident.)
From emission measure and abundance modeling of HD 98800, we find O, Ne, and Fe abundances (relative to solar) of ∼ 0.3, ∼ 1.0, and ∼ 0.2. Fig. 4 serves as a qualitative comparison of the relative abundances of Ne and Fe for HD 98800 and TW Hya. Specifically, since Ne IX and Fe XVII form at similar temperatures, their ratio is primarily sensitive to relative abundance; Fig. 4 thus illustrates that the relative overabundance of Ne with respect to Fe is not as extreme for HD 98800 as for TW Hya.
4. Discussion
It is intriguing that the apparently “diskless” component of the HD 98800 system, HD 98800A, appears to be the stronger X-ray source (Fig. 1). Given the relatively small visual extinction toward the system (E(B − V ) = 0.10; Sylvester et al. 1996) and the inference that the HD 98800B binary is viewed at intermediate inclination angle (Prato et al. 2001), it seems unlikely that this difference in apparent X-ray luminosities is due to differential intervening absorption. Instead, it appears that A is intrinsically brighter in X-rays than B, with a difference of ∆(log LX/Lbol) ≈ 0.5 between components (see §§2 & 3.1 and Prato et
al. 2001). While this result appears consistent with a recent study of Orion showing that disk-enshrouded pre-main sequence (PMS) stars are, in general, weaker X-ray sources than “diskless” PMS stars (Flaccomio et al. 2003), one must first demonstrate that the quiescent emission from both components does not show long-term variability, and that other binary TTS resolvable by Chandra show X-ray flux ratios that are likewise anticorrelated with their relative IR excesses.
X-ray spectrum of HD 98800 resembles those of “classical” coronal sources, such as II Peg, UX Ari, and HR 1099 (see, e.g., Fig. 6 in Kastner et al. 2002). Hence — although it remains to determine fir line ratios for additional weak-lined T Tauri stars — the fir line ratio results
for HD 98800 provide some of the strongest evidence to date that the X-ray emission from such stars is coronal in origin.
There is a marked contrast between the fir ratios in the X-ray spectra of HD 98800 and TW Hya, however (Fig. 4). For the latter (classical T Tauri) star, the forbidden line is by far the weakest of the O vii and Ne ix triplets, and the i:r ratio is near unity in each case (the Mg xi triplet is anomalously weak in the TW Hya spectrum; Kastner et al. 2002). Fig. 5 shows that, assuming the UV radiation field incident on the X-ray emitting plasma of TW Hya is not strong (see below), the plausible density regimes of Ne ix line formation are non-overlapping, for TW Hya and HD 98800; i.e., the Ne ix f:i ratio in the spectrum of TW Hya requires log n > 12.
Furthermore, whereas the differential emission measure (DEM) distribution of TW Hya is sharply peaked at log T ∼ 6.5 (Kastner et al. 2002), the DEM distribution of HD 98800 is relatively flat over the temperature range log T ∼ 6.4 to log T ∼ 7.0. The latter behavior is more like that of coronal sources (Huenemoerder et al. 2003a,b) although — unlike such sources — HD 98800 evidently lacks strong emissivity around log T = 7.2 − 7.6. This may be an indication of the evolutionary status of the corona, in that the dynamo is not yet as strong as in the coronally active binaries, or that the flare frequency, which seems to drive the hotter peak, is not as high.
The overall X-ray spectral similarity between HD 98800 and coronally active stars makes the CXO/HETG X-ray spectrum of the classical TTS TW Hya that much more remarkable. As argued by Kastner et al. (2002), both the plasma densities implied by line ratios of He-like ions and its sharply peaked (and rather low) X-ray temperature distribution point to accretion as a likely source of some or all of its X-ray emission. The modeling of Kuker et al. (2003) lends additional credence to this argument. As TW Hya evidently is actively accreting (based on its strong Hα emission and its UV and near-infrared excesses) whereas HD 98800 is not (based on these same accretion indicators), the sharp distinction between their X-ray spectral characteristics appears to further support the hypothesis that the X-ray emission from TW Hya — and, by extension, other classical TTS — may be generated, at least in part, via accretion.
On the other hand, these two TWA stars are similar in X-rays, in certain respects. For example, TW Hya was also observed to flare, with flare characteristics (e.g., rise time, decay time, peak flare to quiescent count rates) similar to those of HD 98800 (Kastner et al. 2002). In addition, although TW Hya is by far the most extreme star thus measured
by HETG in terms of its Ne/Fe abundance ratio, the X-ray spectrum of HD 98800 shows similar abundance patterns overall (Huenemoerder et al. 2003b).
These similarities would appear to cast some doubt on the accretion hypothesis for TW Hya. It is possible, for example, that UV radiation, generated in accretion streams onto TW Hya, depletes the populations of atomic levels responsible for the forbidden line component of the He-like triplets, thereby driving the line ratios to their high-density limits (e.g., Ness et al. 2002). Although this phenomenon is reasonably well established in the case of the intense UV fields of X-ray-luminous O stars, it is less clear that it is a viable model in the case of accreting cTTS. The relatively weak UV fields of such stars likely would require that the X-ray-emitting plasma be in very close proximity to the UV source – effectively placing the point of X-ray generation within (or very near) the accretion stream itself.
Whatever their origin, the contrasting results for the density-sensitive line ratios of He-like ions in the X-ray spectra of TW Hya and HD 98800 (Fig. 5) suggest that fundamentally different physical conditions characterize the X-ray emitting plasmas of cTTS and wTTS. CXO/HETG observations of additional cTTS and wTTS systems, as well as detailed physical models of UV-irradiated coronal plasmas, are now required to establish whether these He-like triplet line ratios are probing X-ray emitting plasma in accretion funnels or are, instead, diagnostic of the intensity of accretion-powered UV and its proximity to the corona of the accreting star.
Support for this research was provided by contracts SV3–73016 (CXC) and NAS8–01129 (HETG) to MIT.
REFERENCES
Favata, F., Micela, G., Sciortino, S., & D’Antona, F. 1998, A&A, 335, 218 Feigelson, E.D., & Montmerle, T. 1999, ARAA, 37, 363
Flaccomio, E., Damiani, F., Micela, G., Sciortino, S., Harnden, F. R., Murray, S. S., & Wolk, S. J. 2003, ApJ, 582, 398
Houck, J. C., & Denicola, L. A. 2000, in ASP Conf. Ser. 216, Astronomical Data Analysis Software and Systems IX, eds. N. Manset, C. Veillet, & D. Crabtree (San Francisco: ASP), 591
Huenemoerder, D.P., Boroson, B., Schulz, N.S., Canizares, C.R.,Buzasi, D.L., Preston, H.L., Canizares, C.R., & Kastner, J.H. 2003a, in “IAU Symposium 219: Stars as Suns: Activity, Evolution, Planets,” eds. A. Dupree and A. O. Benz (astro-ph/0310319)
Huenemoerder, D.P., Canizares, C.R., Drake, J.J., & Sanz-Forcada, J. 2003b, ApJ, 595, 1131 Kastner, J.H., Huenemoerder, D.P., Schulz, N.S., Canizares, C.R., & Weintraub, D.A. 2002,
ApJ, 567, 434.
Kastner, J.H., Crigger, L., Rich, M., & Weintraub, D.A. 2003, ApJ, 585, 878
Kastner, J.H., Zuckerman, B., Weintraub, D.A., & Forveille, T. 1997, Science, 277, 67 Kuker, M., Henning, Th., & Rudiger, G. 2003, ApJ, 589, 397
Li, J., Kastner, J.H., Prigozhin, G.Y., & Schulz, N.S. 2003, ApJ, 590, 586
Li, J., Kastner, J.H., Prigozhin, G.Y., Schulz, N.S., Feigelson, E.D., & Getman, K.V. 2004, ApJ, submitted (astro-ph/0401592)
Muzerolle, J., Calvet, N., Briceno, C., Hartmann, L., & Hillenbrand, L. 2000, ApJ, 535, L47 Prato, L., et al. 2001, ApJ, 549, 590.
Soderblom, D. R., et al. 1998, ApJ, 498, 385
Soderblom, D. R., Henry, T. J., Shetrone, M. D., Jones, B. F., & Saar, S. H. 1996, ApJ, 460, 984
Smith, R. K., Brickhouse, N. S., Liedahl, D. A., & Raymond, J. C. 2001, ApJ, 556, L91. Sylvester, R. J., Skinner, C. J., Barlow, M. J., & Mannings, V. 1996, MNRAS, 279, 915 Zuckerman, B., & Becklin, E. E. 1993, ApJ, 406, L25
Fig. 1.— Left panels: Keck Telescope mid-infrared images of HD 98800 (Prato et al. 2001). Center and right panels: Chandra/HETGS zeroth-order X-ray images of HD 98800, before (center) and after (right) application of subpixel event relocation. In each X-ray image, contour levels are 0.05, 0.1, 0.2, 0.4, 0.7 of the peak. The pixel size in these images is 0.125′′.
HD 98800A, the stronger X-ray source but weaker mid-IR source, lies at offsets (0,0) in all four panels.
Fig. 2.— Top panel: CXO/HETGS light curves of HD 98800 in “hard” (1.7–7.0 ˚A; black) and “soft” (15.0–25.0 ˚A; grey) bands, for a bin size of 3200 s. Counts in dispersed spectral orders 1–3 were combined to generate these plots. The thin black and grey curves are the background count rates in the hard and soft bands, respectively. Bottom panel: the ratio of hard to soft count rates.
Fig. 3.— The combined HEG+MEG first-order spectrum of HD 98800. The inset shows the region from ∼ 1.5 ˚A to ∼ 12 ˚A.
Fig. 4.— Spectral region that includes the triplet lines of Ne ix and several lines of Fe xvii. The solid line is HD 98800; the dashed line is TW Hya.
Fig. 5.— Line ratios R = f /i vs. G = (f + i)/r within the Ne ix triplet, for HD 98800 = TV Crt (lower contours) and TW Hya (upper contours). The grid overlaid on the plot (log n vs. log T ), which is based on a density-dependent APED model (Brickhouse, pvt. comm.), illustrates how the ratio R serves as a diagnostic of the density of the gas at the temperature indicated by G. The central, middle, and outer contours represent 68%, 90%, and 99% confidence levels in the measured values of R and G.