HAL Id: insu-00160523
https://hal-insu.archives-ouvertes.fr/insu-00160523
Submitted on 6 Jul 2007HAL is a multi-disciplinary open access
archive for the deposit and dissemination of sci-entific research documents, whether they are pub-lished or not. The documents may come from teaching and research institutions in France or abroad, or from public or private research centers.
L’archive ouverte pluridisciplinaire HAL, est destinée au dépôt et à la diffusion de documents scientifiques de niveau recherche, publiés ou non, émanant des établissements d’enseignement et de recherche français ou étrangers, des laboratoires publics ou privés.
Integration of iron in natural and synthetic
Al-pyrophyllites: an infrared spectroscopic study.
Sébastien Lantenois, Jean-Michel Bény, Fabrice Muller, Rémi Champallier
To cite this version:
Sébastien Lantenois, Jean-Michel Bény, Fabrice Muller, Rémi Champallier. Integration of iron in natural and synthetic Al-pyrophyllites: an infrared spectroscopic study.. Clay Minerals, Mineralogical Society, 2007, 42, pp.129-143. �10.1180/claymin.2007.042.1.09�. �insu-00160523�
Integration of iron in natural and synthetic
Al-pyrophyllites: an infrared spectroscopic study.
Sébastien Lantenois 1,2 * Jean-Michel Bény1 Fabrice Muller1 Rémi Champallier1
1 Institut des Sciences de la Terre d’Orléans (ISTO), CNRS – Université d’Orléans, 1A rue de la Férollerie, 45071 Orléans Cedex 2, France.
2 Laboratoire des Agrégats Moléculaires et Matériaux Inorganiques (LAMMI), CNRS – Université Montpellier 2, Bât 15 – Case courrier 015, Place Eugène Bataillon, 34095
Montpellier CEDEX 5 – France.
* Author to whom correspondence should be addressed.
ABSTRACT
Numerous studies focus on the relationships between chemical composition and OHband positions in the infrared (IR) spectra of micaceous minerals. These studies are based on the coexistence, in dioctahedral micas or smectites, of several cationic pairs around the hydroxyl group which each produce a characteristic band in the IR spectrum. The aim of this work is to obtain the wavenumber values of the IR OH vibration bands of the (Al-Fe3+)-OH and (Fe3+-Fe3+)-OH local cationic environments of ‘pyrophyllite type’ in order to prove, disprove or modify a model of dioctahedral phyllosilicate OH-stretching band decomposition. Natural samples are characterized by powder X-ray diffraction (XRD), Fourier transform infrared (FTIR) and Raman spectroscopies and electron microprobe; the hydrothermal synthesis products are also analysed by powder XRD and FTIR after inductively coupled plasma measurements to obtain the chemical compositions of nascent gel phases. Natural samples contain some impurities which were eliminated after acid treatment; nevertheless, a small Fe content is found in the pyrophyllite structure. The amount of Fe which is incorporated within the pyrophyllite structure is much more important for the synthetic samples than for the natural ones. The IR OH bands were clearly observed in both natural and synthetic pyrophyllites and assigned to hydroxides bonded to (Al-Al), (Al-Fe) and (Fe-Fe) cationic pairs. During this study, three samples were analysed by DTG to check the cis- or trans-vacant character of the layers and to determine the influence of this structural character on the OH-stretching band position in IR spectroscopy.
KEYWORDS: Pyrophyllite, hydrothermal syntheses, FTIR spectroscopy, iron defaults,
INTRODUCTION
Dioctahedral phyllosilicates have a wide spectrum of chemical composition [1] and
their cations distribute with different degrees of order – disorder in the tetrahedra and
octahedra of the sheet structure. Infrared spectroscopy is an efficient tool for the
determination of local cationic environments as well as fine structural features. The main
relationships between chemical composition and OH bands positions in infrared spectra of
various dioctahedral materials have been established for celadonites and glauconites [2-5],
micas [6-8] or smectites [9-14].With the computer science development it is really possible to
decompose the broad infrared band of O-H vibrations of phyllosilicates. The first model of
(cation-cation)-OH vibrations corresponding to different wavenumber bands in the OH
stretching range was proposed by Besson et al. [6-7] for dioctahedral trans-vacant mica and
more recently adapted to dioctahedral smectites by Zwiagina et al. [13]. These models were
based on the coexistence in dioctahedral micas or smectites of (cation-cation)-OH bands
linked to an interlayer cation (mica-type bands) and three bands not linked to an interlayer
cation (pyrophyllite type bands) [6]; Al-Al-OH, Al-Fe3+-OH and Fe3+-Fe3+-OH bands. The Al-Al-OH stretching band position in pyrophyllite (Si4Al2O10OH2) is clearly identified [2, 15-17] in comparison with the Fe-pyrophyllite OH bands ones. The scarce occurrence of natural
ferripyrophyllite (iron rich equivalent of pyrophyllite, described by Choukhrov et al. [18]) and
the very low content of iron substitution in natural Al-pyrophyllite structure explain the lack
of Fe-pyrophyllite infrared studies.
The identification of these OH pyrophyllite vibrations are necessary to approve
disapprove or modify the model of dioctahedral phyllosilicate OH stretching decomposition.
The aim of this study is to identify the infrared OH vibration bands in Fe-pyrophyllite
of natural Fe-pyrophyllites and the second one using hydrothermal synthetic samples. These
approaches have been realized with fast Fourier transform infrared (FTIR) spectroscopy
coupled with chemical analyses, transmission electron microscopy (TEM), powders X-ray
diffraction (XRD) and Raman spectroscopy.
MATERIALS AND METHODS
Materials
A variety of natural and synthetic samples were used in this study. The natural
samples are described in Table 1. Synthetic pyrophyllites were crystallized from gels under
hydrothermal conditions. Si-Al gels were prepared following the usual method adapted from
Hamilton and Henderson [19]. Tetraethylorthosilicate (TEOS), Al(NO3)3.9H2O, HNO3, NH4OH and ethanol were used as reagents with a 99% minimum grade purity. After dissolution of Al-nitrate in nitric acid, TEOS and ethanol were added. A precipitate was
obtained by neutralizing the resulting solution at pH ~6 with addition of NH4OH. This precipitate was dried at 80°C for 24 hours, ground in an agate mortar and heated up to 400°C
to remove nitrates and to obtain a gel composed essentially of Al and Si oxides. Si-Al-Fe gels
were prepared using sodium metasilicate (SiO2.Na2O. 5H2O), AlCl3. xH2O, FeCl3. 6H2O and HCl [20] according to the reaction: 4(SiO2.Na2O) + x(AlCl3) + (2 - x)(FeCl3) + 2HCl → Si4AlxFe3+2-xO11 + 8NaCl + H2O. Two x values are used : 0.40 and 1.75. After precipitation, the solid phase was washed and centrifuged to remove sodium chloride (five washing).
Precipitates were dehydrated by drying at 60°C during 24 hours and ground in an agate
mortar to obtain a gel composed essentially of Si, Fe and Al oxides [21]. The samples were
water in a gold tube. The tube was then sealed and heated under argon pressure. The
experimental conditions and the chemical composition of the beginning gel phases
(determinated by ICP) are reported in table 2. After cooling of the vessels, the solid products
were extracted from the reaction tubes, dried at 80°C overnight, and ground before structural
and chemical characterizations.
Some natural pyrophyllites containing additional phases were acid treated to remove
these phases. Treated samples were prepared following an acid attack method adapted from
Perez-Rodriduiez et al. [22] and Maqueda et al [23]; known to destabilize phyllosilicate
phases except pyrophyllite : A mixture of HNO3, HF and HClO4 was prepared. 100 mg of finely ground samples were placed in a Nalgène® reactor, mixed with 20 ml of deionized
water, 2.5 ml of HNO3 (68% weight), 2.5 ml of HClO4 (60% weight) and 5 ml of HF (40% weight) and heated at 80°C during three hours. The residual solid part was filtered, washed
with 100 ml of deionized water, dried by heating at 80°C during one hour and then ground
before characterization.
Methods:
Natural and synthetic pyrophyllites were characterized by X-ray powders diffraction.
XRD patterns were recorded in transmission geometry using CoKα radiation (35 mA, 35 kV). The use of an INEL CPS 120 curved position sensitive detector allowed simultaneously
recording the diffracted intensity over a 4-50°2θ range with a step size of 0.03°. The non-linearity of the detector was corrected [24]. A 0.5 mm diameter Lindemann glass tube was
used to hold the sample powder.
FTIR spectra of natural pyrophyllites were recorded over the 650–4000 cm-1 range with a 2 cm-1 resolution using a Nicolet Magna 760 IR Fourier transform spectrometer equipped with a Globar SiC source and a DTGS detector. The spectrometer was purged with
dry air to remove most of atmospheric H2O and CO2 during data collection. Two recording types were investigated. For natural samples the classical pellet method was used : the
sample was finely ground in an agate mortar, and 0.5 mg of the resulting powder was mixed
with 149.5 mg of KBr previously dried at 120°C for 24 hours. The mixture was homogenized
and pressed in an evacuable die to prepare a 12 mm diameter pellet. For synthetic samples,
infrared spectra were recorded using the same Fourier transform spectrometer coupled with a
Nicolet Nic-Plan microscope to optimize IR signal and limite the amount of used sample.
The powder was spread over the NaCl window of the microscope stage. The analysed sample
area was a 100 µm diameter circle chosen under the microscope 15 X Cassegrainian
objective. The operating conditions were 200 scans, 2 cm-1 resolution over the 650 – 4000 cm-1 range without ambient H2O correction.
The chemical composition of the pyrophyllite samples were realized using a
CAMECA SX50 electron microprobe (EMPA), operating at 15 kV accelerating voltage.
Analyzed samples were grounded in an agate mortar and pressed in an evacuable die to obtain
a flat pellet necessary to obtain best electron microprobe analyses. A part of these pellets was
fixed on a glass slide and then silver metalized befor analyze.
Raman spectra were obtained using a Dilor XY 800 confocal micro Raman
spectrometer equipped with a Wright Model charge-coupled detector (CCD). The excitation
source was the 514 nm green line of a Coherent Innova Model 90-5 Ar+ laser. The beam was focused onto samples powder placed in a glass slide using a 100X objective. Measurements
RESULTS
Defaults in natural pyrophyllites
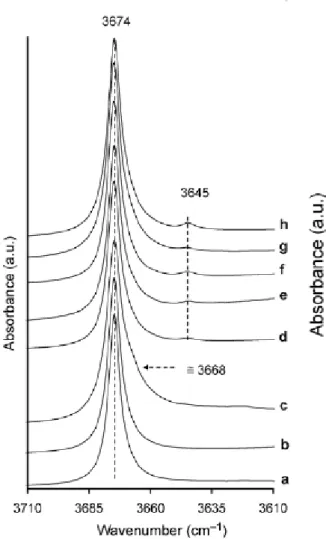
The infrared spectra (Figure 1) in the OH stretching zone (3600-3700 cm-1) of some pyrophyllite samples (Table 1) indicate the presence of structural defaults. The Al-Al-OH
stretching band of pyrophyllite is classically fixed near 3674 cm-1 ([2], Figure 1a). Associated to this intense vibration band, other ones at 3620, 3630, 3645, 3655, 3668 and 3698 cm-1 were detected (Figure 1b-e). Some of these vibration bands are associated with additional
phyllosilicate phases. XRD patterns (Figure 2) also show the presence of associated mineral
phases. Quartz was identified in Rob49 sample (Figure 2b) and Guad sample (Figure 2c).
Some other phyllosilicate minerals were observed such as kaolinite in Sued sample (Figure
2e) and muscovite in Rob49 sample (Figure 2b) and Sued sample (Figure 2e). The associated
phases detected by XRD are listed in Table 1.
These associated phases were eliminated with an acid treatment which allows
kaolinite and mica phases dissolving without destabilization of the pyrophyllite phase.
Chemical analyze results using electron microprobe technique of the acid treated pyrophyllite
samples are given in table 3. The disappearance of the OH stretching bands corresponding to
the associated phases is confirmed by FTIR recording of the acid treated samples (Figure 3).
The large band characteristic of muscovite near 3630 cm-1 in Rob49 sample (Figure 1b) is missing (Figure 3b). In Sued sample, the bands associated to kaolinite at 3620, 3655 and 3698
cm-1 (Figure 1e) are not observed after acid treatment (Figure 3e). Nevertheless, some additional vibration bands were always present : a shoulder near 3668 cm-1 in Guad sample (Figure 1c and 3c) and a small band at 3645 cm-1 in SN and Sued samples (Figure 1d,e and 3d,e). Moreover the vibration band at 3645 cm-1 was also identified in three other samples
presented in this study (Figure 3f,g,h) and was always correlated to the iron detection by
electronic microprobe analyze (Table 3).
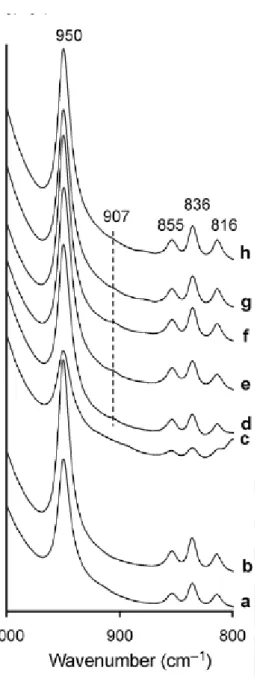
The OH bending zone (800-1000 cm-1) exhibit a band characteristic of pyrophyllite at 950 cm-1 [2] in all samples (Figure 4a-h). Three other bands at 816, 836 and 855 cm-1 were always present and generally observed in pyrophyllite [2]. A very small band at ≅ 907 cm-1 could also be observed in some pyrophyllites samples (Figure 4d-h) and was systematically
correlated to the band at 3645 cm-1 in the OH stretching zone (Figure 3d-h) and to the presence of iron (Table 3).
Integration of iron in synthetic pyrophyllites
An experimental run of hydrothermal syntheses was realized in order to synthesize
pyrophyllite with different iron content. Experimental conditions were reported in Table 2 and
in accordance with the stability domain of Al-pyrophyllite identified by Eberl [25] and
established by Kloprogge et al. [15]. XRD patterns of synthetic samples were presented in
Figure 5. Only pyrophyllite reflections were identified (Figure 5a) for the composition
(PAl-1). The second Al-pyrophyllite (PAl-2), synthesized at different temperature/pressure
conditions (Table 2), shown the same XRD pattern as PAl-1 sample. After hydrothermal
treatment, the two Al-Fe samples (PFe-1 and PFe-2) were composed of a mixture between
hematite (α-Fe2O3), opal (SiO2, xH2O) and pyrophyllite (Figure 5c,d). The next synthetic compound, without Al content (PFe-3), was composed of hematite and opal (Figure 5e).
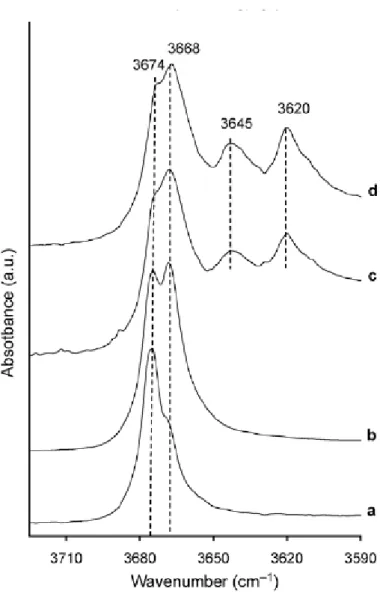
The Infrared spectra of the synthetic pyrophyllite samples are presented in Figure 6
(OH stretching zone) and Figure 7 (OH bending zone). The presence of an OH stretching
vibration band at 3674 cm-1 was observed in Al-pyrophyllite (PAl-1 and PAl-2) but was associated to another band at 3668 cm-1 (Figure 6a,b). The 3668 cm-1band was previously
observed in the Guadeloup natural pyrophyllite (Figure 1c, 3c). The intensity ratio between
these two bands was different in PAl-1 sample and in PAl-2 one. In PFe-1 and PFe-2 samples,
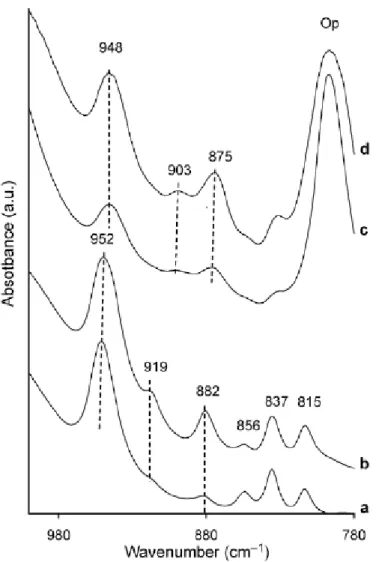
theses bands were still present but in addition two other ones at 3645 cm-1,like in natural pyrophyllite with iron content (Table 3, Figure 3d-h) and at 3620 cm-1 were detected (Figure 6c, d). In the OH bending zone, a band near 950 cm-1 was observed in all synthetic samples (Figure 7a-d) as in natural ones (Figure 4). In PAl-1 and PAl-2 samples, the three bands at
816, 836 and 855 cm-1 characteristic of pyrophyllite [2] are presents but two other bands were observed at 919 and 882 cm-1 (Figure 7a,b). In PFe-1 and PFe-2 samples, two bands at 903 and 875 cm-1 were detected and the presence of Si-O vibration band of Opal near 800 cm-1 was also observed (Figure 7c,d).
DISCUSSION
The AlAlOH vibration bands:
Identification of bands in the OH stretching zone:
Generally, natural pyrophyllites are characterized with an infrared absorption peak at
≅ 3675 cm-1 (Al-Al-OH vibration band, [2]) and a dehydroxylation maximum temperature between 550 and 680°C [26-28, 42].
The infrared characteristic band was always observed for all the natural and synthetic
pyrophyllites presented in this study (Figure 1, 3 and 6). However, another hydroxyls
environment was detected with a band close to 3668 cm-1 identified as a shoulder in one natural sample (Guad sample, Figure 3c) and as a peak in some synthetic ones (Figure 6).
2) and only pyrophyllite phase (Figure 5a,b), the band at 3668 cm-1 can only be associated to an Al-Al-OH vibration of pyrophyllite structure.
The presence of two structural hydroxyls alumina-environments was also observed in
the thermal curves. The DTG curves of the three samples (Guad, PAl-1 and PAl-2), presented
in figure 8 showed two dehydroxylation peaks between 400 and 850°C. The more intense
peak was observed near 560°C and the second peak near 780°C. The existence of two
different dehydroxylation temperatures is currently observed in some dioctahedral 2:1
phyllosilicates [30-32] and is correlated to the existence of cis- or trans-vacant layers [32,33].
Indeed, the layers of dioctahedral 2:1 phyllosilicates can differ in the distribution of the
octahedral cations over the cis- and trans-vacant sites. In dioctahedral phyllosilicates, the
octahedral sheet is composed of two cations and a vacancy around the OH group in the
octahedral layers. If the two cations were placed in M2 and M2’ sites (Figure 9) the structure is identified as a trans-vacant structure. On the contrary, if one cation is placed in M1 site and the second in M2 (or M2’) site, the structure is identified as a cis-vacant structure. Drits et al. (1995) assumed that thermal energy needed for a proton to jump to the nearest OH group to
form a water molecule strongly depends on the distance between the nearest OH groups.
Therefore cis-vacant structure requires higher dehydroxylation energy than trans-vacant one
because of the longer OH-OH distance [33]. This affirmation is confirmed in the literature in
which trans-vacant dioctahedral phyllosilicates dehydroxylate between 550 and 680°C and
cis-vacant ones dehydroxylate between 700 and 850°C [26, 30-40].
Although, pyrophyllite minerals are classically identified as trans-vacant
phyllosilicates [33,41] with a dehydroxylation maximum between 550 and 680°C [26-28,42],
Wang and Zang [43, 44] had identified three kinds of pyrophyllites populations. The first one
has a large DTG dehydroxylation peak with a maximum temperature near 650°C and is
with a maximum temperature near 880°C and is identified as cis-vacant structure. The third
one presents two maxima at 650 and 880°C which correspond to a cis- and trans- mixture of
pyrophyllite phases or an interstratification between cis- and trans-layers. For the three
samples Guad, PAl-1 and PAl-2, the two structural OH losses near 550 and 750°C could be
interpreted as the presence of trans- and cis-vacant layer respectively. So, it can be considered
that the presence of these two OH stretching bands will be correlated to the existence of a
structure partially cis- and trans-vacant. In this case, the band at 3674 cm-1 will be characteristic of trans-vacant Al-Al-OH bands and the band at 3668 cm-1 will be characteristic to cis-vacant Al-Al-OH.
Correlation in the OH bending zone:
In natural pyrophyllite (with trans-vacant structure [33, 41]), the Al-Al-OH band in
the OH bending zone is classically identified at about 950 cm-1 [45]. This band was observed in all the pyrophyllite samples presented in this study (Figure 4,7).
For Al-synthetic samples (PAl-1 and PAl-2) two other bands were identified at 882
and 919 cm-1 (Figure 7a,b). The band near 880 cm-1 is not included in the bending vibration range of Al-Al-OH (between 900 and 955 cm-1) but is observed in a lot of synthetic dioctahedral 2:1 phyllosilicates (beidellite, pyrophyllite and montmorillonites, Klopprogge et
al. [15, 46], Lantenois et al. [47]). Because Russell et al. [45] have observed this band in a
synthetic deuterated pyrophyllite sample, it can not be attributed to an OH vibration band.
The band about 919 cm-1 is included in the bending range. Because the band at 950 cm-1 is classically observed in trans-vacant pyrophyllites, we attribute the 919 cm-1 band to the presence of cis-vacant layers of pyrophyllite. This interpretation is in accordance with the
Al-Al-OH bending band positions of different cis- and trans-vacant dioctahedral 2:1
cis-vacant 2:1 layers [48] have the Al-Al-OH bending range between 910 and 920 cm-1 [14, 47, 49, 51]. For most beidellites, composed by trans-vacant layers [48]. this range is 930 - 940
cm-1 [2, 14, 52].
The OH vibration bands linked to the iron incorporation:
Identification of bands in the OH stretching zone:
In natural and synthetic studied samples with iron content (Table 3), a band at 3645
cm-1 was always observed (Figure 3). This band is interpreted by Farmer [1964] as the symmetric OH vibration (the two hydroxyls group vibrations are in phase) coupled to the
antisymmetric one at 3675 cm-1 (the two hydroxyls group vibrations are in phase opposition). In Raman spectroscopy the symmetric and antisymmetric bands have generally an intensity
ratio inversed as in infrared spectroscopy. The Raman spectrum of VAN pyrophyllite sample
(Figure 10) shows that the symmetric and antisymmetric bands have the same wavenumber
and are in the same intensity ratio than in infrared spectrum (Figure 3g). This result permits us
to don't pay attention to this interpretation. An alternative assignment is proposed by Farmer
[1964] and Besson et al. [7]. These authors supposed that the band at 3645 cm-1could be attributed to an Al-Fe3+-OH band. Moreover, Besson et al. [7] had developed a model which take into account the Al-Fe3+-OH band at 3652 cm-1 and a Fe3+-Fe3+-OH band at 3630 cm-1 correlated to an increasing of the iron content.
In synthetic PFe-1and PFe-2 samples a band near 3620cm-1 was detected (Figure 6c, d). In these samples only opal and hematite associated phases are detected with XRD (Figure
5C, d). The only OH bearing phase is a iron content pyrophyllite and then the 3620cm-1 band is associated to a hydroxyls with iron-environment. In the used hydrothermal conditions, iron
accordance with Farmer [1964] and Besson et al. [7], if the 3645 cm-1 is assigned to the Al-Fe3+-OH band, the 3620cm-1 band is necessary associated to Fe3+-Fe3+-OH. This interpretation is confirmed with chemical analyses which shows for synthetic samples (Table 2) an increase
of iron content in comparison with the natural ones (Table 3).
Comparison with the iron analogue of pyrophyllite: the ferripyrophyllite
Ferripyrophyllite is the ferric analogue of pyrophyllite with an ideal formula
Fe3+2Si4O10(OH)2. This mineral has a very low occurrence and was only described and characterized in natural state by Chukhrov et al. [18] and synthesized by Grauby [53]. We
tried to synthesize ferripyrophyllite in the conditions fixed by Grauby [53] (data not shown)
and in hydrothermal conditions used for synthesize our pyrophyllites : (430°C, 0,5 kbar, 29
days) and (475°C, 2 kbar, 15 days). Ferripyrophyllite never appeared in these conditions.
The infrared study of these minerals shows two bands in the OH stretching zone. The
first one has a strong intensity and is fixed near 3590 cm-1 and the second one has a lower intensity and appeared near 3630 cm-1 [18]. These two bands can be attributed to Fe3+-Fe3+ -OH band and an Al-Fe3+-OH one respectively, in accordance with the chemical composition of this mineral established by Coey et al. [54]. In synthetic sample, only the Fe3+-Fe3+-OH band was identified by Grauby [53] near 3595 cm-1. These data show shifts between Al3+ -Fe3+-OH (15cm-1) and Fe3+-Fe3+-OH (25cm-1) band positions in ferripyrophyllites [18, 53] and in our synthetic samples.
These shifts can be explained by the difference in chemical composition. This
phenomenon has already been observed in other phyllosilicates. For example, Wilkins and Ito
[55] observed shifts lower than 5 cm-1 between the stretching vibration bands of Mg-Ni talc and propose to correlate the OH vibration band positions to the ionic radius of octahedral
radii between magnesium and nickel is very weak (inferior to 0.03Å, [56]) in comparison with
the difference between aluminum and ferric iron (0.11Å [56]).
Identification of bands in the OH bending zone:
In natural pyrophyllite samples who containing structural iron, we observed
systematically the presence of a band at 907 cm-1 (Figure 4). This band was identified as an Al3+-Fe3+-OH bending band. This band was shifted at 903 cm-1 in synthetic pyrophyllite samples (Figure 7c,d). Fe3+-Fe3+-OH vibration band has been identified by Chukhrov et al. [18] and Grauby [53] between 800 and 805 cm-1. In this range, the presence of Si-O vibrations bands and the three bands at 856, 837 and 815 cm-1 currently observed in pyrophyllite and not assigned to OH bending vibration [45] hindered the vibration band. In addition, in your
sample, a synthetic broad band make impossible the identification of this Fe3+-Fe3+-OH band (Figure 7c,d).
CONCLUSION
ACKNOWLEDGMENTS
P. Baillif, O. Rouer (ISTO-Orléans), A. Pineau (CRMD-Orléans), L.-C. de Menorval
FIGURE CAPTIONS
Figure 1: Infrared spectra of natural pyrophyllites in the OH stretching zone. (a) Rob 48, (b)
Figure 2: XRD patterns of natural pyrophyllites. (a) Rob 48, (b) Sued, (c) Guad, (d) SN, (e)
Rob 49. Pyrophyllite reflections are labeled P. Quartz, muscovite and kaolinite impurities are
Figure 3: Infrared spectra of pyrophyllites in the OH stretching zone after acid treatment
(noted -T) if necessary. (a) Rob 48-T, (b) Rob 49-T, (c) Guad-T, (d) SN-T, (e) Sued-T, (f) Bin
(g) Nep, (h) Van. For the three last samples, it wasn't necessary to perform acid treatment
Figure 4: Infrared spectra of pyrophyllites in the OH bending zone after acid treatment (noted
-T) if necessary. (a) Rob 48-T, (b) Rob 49-T, (c) Guad-T, (d) SN-T, (e) Sued-T, (f) Bin (g)
Nep, (h) Van. For the three last samples, it wasn't necessary to perform acid treatment because
Figure 5: XRD patterns of synthetic pyrophyllites. (a) PAl-1, (b) PFe-1, (c) PFe-2, (d) PFe-3.
Pyrophyllite reflections are labeled P. The presence of opal and hematite annex phases are
Figure 6: Infrared spectra of synthetic samples containing pyrophyllite phase in the OH
Figure 7: Infrared spectra of synthetic pyrophyllites in the OH bending zone. (a) PAl-1, (b)
Figure 8: DTG curves of pyrophyllites in the 400-850°C temperature range. (a) Guad, (b)
PAl-1 and (c) PAl-2 samples.
Figure 9: A fragment of the octahedral sheet of a 2:1 layer showing the local disposition of
the octahedral sites around the OH group. M1 corresponds to the trans-site. M2 and M2’ are the two cis-positions. The OH group are represented by full black circles.
REFERENCES
[1] S. W. Bailey, Hydrous phyllosilicates, Exclusive of Micas; Reviews in Mineralogy,
Mineralogical Society of America, Washington, D.C., U.S.A. 1988.
[2] V.C. Farmer, The layer silicates, in: V.C. Farmer (ed.),infrared spectra of minerals,
Mineralogical Society, London, 1974.
[3] B. Velde, American Mineralogist. 63 (1978) 343.
[4] M.V. Slonimskaya, G. Besson, L.G. Dainyak, C. Tchoubar, V.A. Drits, Clay Minerals 21
(1986) 377.
[5] V.A. Drits, L.G. Dainyak, F. Muller, G. Besson, A. Manceau Clay Minerals. 32 (1997)
153.
[6] G. Besson, V.A. Drits, Clays and Clay Minerals 45 (1997) 158.
[7] G. Besson, V.A. Drits, Clays and Clay Minerals 45 (1997) 170.
[8] B. Velde, American Mineralogist, 68 (1983) 1169.
[9] J. Madejova, P. Komadel, B. Cicel, Clay Minerals 29 (1994) 319.
[10] S. Petit, J. Caillaud, D. Righi, J. Madejova, F. Elsass, H.M. Köster, Clay Minerals. 37
(2002) 283.
[11] C.I. Fialips, D. Huo, L. Yan, J. Wu, J.W. Stucki, American Mineralogist. 87, (2002) 630.
[12] C.I. Fialips, D. Huo, L. Yan, J. Wu, J.W. Stucki, Clays and Clay Minerals. 50 (2002)
455.
[13] B.B. Zviagina, D. K. McCarty, J. Srodon, V.A. Drits, Clays and Clay Minerals 52
(2004) 399.
[14] W. P. Gates, CMS Workshop Lectures Vol 13 Kloprogge ed. the Clay Mineral Society
Aurora CO (2004) 125.
[16] L. Wang, M. Zhang, S.A.T. Redfern, Z. Zhang, Clays and Clay Minerals 50 (2002) 272.
[17] P. A. Schroeder, In CMS Workshop Lectures, Vol 11, Teaching Clay Science, A. Rule
and S. Guggenheim, eds., The Clay Mineral Society, Aurora, CO (2002) 181.
[18] F.V. Chukhrov, B.B. Zvyagin, V.A. Drits, A.I. Gorshkov, L.P. Ermilova, E.A. Goilo,
E.S. Rudnitskaya, International Clay Conference (1978) 55.
[19] D.L. Hamilton, C.M.B. Henderson, Mineralogical Magazine 36 (1968) 832.
[20] A. Decarreau, D. Bonnin, D. Badaut-Trauth, R. Couty, P. Kaiser, Clay Minerals, 22,
(1987) 207.
[21] O. Grauby, S. Petit, A. Decarreau, A. Baronnet, European Journal of Mineralogy 5
(1993) 623.
[22] J. L. Perez-Rodriduez, L.A. Maqueda, A. Justo, Clays and Clay Minerals. 33, (1985)
563.
[23] L.A. Maqueda, J.L. Perez-Rodriduez, A. Justo, Analyst. 11, (1986) 1107.
[24] Roux, J. and Volfinger, M. (1996) Mesures précises à l'aide d'un détecteur courbe.
Journal de Physique, IV, 127-134.
[25] D. Eberl, American Mineralogist. 64, (1979) 1091.
[26] R.C. Mackenzie, Differential Thermal Analysis, Vol. I, Academic Press, London, 1970.
[27] J. Schomburg, Thermochimica Acta, 93 (1985) 521.
[28] L.A. Perez-Maqueda, O.M. Montes, E.M. Gonzalez-Macias, F. Franco, j. Poyato, J.l.
Perez-Rodriguez, Applied Clay Science, 24 (2004) 201.
[29] P.J. Sanchez-Soto, J.L. Perez-Rodriguez, Thermichimica Acta, 138 (1989) 267.
[30] R.C. Mackenzie, The differential thermal Investigation of Clays, Mineralogical Society,
[31] R. E. Grim, Clay Mineralogy: International Series in the earth and Planetary Sciences. F.
Press, ed., McGraw-Hill Book Company, New York, 1968.
[32] V.A. Drits, G. Besson, F. Muller, Clays and Clay Minerals, 43 (1995) 718.
[33] F. Muller, V.A. Drits, A. Plançon, J.-L. Robert, Clays and Clay Minerals, 48 (2000) 572.
[34] G.W. Brindley, Proceedings of International Clay Conference 1975, J. Fripiat ed.,
Applied Publishing Ltd., Wilmette, Illinois, USA, 1976, 119.
[35] L. Heller-Kallay, V.C. Farmer, R.C. Mackenzie, B.D. Mitchell, H.F.W. Taylor, Clay
Mineral Bulletin, 5 (1962) 56.
[36] S. Guggenheim, Proceedings of 9th International Clay Conference, Volume 2, V.C. Farmer and Y. Tardy eds., Strasbourg, France, (1990) 99.
[37] R.C. Mackenzie, Thermal Analysis, B. Miller ed. Chischester, Wiley Heyden Ltd., Great
Britain, (1982) 25.
[38] F. Muller, V.A. Drits, A. Plançon, G. Besson, Clay Minerals 35 (2000) 491.
[39] N. Trauth, J. Lucas, Bulletin du Groupe Français des Argiles XIX-2 (1967) 11.
[40] S.I. Tsipursky, M.Y. Kameneva, V.A. Drits, Proceedings of the 5th Conference of the European Clay Groups, J. Konta ed., Prague (1985) 569.
[41] R. Wardle, G.W. Brindley, American Mineralogist, 57 (1972) 732.
[42] L. Wang, Z. Zhang, Chinese Science Bulletin, 42 (1997) 1908.
[43] L. Wang, Z. Zhang, Chinese Science Bulletin, 42 (1997) 321.
[44] J.D. Russell, V.C. Farmer, B. Velde, Mineralogical Magazine, 37 (1970) 869.
[45] J.T. Kloprogge, J.B.H. Jansen, J.W. Geus, Clays and Clay Minerals, 38 (1990) 409.
[46] S. Lantenois, R. Champallier, J.-M. Bény, F. Muller, Applied Clay Science (submitted)
[47] S.I. Tsipursky, V.A. Drits, Clay Minerals, 19 (1984) 13.
[48] S. Lantenois, B. Lanson, F. Muller, A. bauer, M. Jullien, A. Plançon, Clays and Clay
[49] J. Madejova, P. Komadel, Clays and Clay Minerals 49 (2001) 410.
[50] J. Madejova, J. Bujdak, S. Petit, P. Komadel, Clay Minerals, 35 (2000) 739.
[51] J.T. Kloprogge, Applied Clay Science, 31 (2006) 165.
[52] V.C. Farmer, J;D; Russel , Spectrochem. Acta, 20 (1964) 1099
[53] O. Grauby, Phd Thesis, Poitiers University, France (1993).
[54] J.M.D. Coey, F.V. Chukhrov, B.B. Zvyagin, Clays and Clay Minerals 32 (1984) 198.
[55] R.W.T. Wilkins, J. Ito, American Mineralogist, 52 (1967) 1649.
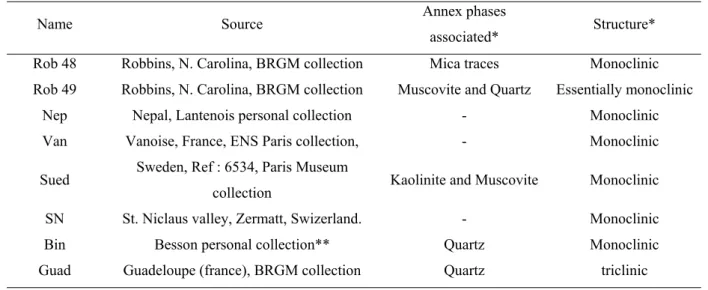
Table 1: natural pyrophyllite samples examined
Name Source Annex phases
associated* Structure* Rob 48 Robbins, N. Carolina, BRGM collection Mica traces Monoclinic Rob 49 Robbins, N. Carolina, BRGM collection Muscovite and Quartz Essentially monoclinic
Nep Nepal, Lantenois personal collection - Monoclinic Van Vanoise, France, ENS Paris collection, - Monoclinic Sued Sweden, Ref : 6534, Paris Museum
collection Kaolinite and Muscovite Monoclinic SN St. Niclaus valley, Zermatt, Swizerland. - Monoclinic Bin Besson personal collection** Quartz Monoclinic Guad Guadeloupe (france), BRGM collection Quartz triclinic Notes : * determined by X-ray diffraction, ** Besson et al. [6, 7]
Table 2: Chemical and experimental data of synthetic pyrophyllites
Samples PAl-1 PAl-2 PFe-1 PFe-2 PFe-3 Chemical composition of beginning gel phases1:
SiO2 63.8 66.2 64.3 57.3 43.4
Al2O3 36.2 33.8 28.9 5.0 0.0
Fe2O3 0.0 0.0 6.6 36.6 56.4
Na2O 0.0 0.0 0.1 0.1 0.2
Experimental conditions of hydrothermal synthesis:
Temperature (°C) 475 430 475 475 475
Pressure (kbar) 2 0.5 2 2 2
Run time (Days) 15 29 15 15 15 Note: 1 Determined by ICP measurements
Table 3: Chemical formulae of pyrophyllites
Samples Rob48 Rob49 Rob49T Sued SuedT SN SNT Bin Guad Nep Van PAl-1 PAl-2
Tetrahedral occupancy Si 3.98 3.72 3.99 3.87 3.99 4.00 4.00 4.00 3.98 3.98 4.00 3.85 4.00 Al 0.02 0.28 0.01 0.13 0.01 0.00 0.00 0.00 0.02 0.02 0.00 0.15 0.00 Octahedral occupancy Al 2.00 1.96 1.99 2.20 1.97 1.97 1.97 1.97 2.00 1.98 1.97 2.00 1.98 Fe 0.00 0.00 0.00 0.03 0.03 0.03 0.03 0.03 0.00 0.02 0.03 0.00 0.00 Interlayer cations K 0.01 0.36 0.00 0.07 0.01 0.00 0.00 0.00 0.01 0.02 0.00 0.00 0.00 Na 0.01 0.04 0.00 0.01 0.00 0.00 0.00 0.00 0.00 0.01 0.00 0.00 0.00