HAL Id: hal-02115657
https://hal.archives-ouvertes.fr/hal-02115657
Submitted on 30 Apr 2019
HAL is a multi-disciplinary open access
archive for the deposit and dissemination of
sci-entific research documents, whether they are
pub-lished or not. The documents may come from
teaching and research institutions in France or
abroad, or from public or private research centers.
L’archive ouverte pluridisciplinaire HAL, est
destinée au dépôt et à la diffusion de documents
scientifiques de niveau recherche, publiés ou non,
émanant des établissements d’enseignement et de
recherche français ou étrangers, des laboratoires
publics ou privés.
reticulum that drives asymmetric spindle position
Vlad Costache, Céline Hebras, Gérard Prulière, Lydia Besnardeau, Margaux
Failla, Richard Copley, David Burgess, Janet Chenevert, Alex Mcdougall
To cite this version:
Vlad Costache, Céline Hebras, Gérard Prulière, Lydia Besnardeau, Margaux Failla, et al.. Kif2
localizes to a subdomain of cortical endoplasmic reticulum that drives asymmetric spindle position.
Nature Communications, Nature Publishing Group, 2017, 8 (1), �10.1038/s41467-017-01048-8�.
�hal-02115657�
Kif2 localizes to a subdomain of cortical
endoplasmic reticulum that drives asymmetric
spindle position
Vlad Costache
1
, Celine Hebras
1
, Gerard Pruliere
1
, Lydia Besnardeau
1
, Margaux Failla
1
, Richard R. Copley
1
,
David Burgess
2
, Janet Chenevert
1
& Alex McDougall
1
Asymmetric positioning of the mitotic spindle is a fundamental process responsible for
creating sibling cell size asymmetry; however, how the cortex causes the depolymerization of
astral microtubules during asymmetric spindle positioning has remained elusive. Early
asci-dian embryos possess a large cortical subdomain of endoplasmic reticulum (ER) that causes
asymmetric spindle positioning driving unequal cell division. Here we show that the
micro-tubule depolymerase Kif2 localizes to this subdomain of cortical ER. Rapid live-cell imaging
reveals that microtubules are less abundant in the subdomain of cortical ER. Inhibition of Kif2
function prevents the development of mitotic aster asymmetry and spindle pole movement
towards the subdomain of cortical ER, whereas locally increasing microtubule
depolymer-ization causes exaggerated asymmetric spindle positioning. This study shows that the
microtubule depolymerase Kif2 is localized to a cortical subdomain of endoplasmic reticulum
that is involved in asymmetric spindle positioning during unequal cell division.
DOI: 10.1038/s41467-017-01048-8
OPEN
1Sorbonne Universités, UPMC Univ Paris 06, CNRS, Laboratoire de Biologie du Développement de Villefranche-sur-mer (LBDV), Observatoire Océanologique, Villefranche sur-mer 06230, France.2Boston College, Biology Department, 528 Higgins Hall, 140 Commonwealth Ave, Chestnut Hill, MA 0246, USA. Correspondence and requests for materials should be addressed to J.C. (email:[email protected]) or to A.M. (email:[email protected])
C
ontrol of microtubule dynamics at the cell cortex is
important for a myriad of processes including spindle
positioning at the cell center during cell division
1–3,
asymmetric spindle positioning during unequal cell division
(UCD) in embryos
4, 5, and for axonal pruning during nervous
system development in mammals
6,7. Microtubule dynamics have
been intensively studied during asymmetric cell division (ACD)
which is sometimes coupled with UCD creating one large and one
small daughter cell that have different fates, as in Drosophila
neuroblasts
8, sea urchin micromeres
9, and C. elegans 1-cell
zygotes
10. Such UCD has two components: cortical pulling forces
acting on astral microtubule plus ends
11and depolymerization of
microtubule plus ends as they encounter the cortex
12,13, which
together create unbalanced forces to position the mitotic spindle
asymmetrically. These two processes acting together overcome
the forces that cause mitotic spindles to move to the center of the
cell, a process that senses and integrates force over the length of
microtubules
14. However, one key piece missing from this model
Aster behavior during unequal cell division 8-cell stage 16-cell stage 32-cell stage 64-cell stage UCD1 UCD2 UCD3 B4.1 pair B5.2 pair B6.3 pair
8-cell stage 16-cell stage 16-cell stage
PH::Tom EB3::GFP
CAB
DNA MIT aPKC
CAB ER CAB visualization MIT
a
b
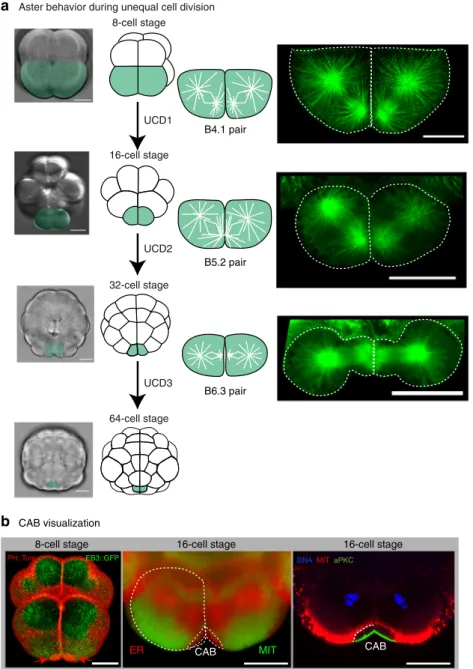
Fig. 1 Microtubules and centrosome-attracting body (CAB) during UCD. a Aster behavior during unequal cell division. Schematics showing embryos from the 8–64-cell stage together with bright-field images of embryos with the 2 blastomeres that undergo unequal cell division highlighted green. Right: selected confocal planes from live 4D imaging experiments showing microtubule organization in the pairs of blastomeres that undergo UCD at the 8, 16, and 32-cell stages (corresponding to the schematics). All microtubules were labeled in live embryos with Ensconsin::3GFP. Scale bars= 30 µm. See Supplementary Movies2,3,4, and5.b CAB visualization. Left image: 3D rendering of several confocal imaging planes reveals the CAB in the two bottom blastomeres (B4.1 pair) at the 8-cell stage in a live embryo (red arrows). CAB visualized with PH::Tom (red) and the deeper cytoplasm with the microtubule-binding protein EB3::GFP (green). See Supplementary Movie6. Center image: live confocal imaging of the cortical endoplasmic reticulum in the CAB
(labeled red) with a marker for endoplasmic reticulum (DiIC16) and the mitochondria (labeled green) with Mitotracker. The cER present in the CAB (also see deeper ER accumulated on the mitotic spindles) is attached to a specialized apical domain. Right image: confocal image of afixed 16-cell stage embryo stained with antibodies to aPKC (green) and the deeper and surrounding mitochondria with NN18 (red). Chromosomes stained with DAPI (blue). Note the dark unlabeled zone between the CAB surface and the mitochondria which isfilled with cER (see dotted line at one interface for clarity). Scale bars= 30 µm
of UCD is the identity of the protein(s) that cause astral
micro-tubule plus end depolymerization at the cortex, which is
impor-tant not only for UCD, but also for the mitotic spindle centering
mechanism based on astral microtubule length that operates
during symmetric cell division.
Microtubule plus ends can be induced to depolymerize via
different mechanisms. In vitro experiments indicate that dynein
can cause catastrophe of microtubule plus ends
15, raising the
possibility that in intact cells dynein couples pulling with
depo-lymerization. A different mechanism regulates microtubule plus
end depolymerization in developing mammalian neurites which
is dependent on the cortically localized microtubule depolymerase
Kif2A
6. Kif2A is a member of the kinesin-13 family of
micro-tubule depolymerases
16which includes MCAK/Kif2C that causes
microtubule plus end depolymerization at kinetochores during
anaphase
17. However, in cells that divide unequally it is still not
known what causes astral microtubule plus end depolymerization
at the cortex. In C. elegans one protein has been described
(EFA-6) which limits cortical microtubule growth, however the
knockdown of EFA-6 does not prevent UCD
18.
C. elegans embryos have provided a wealth of knowledge about
the cortical pulling forces that act upon astral microtubules
during UCD. For example, following fertilization and symmetry
breaking in C. elegans, the Par polarity complexes are partitioned
to distinct cortical subdomains
19. Anterior Par3/Par6/aPKC
(PKC-3) phosphorylates LIN-5 (NuMA) at the anterior cortex
inhibiting the cortical anterior spindle pulling forces
20,while
NuMAs binding partner GPR-1/2 (Pins/LGN) becomes enriched
at the posterior cortex during mitosis
21–23. The dynein light chain
protein DYRB-1 coupled to GFP has been demonstrated to
co-immunoprecipitate with endogenous LIN-5 and GPR-1/2 in C.
elegans embryos thus suggesting that DYRB-1 may provide a
physical link between the endogenous dynein/dynactin complex
and either LIN-5 or GPR-1/2
24. However, this interaction has not
been shown to be limited to the posterior cortex. During
meta-phase and anameta-phase the mitotic spindle is pulled towards the
posterior cortex causing UCD
11. Late in mitosis the posterior
centrosome has changed from a spherical shape to a
flattened and
disk-shaped structure
25. Symmetric cell divisions in somatic cells
also depend upon cortical dynein to center the mitotic
spindle
2,26,27. In C. elegans, in addition to dynein pulling forces,
it has been shown that astral microtubule depolymerization also
plays a role in posterior spindle displacement. For example,
pulling forces are lacking when microtubules are stabilized by
taxol, while in embryos carrying a temperature-sensitive mutation
in a
β-tubulin gene the posterior displacement distance of the
spindle is enhanced
28. Based on these and other data a dual
force-generation mechanism has been proposed that relies on
tubule pulling forces (dynein-dependent) combined with
micro-tubule depolymerization
13, 28. Thus in C. elegans, although
cortical microtubule depolymerization is thought to be part of the
mechanism for posterior spindle displacement, the mechanism
regulating cortical astral microtubule depolymerization is not
known
19.
Many embryos provide more extreme examples of UCD
whereby the two asters of the mitotic spindle become highly
asymmetric in size and shape with the smaller of the two asters
being inherited by the smaller of the two daughter cells. Similar to
the
flattened posterior centrosome in C. elegans one-cell
embryos
25, such mitotic aster asymmetry has also been
observed during UCD in spiralian
29, 30, echinoderm
31, 32, and
ascidian
33, 34embryos. Mitotic aster asymmetry commonly
occurs at the third cleavage in spiralian embryos with the smaller
aster associating with an animal cortical domain at the 4-cell stage
leading to UCD
29. A similar phenomenon has been documented
for sea urchin embryos where one aster in each future micromere
associates with a cortical domain situated at the vegetal pole of
the 8-cell stage embryo creating aster asymmetry during UCD
31.
The clearest example of a cortical domain that causes aster
asymmetry and UCD comes from ascidian embryos. Here a large
cortical structure termed the centrosome-attracting body (CAB)
causes three successive rounds of UCD accompanied by the
CAB-proximal aster becoming smaller
33–35. Although the Par complex
(aPKC, Par3, and Par6) is localized to the CAB
36, we do not
currently know how the CAB affects microtubule dynamics
leading to aster asymmetry. Due the large dimensions of the CAB
(circa 20
µm at the 8-cell stage
37and this article) we wondered
whether it would be possible to identify proteins involved in
regulating microtubule dynamics at the cortex via live-cell
ima-ging during UCD in the early ascidian embryo.
We have developed the optically transparent ascidian species
Phallusia mammillata as a system to perform live-cell imaging to
study microtubule dynamics during UCD
34, 38. By analyzing
microtubule dynamics at the cortex we discovered that a
micro-tubule depolymerase (Kif2) localizes to the cortical CAB in a
cell-cycle-dependent manner. Through live-cell imaging of Kif2::
Venus/mCherry/Tomato and immunofluorescence we
demon-strate that exogenous and endogenous Kif2 localizes to the cortical
CAB. In particular, Kif2 accumulates on a subdomain of cortical
endoplasmic reticulum (cER) concentrated at the CAB during
interphase and leaves the CAB cER during mitosis when
CAB-proximal microtubules become short. In addition, we show that
microtubules are less abundant in the cortical CAB during
inter-phase. Finally, we found that inhibiting endogenous Kif2 protein
function prevents the establishment of mitotic aster asymmetry,
and conversely that increasing depolymerization of microtubules
near the subdomain of cER at the CAB causes exaggerated
asymmetric spindle positioning.
Results
Asymmetric spindle positioning and the CAB. The early
embryo of the European ascidian Phallusia mammillata is
favorable for live-cell imaging and functional studies because its
cells are transparent (see Supplementary Movie
1
) and readily
translate exogenous messenger RNAs (mRNAs) such as those
encoding GFP fusions and dominant negative constructs
38.
Ascidian embryos display three successive rounds of UCD that
depend upon the CAB
33–35. During these three rounds of UCD,
one pole of the mitotic spindle is attracted to the CAB (Fig.
1
a).
As UCD ensues, astral microtubules emanating from the
centrosome nearest the CAB and midline become shorter than
those microtubules originating from the more distant centrosome
(Fig.
1
a). A smaller and
flattened aster thus forms nearest the
CAB and midline during each round of UCD (Fig.
1
and
Supplementary Movies
2
,
3
, and
4
with a 3D rendering of an
8-cell stage embryo shown in Supplementary Movie
5
). In
Phallusia embryos, both centrosomes appeared similar for
γ-tubulin staining (Supplementary Fig.
1
) indicating that aster
size is not a function of
γ-tubulin loss from one centrosome as
has been observed in leech zygotes
39.
The CAB is a multilayer structure and can be visualized in
several ways
36,40. Because the CAB creates a protrusion it can be
visualized with plasma membrane markers such as PH::Tom
(Fig.
1
b and Supplementary Movie
6
). Also, because the
CAB is rich in cER and excludes mitochondria it can be
visualized by specific lipophilic dyes that label either the
mitochondria or cER in the CAB (Fig.
1
b). Finally, antibodies
to aPKC label the cortical surface of the CAB but do not label the
cER in the CAB which appears as a dark zone surrounded by
mitochondria labeled with anti-mitochondrial antibody-NN18
(Fig.
1
b).
Characterization of Kif2 in ascidian embryos. In order to
understand how the CAB may be involved in creating aster
asymmetry we searched for CAB-resident proteins by screening
likely candidates by either probing with antibody for
immuno-fluorescence or localization of expressed tagged proteins (GFP,
Venus, mCherry, or Tomato). We identified a number of proteins
including Kif2, a member of the kinesin-13 family of proteins that
instead of possessing motor activity displays microtubule
depo-lymerization activity
41. Vertebrates contain three members of the
Kif2/kinesin-13 family: Kif2a, Kif2b, and MCAK (Kif2c)
42. There
is only one member of the Kif2 family in the ascidian (P.
mam-millata: PmKif2: unique gene ID: phmamm.g00002556 and C.
intestinalis: CiKif2: unique gene ID: Ciinte.g00008837) and other
non-vertebrate deuterostomes (Supplementary Fig.
2
), suggesting
that the vertebrate family of proteins evolved from a
non-vertebrate deuterostome Kif2a/b/c (henceforth Kif2). In two
species of ascidian (Phallusia mammillata and Ciona intestinalis),
Kif2 is a CAB-resident protein (Fig.
2
a and Supplementary Fig.
3
).
Ascidian Kif2 also localizes to centrosomes and spindle
micro-tubules (like Kif2a/Kif2b) although CAB localization was
stron-gest (Supplementary Fig.
3
). Overexpressing Kif2 to high levels
shortened microtubules consistent with it acting as a microtubule
depolymerase
(Supplementary
Fig.
4
and
Supplementary
Movie
14
). By Western blot Kif2 antibody recognizes both
endogenous Kif2 and injected Kif2 coupled to GFP
(Supple-mentary Fig.
5
). Finally, exogenous Kif2::Tom localized to the
CAB during UCD at the 8-cell, 16-cell, and 32-cell stages in
Phallusia embryos (Fig.
2
b).
Next we wished to pinpoint which domain of Kif2 protein was
required for CAB localization. For this we injected mRNAs
Endogenous Kif2 in the CABEndogenous Kif2::Tom localizes to the CAB
N-terminal domain of Kif2 is sufficient for CAB localization M1 G164 I234 V569 N750 Cter Catalytic Neck Nter 8-cell B4.1 B5.2 B6.3
EB3::3GFP Ens::3GFP Ens::3GFP
16-cell 32-cell
KIF2::Tom
KIF2::Tom KIF2::Tom
Anti-hsKIF2A
Phallusia mammillata Ciona intestinalis 16-cell stage A P B5.2 pair 8-cell 8-cell
a
b
c
Fig. 2 Kif2 protein localizes to the CAB. a Endogenous Kif2 in the CAB. Confocal images of twofixed 16-cell stage embryos stained with anti-Kif2 from two species of ascidian: Phallusia mammillata and Ciona intestinalis showing the accumulation of endogenous Kif2 protein (green) in the blastomeres (B5.2 pair) containing the CAB (boxed). DNA stained with DAPI (blue), microtubules with anti-Tubulin (red). n= 94 embryos. Scale bars = 30 µm. Images are representative of all embryos.b Exogenous Kif2::Tomato localizes to the CAB. Live Phallusia embryos expressing Kif2::Tom (red) and the microtubule markers EB3::GFP (green, 8-cell stage prometaphase, also see Supplementary Movie 7 where bright-field data has been included) or Ens::3GFP (green, 16-cell stage and 32-cell stage interphase) showing the localization pattern of Kif2::Tom to the CAB (red). Arrows indicate CABs. Scale bar= 30 µm (8-cell), 30µm (16-cell), and 20 µm (32-cell). n = 30. Images are representative of all embryos. c N-terminal domain of Kif2 is sufficient for CAB localization. Schematic of Kif2 protein showing N-terminal domain, neck region, catalytic domain, and C-terminal domain. In order to determine which part of the protein was required for CAB localization different truncated versions of Kif2 were fused to Venus and their localization to the CAB followed by epifluorescence. Left: bright-field and epifluorescence images of 8-cell stage embryo expressing N-ter Kif2::Venus (truncated to amino acids 1-72). Right: bright-field and epifluorescence images of 8-cell stage embryo expressing truncated N-ter Kif2::Venus (amino acids 239-726). CAB region is indicated by oval. Scale bar= 30 µm. n = 16. Images are representative of all embryos
Exogenous Kif2 dynamics at CAB
Endogenous Kif2 leaves the CAB in mitosis
Kif2 is delocalized from the CAB (Dendra)
Plk1::Ven Kif2::Tom Overlay
0 4:35 30:15 34:50 8c stage Prometa Ana 16c stage Prometa Ana
Red Kif2 in one CAB Before UV
After UV
Before UV
After UV
Red Kif2 in one CAB Prometaphase Prometaphase Anaphase Anaphase n = 24 12 23 24 5 9 21 3 26 6 Total 153 9 26 100
8 cell stage 16 cell stage 16 cell stage 8 cell stage 80 Prometaphase NEB Plk1::Ven Kif2::Tom Ratio Kif2/Plk1 –6 –4 –2 0 2 4 6 8 10 12 1.2 1.0 0.8 0.6 0.4 0.2 0
Fluorescence ratio (a.u.)
Time (min.) 16-cell stage
Anaphase
InterphaseProphaseMetaphaseAnaphaseTelophase
InterphaseProphaseMetaphaseAnaphaseTelophase ProphaseAna / telo ProphaseAna / telo
0 10 20 30 40 50 60 70 80 90 100
Kif2 presence in CAB
(% embryos)
CAB not labelled Kif2 present in CAB Control PEM1 / aPKC
8-cell
16-cell
a
b
c
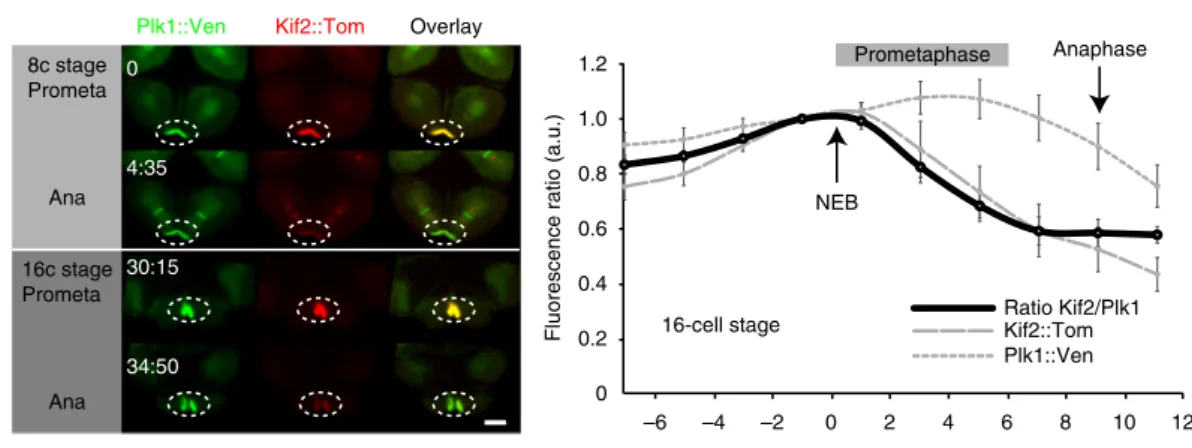
Fig. 3 Kif2 dynamics at the CAB. a Exogenous Kif2 dynamics at CAB. Unfertilized eggs were microinjected with mRNA encoding Kif2::Tom and Plk1::Venus which also labels the CAB. Confocal images from a time-lapse series showing Plk1::Ven, Kif2::Tom localization at prometaphase and anaphase at the 8 and 16-cell stages. Time in min. Oval indicates CAB region. n= 6. Scale bar = 20 µm. Quantification of Plk1::Ven fluorescence versus Kif2::Tom fluorescence in the CAB. Ratiometric signal normalized to time of nuclear envelope breakdown (NEB). Plk1::Ven (gray dotted line), Kif2::Tom (gray dashed line) and ratio of Kif2::/Plk1fluorescence (solid black line) are shown. n = 6. Kif2 fluorescence begins to decrease 42 ± 17 s (mean ± s.e.m.) following NEB (n = 9). See Supplementary Movie8.b Endogenous Kif2 leaves the CAB in mitosis. Fixed 8-cell and 16-cell stage embryos probed with anti-Kif2 during metaphase (left) and anaphase (right); CAB region outlined by oval. Scale bars= 20 µm. Quantification of the immunofluorescence data at the 8–16 and 16–32-cell stages (cell cycle stages are indicated). Kif2 in the CAB was scored as present or absent regardless of the amount. The 4 bars at right are controls showing that two other CAB-resident proteins (PEM1 and aPKC) remain in the CAB at Anaphase/Telophase. n is indicated below each column.c Kif2 is delocalized from the CAB. Embryos at the 8-cell stage containing Kif2::Dendra. Left: upper row of images show Kif2::Dendra localization at the CAB (before UV photoconversion, green). Note absence of red Kif2 at the CAB. A small region of interest within the left CAB (arrowhead) was illuminated with UV light to cause photoconversion of the green Kif2::Dendra into red Kif2::Dendra (see highlighted lower row of images). Left: lower row of images following a brief UV illumination in a pre-defined region of interest centered in only one CAB, the photo-converted red Kif2 is created in one CAB (arrowhead indicates CAB-containing red Kif2). Right: upper row of images show localization of Kif2::dendra before photoconversion. Right: lower row of images show that some red Kif2::Dendra in CAB to the left (strong red signal, arrowhead) diffused away from the CAB to label the nearby chromosomes (arrows). The chromosomes in the adjacent blastomere to the right appear only green and are not labeled with the red Kif2::Dendra since the UV laser was focused on the left blastomere CAB (thereby creating red Kif2::Dendra only in the left CAB). Scale bars= 30 µm. n = 6
encoding fusions between Venus tag and various portions of Kif2
and evaluated CAB localization of each construct. Our results
show that the N-terminal 72 amino acids of Kif2 was capable of
targeting Kif2 to the CAB, and conversely removing the
N-terminal domain abolished CAB localization of the Venus-tagged
constructs (Fig.
2
c). The N-terminal domain of MCAK is
involved in subcellular targeting
43which is consistent with our
findings that the N-terminal fragment is sufficient for driving
CAB localization. However, since the C-terminal coiled-coil
domain of MCAK drives dimerization
43, it is not clear why the
C-CAB is a multilayer structure rich in cortical ER
Kif2 is localized to cortical endoplasmic reticulum
B4.1 pair
CAB cortical ER
Kif2 finger projections at CAB during mitosis
B4.1 pair
Prometa Meta Ana
Chromosomes
CAB
CAB cortical Kif2 Overlay
CAB Anti pMNK CAB Anti NN18 DNA
a
b
c
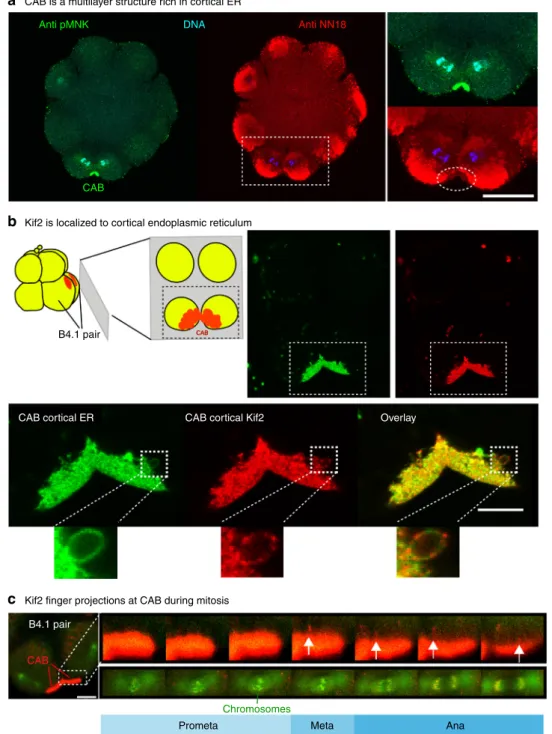
Fig. 4 Kif2 protein localizes to the domain of cortical ER in the CAB. a CAB is a multilayered cortical structure rich in cortical ER. pMNK labeling of the cortical ER (green) with the mitochondria labeled with anti NN18 (red) and the DNA with DAPI (blue). Enlarged view of the ROI showing that the mitochondria are excluded from the CAB where the cER is enriched (oval). Scale bar= 30 µm. n > 50. b Kif2 is localized to cortical endoplasmic reticulum. Schematic of cortical preparation, ER in red. Top right: probing cortical preparations with DiO (green) to label the endoplasmic reticulum and Kif2 antibody (red) revealed that Kif2 protein was localized to the domain of cortical ER in the CAB. CAB is indicated in boxed region. Lower: enlarged views of the boxed region in top right images showing more clearly the cER labeled with a DiO (green) together with the Kif2 labeling (red). At the edge of the CAB some tubes of cER are visible (insets of small boxed regions) where Kif2fluorescence appears punctate relative to the green DiO cER signal. Scale bars = 10 µm. n > 50. See Supplementary Movie9.c Kif2finger-like projections at CAB surface during mitosis. Embryo containing Kif2::Tom, EB3::GFP and H2B::GFP. During mitosis redfinger-like projections appear at the surface of the CAB (arrows). Mitotic stage is indicated from H2B::GFP labeling of chromosomes during mitosis (left boxed region). Enlarged views of the two boxed regions showing thefinger-like projections from the CAB surface (upper row of images) and the mitotic stage as indicated by the chromosome configuration. Scale bar = 20 µm
terminal domain of ascidian Kif2 does not localize to the CAB by
forming a dimer with endogenous Kif2 in the CAB.
Kif2 is lost from the CAB after NEB. We noticed that Kif2
protein appeared to accumulate at the CAB during interphase and
leave the CAB during mitosis (Supplementary Movie
7
). In order
to determine more precisely the dynamics of Kif2 delocalization
from the CAB we performed live-cell ratiometric imaging of Kif2::
Tom levels relative to Plk1::Ven, which is also a CAB-resident
protein (Fig.
3
a). By comparing the
fluorescence of Kif2::Tom to
Plk1::Ven we found that Kif2::Tom began to be lost from the CAB
within 1 min. of NEB (n
= 9, 42 s. ± 17, mean ± s.e.m.) and
continued to fall throughout prometaphase (Fig.
3
a and
Microtubules are less abundant in the CABENS::3GFP/Kif2::Tom Fertilization Fertilization Settled onto protamine coverslips Settled onto protamine coverslips Kif2::Tom Ens::3GFP
Microtubules are less abundant in the CAB in an intact embryo 16-cell stage
16-cell stage
MTs
Microtubules are less abundant in the CAB
Anti-tubulin Kif2::Tom Ens::3GFP Ca2+-free SW 8-cell stage
Anti aPKC/CAB Overlay
00:00 00:15 00:30 00:45
a
b
c
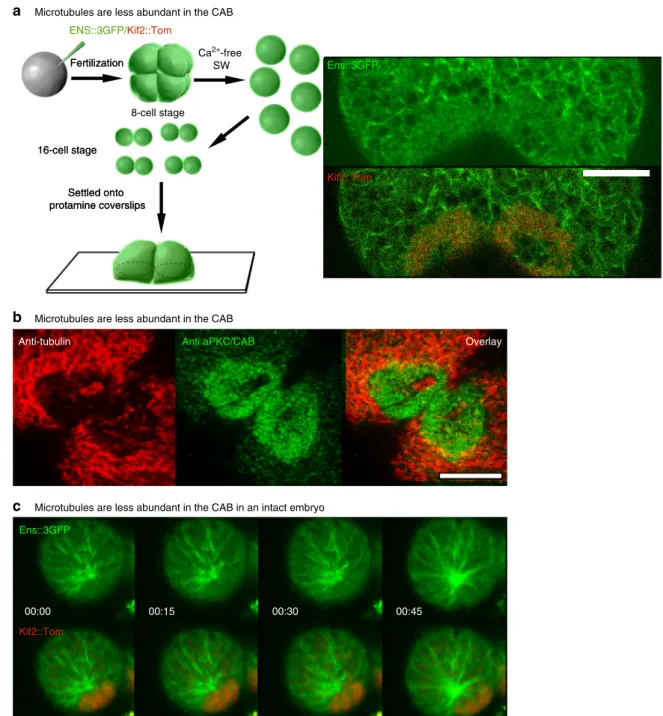
Fig. 5 Microtubule dynamics at the cortical CAB. a Microtubules are less abundant in the CAB. In order to follow microtubule dynamics at the CAB, unfertilized eggs were microinjected with mRNA for Ens::3GFP and Kif2::Tom, fertilized and then transferred to calcium-free seawater at the 8-cell stage to dissociate the 8 blastomeres. Once the dissociated blastomeres had divided, pairs of B5.2 blastomeres were placed on coverslips that had been treated with protamine so that the blastomeres adhered. Next fast confocal imaging (0.8 s/image) of a 1µm thick optical section just above the coverslip revealed that microtubules were less abundant in the CAB (red). Scale bar= 10 µm. n = 4. See Supplementary Movie10.b Microtubules are less abundant in the CAB. Confocal z-sections fromfixed 8-cell stage embryos showing microtubules (red, anti-tubulin) and the CAB (green, anti-aPKC). Microtubules are less abundant in the CAB (n> 50). Scale bar = 20 µm. c Microtubule dynamics at the CAB in an intact embryo. Selected frames from a confocal time-lapse series through the surface of a CAB-containing blastomere at the 32-cell stage. Microtubules are labeled with Ens::3GFP and the CAB with Kif2::Tom. Confocal images were acquired every 3 s and selected frames from each are shown. Microtubules are less abundant in the CAB (Supplementary Movie11). Scale bar= 10 µm
Supplementary Movie
8
). Careful examination of endogenous
Kif2 levels at the CAB in either Phallusia or Ciona embryos
revealed a similar dynamic delocalization of Kif2 during mitosis,
whereby endogenous KIF2 protein was delocalized from the CAB
by anaphase (Fig.
3
b and Supplementary Fig.
3
). Since we scored
the immunofluorescence data shown in Fig.
3
b for presence or
absence of Kif2 in the CAB, it should be noted the bars at
metaphase appear high because a small amount of Kif2 remains
localized to the CAB at that time. However, these data reflect
presence or absence of Kif2 in the CAB and not the absolute
amount of Kif2 which is difficult to estimate quantitatively from
immunofluorescence data. Moreover, we are confident that we
Local depolymerization of microtubules at CAB
Control DN Kif2 Side view B4.1
*
*
Anti-tubulin CAB 8-cell Fert Sp. poles+ CAB DN Kif2+ tracker
16-cell
Vegetal view B4.1
Ens::GFP
Photoactivatable depolymerization of microtubules (combretastatin)
0
0
Dominant negative Kif2
*** –Noc +Noc Spindle pole–cortex ( µ m) Spindle pole–cortex ( µ m) 0 4 8 12 16 30 20 10 0 B4.1 cells Cont rol DN-Kif2 Cont rol Taxol CABs Vegetal view B4.1 *** *** 16 ** 12 8 4 0 –Comb +Comb P A
8-cell stage Photoactivation
Taxol
CAB side
CAB side
Spindle pole–CAB distance (
µ m) 13 15 t = –0’40’’ t = –0’00’’ t = 9’57’’
a
b
c
can detect the loss of endogenous Kif2 from the CAB since we
found that two other CAB-resident proteins such as PEM1 or
aPKC do not leave the CAB during mitosis (Fig.
3
b).
In order to determine whether loss of signal at the CAB was
due to delocalization or degradation we used the
photo-convertible construct Kif2::Dendra to follow a specific pool of
Kif2 protein in vivo. UV illumination converts the green Kif2::
Dendra fusion protein into red Kif2::Dendra. UV illumination of
Kif2::Dendra in a region within one CAB caused just the
illuminated CAB to become red (Fig.
3
c, left panel arrowheads).
Since Kif2 is also a kinetochore localized protein, we reasoned
that if we could detect red Kif2::Dendra on chromosomes this
would indicate that the red version of Kif2 protein diffused from
the nearby CAB to become captured by the adjacent
chromo-somes. It is important to note that the presence of red Kif2::
Dendra on chromosomes does not rule-out destruction of Kif2 at
the CAB, but it does show that some red Kif2 protein is capable of
leaving the CAB intact. In addition, since ascidian Kif2 lacks a
destruction box motif it is therefore unlikely to be a substrate of
the anaphase-promoting complex/cyclosome which targets
pro-tein like cyclins A and B for destruction during M phase as we
showed in the ascidian
44,45. Figure
3
c right panel shows that we
were able to detect red Kif2::Dendra on chromosomes in the
blastomere containing the photo-converted red Kif2::Dendra.
Note that on the left panel in Fig.
3
c the blastomeres are in
interphase and Kif2::Dendra does not label the decondensed
DNA. Following photoconversion, some of the red version of
Kif2::Dendra that was created in the CAB (Fig.
3
c, right panel
arrowhead) has diffused away from the CAB to label nearby
chromosomes (Fig.
3
c, right panel, arrows). Since the red version
of Kif2 that was created in the CAB could be detected on the
chromosomes we concluded that Kif2 protein can delocalize from
the CAB.
Kif2 localizes to cortical ER in the CAB. As noted previously,
the CAB is a multilayered structure comprised of a thick layer of
cER protruding into the cytoplasm which adheres to a specialized
region of actin-rich cortex
36. By co-staining for mitochondria
which surround and outline the cER mass, and for pMNK, a cER
resident protein
37, the deeper cER can be visualized (Fig.
4
a).
Unlike aPKC protein, which labels the CAB cortex (Fig.
1
b), Kif2
protein occupied the thicker cER layer (Fig.
4
a). To determine the
precise localization of Kif2 protein in the CAB we prepared
iso-lated cortices. By sticking 8-cell stage embryos to coverslips
fol-lowed by shearing using an isotonic buffer, the cortex and its
associated cER is retained on the coverslip (Fig.
4
b). Labeling
these cortical preparations with DiO, an endoplasmic reticulum
marker in isolated cortices
37,46(Supplementary Fig.
6
), followed
by anti-Kif2 revealed a concentration of Kif2 on the cER of the
CAB (Fig.
4
b, upper panel, and lower panel enlarged view for
higher definition). In Fig.
4
b a tube of cER extruding from the
CAB labeled with DiO has a punctate staining pattern for Kif2
(inset: enlarged view in Fig.
4
b lower panel and Supplementary
Movie
9
). In live embryos we were able to observe dynamic
finger-like projections from the surface of the CAB labeled with
Kif2::Tom (Fig.
4
c, arrow), consistent with the notion that Kif2
was localized to the tubes of cER in the CAB.
Microtubule dynamics at the CAB. To visualize the rapid
dynamics of microtubules at the cortex embryos have to be
immobilized close to a
flat surface, here provided by the coverslip.
In one cell C. elegans zygotes this permitted the accurate
deter-mination of plus end dynamics leading to the development of the
microtubule
“touch and pull” mechanism of ACD
13. In ascidians,
measurement of microtubule plus end dynamics in a cortical slice
containing the CAB and non-CAB cortex is complicated by both
the movement and the geometry of the embryo: since the CAB is
an apical cortical structure close to the midline it invariably
curves away from the coverslip. In order to overcome these
problems, we dissociated blastomeres with calcium-free seawater
and used protamine-coated coverslips to immobilize the
blas-tomeres (Fig.
5
a). Blastomere isolation does not perturb UCD in
Phallusia embryos
34. Ens::3GFP
fluorescence was then measured
in a cortical slice within 1
µm of the coverslip every 0.8 s (Fig.
5
).
Fig. 6 Inhibition of Kif2 and localized microtubule depolymerization. a Dominant negative Kif2. Left: 8-cell stage embryo in which one blastomere at the 2-cell stage was microinjected with a truncated version of Kif2 which acts as a dominant negative (henceforth DN-Kif2) and histone H2B::Rfp1 as a fluorescent tracker to label the injected half of the embryos. Unfertilized eggs had previously been injected with Ens::3GFP to monitor spindle poles and Kif2 Nter::Ven to monitor the CAB. Minimum spindle pole distance to the CAB was measured at cleavage onset in the control half of the embryo (blue line) and the half containing DN-Kif2 (red line). Middle: Embryos injected at the 2-cell stage with DN-Kif2 werefixed and labeled for microtubules. A side view of an 8-cell stage embryo shows that the CAB-proximal aster is larger in the presence of DN-Kif2, and the spindle pole distance to the CAB cortex is increased (stars represents the center of the spindle pole closest to the CAB). Taxol: Treating embryos at the 8-cell stage with Taxol to stabilize microtubules also created asters that appeared more equal in diameter and increased the spindle pole-CAB distance. Top: epifluorescence images of fixed 8-cell stage embryo. Upper image showing spindle poles and the CAB (anti-gamma tubulin/anti-aPKC), lower image microtubules (anti-Tubulin). Dotted line shows measured distance. n= 30. Lower: epifluorescence image of live 8-cell stage embryo treated with Taxol showing merged images (microtubules green, CAB red). Scale bars= 20 µm. Right: quantification of spindle pole to CAB distance for DN-Kif2 and Taxol versus wild-type embryos. For the DN-Kif2 experiment the spindle pole to CAB distance was 13.6± 0.59 µm (mean ± s.e.m.) for wild type versus 21.6 ± 0.5 µm (mean ± s.e.m,) in the presence of DN-Kif2. Student’s t-test, ***P = < 0.00005. n = 13. For the Taxol experiment the spindle pole to CAB distance was 13.7 ± 0.3 µm (mean ± s.e.m.) for wild type versus 21.6± 0.5 µm (mean ± s.e.m) in the presence of Taxol. Student’s t-test, ***P = < 0.00005. n = 30. b Local depolymerization of microtubules at CAB. Top row of images. Nocodazole pipette (small bore) was advanced towards one B4.1 blastomere (bright-field image time 0). Spindle position during mitosis (13 min. image). Zoom of boxed region showing the spindle pole closest to the pipette moved even closer towards the CAB during mitosis (compare left spindle with right spindle pole). See Supplementary Movie13. Scale bar, 30µm. Middle row of images. Nocodazole pipette (large bore) was advanced towards one B4.1 blastomere (bright-field image time 0). Fluorescence image showing spindle position during mitosis (15 min. image). Zoom of boxed region showing that both spindle poles moved closer to the CAB and midline (arrows). Scale bar, 30µm. Lower left panel and quantification. Control blastomeres at 8-cell stage. Spindle-pole–cortex distance in the presence of the nocodazole pipette was 10.5 ± 0.9 µm (mean ± s.e.m, n = 16) versus 15.2 ± 0.4µm (mean ± s.e.m, n = 32) without the pipette. Student’s t-test, ***P = < 0.00005. Right panel. Nocodazole pipettes were tested on fertilized eggs containing Ens::3GFP. Note the loss of microtubule density in the aster nearest the pipette. Time in min. Scale bar, 30µm. See Supplementary Movie12.c Microtubule depolymerization with the caged Combretastatin. Caged Combretastatin was uncaged causing its activation in the boxed region causing microtubule depolymerization during mitosis. Microtubules were labeled with Ens::3GFP. Spindles were left intact and still migrated towards the CAB. Due to diffusion of the uncaged Combretastatin all cells were affected. Tracking of spindle poles is shown in the inset to the right. Scale bars= 20 µm Spindle-pole-cortex distance following uncaging of Combretastatin was 11.7± 0.9 µm (mean ± s.e.m, n = 16) versus 15.2 ± 0.4 µm (mean ± s.e.m, n = 32) without the Combretastatin. Student’s t-test, **P = < 0.005. n = 16
Microtubules are present as a dense network on the cortex
during interphase, but in the CAB domain they are less abundant
(Fig.
5
a, b, see Supplementary Movie
10
). In Supplementary
Movie
10
, microtubules can be observed polymerizing in the
direction of the CAB (labeled red with Kif2::Tom), but they
penetrate the CAB less frequently. Occasionally during interphase
the CAB has a hole at its center where microtubules can be
observed to reach the cortex, but microtubules are less abundant
in the Kif2-labeled zone of the CAB (Fig.
5
a, b). Microtubules are
also less abundant in the CAB in the intact embryo at the 32-cell
stage even though they can be seen growing around the CAB
(Fig.
5
c and Supplementary Movie
11
) as in isolated blastomeres
(Fig.
5
a); however, since the embryo moves in the imaging plane
many z sections were acquired so the time resolution in one z
plane is reduced.
Microtubule depolymerization and aster asymmetry. In order
to determine the role of Kif2 in the CAB we generated a mutant
form of Kif2 protein (DN-Kif2) based on the construct which
behaves as a dominant negative in mammalian cells
17. DN-Kif2
contains the N-terminal domain which targets it to the CAB and
a C-terminal domain which permits dimerization of MCAK in
mammalian cells
43, but lacks the catalytic domain (Fig.
6
). mRNA
encoding DN-Kif2 and H2B::Rfp1 constructs were injected into
one blastomere of a two cell stage embryo previously injected
with Ens::3GFP and Kif2-Nter::Venus to monitor microtubules
and the CAB in both halves of the embryo (Fig.
6
a). As a control
we compared the effect of DN-Kif2 to wild-type Kif2 by
co-injecting eggs with the same concentration of mRNA encoding
either DN-Kif2 or wild-type Kif2 together with the same
con-centration of Ens::3GFP to monitor
fluorescence. In order to
distinguish those eggs injected with a mixture of wild-type Kif2
plus Ens::3GFP from those injected with DN-Kif2 plus Ens::3GFP
(since both batches will display green
fluorescence), we mixed low
levels of H2B::mRFP1 mRNA with DN-Kif2/Ens mRNA before
microinjection (DN-Kif2 eggs thus also display red
fluorescence).
All eggs were fertilized shortly after microinjection and
mon-itored up to the 32-cell stage. None of the DN-Kif2 injected eggs
reached the 32-cell stage (n
= 32) while 12/16 wild-type Kif2
reached the 32-cell stage (Supplementary Fig.
7
). DN-Kif2
pre-vented the development of aster asymmetry (Fig.
6
a, right panel).
We measured the distance between the nearest spindle pole and
the CAB in both halves of the embryo at the 8-cell stage and
found that DN-Kif2 significantly increased the spindle pole to
CAB distance (Fig.
6
a). Since taxol stabilizes microtubules and
reduces depolymerization, we reasoned that taxol should have a
similar effect to DN-Kif2. Treating embryos in mitosis with taxol
also prevented the development of aster asymmetry and increased
the distance of the spindle pole to the cortex and CAB (Fig.
6
a,
middle panel). Either Kif2-DN or Taxol treatment increased the
spindle pole to CAB distance significantly (Fig.
6
a, right panel).
These data suggest that aster asymmetry and asymmetric spindle
positioning require the activity of Kif2 and microtubule
depolymerization.
If aster reduction facilitates the migration of one spindle pole
towards the cortex, we reasoned that increasing microtubule
depolymerization near the CAB would enhance spindle pole
movement towards the cortex. We employed a method to
depolymerize microtubules locally by using a micro-pipette as a
spatially confined source of nocodazole (Materials and methods
section) and monitored the loss of Ens::3GFP microtubule
labeling near the source of the pipette (Fig.
6
b, lower right panel
and Supplementary Movie
12
). We applied different diameter
pipettes containing nocodazole near the CAB immediately after
NEB and measured the effect on the position of the proximal
spindle pole. Relatively small diameter nocodazole pipettes caused
the CAB-proximal spindle pole to migrate closer toward the
midline cortex (Fig.
6
b and Supplementary Movie
13
).
Blas-tomeres far from the source of nocodazole were unaffected and
divided normally (Fig.
6
b, top panel and Supplementary
Movie
13
). By using a larger bore pipette we could affect both
CAB-containing blastomeres so that both CAB-proximal spindle
poles moved closer to the midline cortex while blastomeres
farther from the pipette behaved normally and divided (Fig.
6
b,
middle panel). Control dimethyl sulfoxide (DMSO)-containing
pipettes had absolutely no effect on spindle positioning (Fig.
6
b,
bottom left). Placing nocodazole pipettes on non-CAB
blasto-meres did not cause spindle poles to move towards the
nocodazole needle and midline (Supplementary Fig.
8
). To
depolymerize microtubules via a second method we used
photo-activation of caged Combretastatin
47while imaging microtubules
with Ens::3GFP or EB3::GFP (Fig.
6
c). Activation of caged
Combretastatin during mitosis caused astral microtubule
depo-lymerization while leaving spindle microtubules intact. As noted
with nocodazole pipettes, the whole spindle migrated even closer
towards the midline cortex (Fig.
6
c). These data revealed that
reducing aster size could augment the asymmetric positioning of
the spindle, supporting the hypothesis that astral microtubule
polymerization opposes the pulling forces provided by the CAB.
Discussion
Here we present evidence for the localization and function of a
microtubule depolymerase (Kif2) at a cortical site that is involved
in asymmetric spindle positioning. Precise control of microtubule
dynamics at the cortex is a fundamental cellular mechanism that
is involved in diverse biological processes ranging from the
control of axon morphology
6, 7, 48to the unequal division of
cells
4, 8. UCD is an extremely widespread process in biology
occurring in bacteria
49,50, yeast
51, and many different types of
embryo. Amongst embryos, UCD has been observed in
cteno-phores
52,
chaetognaths
53,
spiralians
30,
echinoderms
31,
and
invertebrate chordate embryos of the ascidian
33. A common
theme among several embryos that display UCD is the
develop-ment of aster asymmetry. Unequally cleaving spiralian embryos
(Tubifex, and the leech Helobdella) display aster asymmetry at the
1–2-cell stage leading to eccentric positioning of the mitotic
spindle
39. Sea urchin embryos also display UCD starting at the
8–16-cell stage culminating in the formation of four
micro-meres
31at the vegetal pole where aPKC is absent
54. Although the
mechanism underlying this UCD is not known in these embryos,
observations indicate that one centrosome becomes disk-shaped
and closely apposed to the cortex before UCD
31. In ascidians
three successive rounds of UCD occur starting at the 8–16-cell
stage, resulting in the formation of two small blastomeres at the
64-cell stage that are germ cell precursors
33. We showed here
(Fig.
1
) and previously that the CAB causes one pole of the
mitotic spindle to approach the CAB during prometaphase
through anaphase which is accompanied by the shrinking of the
CAB-proximal aster
34.
One central unresolved question therefore is how specialized
cortical sites affect astral microtubules leading to the development
of aster asymmetry. Here we report that Kif2 is concentrated on a
subdomain of cER found at the CAB during interphase and leaves
the CAB within 1 min of NEB (Fig.
3
a and Supplementary
Movie
8
). Interestingly, it was recently found that in human cells
Kif2A can also associate with organelles
55. Here for example,
Kif2A associates with a sub-type of Arf GAPs (AGAP1) that is
found on endosomes
55and this association between Kif2A and
AGAP1 is involved in cytoskeletal remodeling and cell
move-ment. In the ascidian, we propose that the Kif2 localized to the
cER affects microtubule dynamics at the cortex, and also
fol-lowing release from the cER causes depolymerization of the
nearest microtubules during mitosis thus leading to the
devel-opment of aster asymmetry. By artificially increasing the amount
of local depolymerization of astral microtubules in the proximity
of the CAB we found that the spindle pole moved even closer to
the midline cortex (Fig.
6
b).
Our results have led us to the conclusion that polymerization
of astral microtubules opposes the pulling forces that likely
dis-place the mitotic spindle towards the CAB. However, it is
cur-rently unknown how the CAB pulls the spindle towards the
cortex
56although this will be a key area for future studies. We
therefore propose that the diffusion of Kif2 from the CAB in
mitosis causes the local depolymerization of those astral
micro-tubules nearest the CAB thus facilitating the eccentric positioning
of the mitotic spindle near the CAB cortex. Furthermore, since
MCAK can produce a significant pulling force during
micro-tubule deploymerization
57it is also possible that some of the
remaining Kif2 localized at the CAB creates a pulling force as the
microtubules touching the CAB depolymerize. The mechanism
we have discovered here in a chordate deuterostome embryo
extends our understanding of how the cortex is involved in
asymmetric spindle positioning, which so far has been heavily
studied in two protostomes, C. elegans and Drosophila. In
Dro-sophila larval neuroblasts, even though the apically localized Gα/
Pins/NuMA complex aligns the mitotic spindle
8,58,59, UCD can
be driven by a cortical subdomain of Myosin II via a mechanism
which is independent of spindle position
60. Although neuroblasts
display an alternative mode of UCD, work in C. elegans zygotes
has demonstrated the fundamental importance of the conserved
Gαi/GPR-1/2/LIN-5 (Gαi/Pins/NuMA) complex, which
accu-mulates at the posterior cortex and creates a pulling force on
astral microtubules that is greater at the posterior cortex, thus
causing unequal cleavage
11,61. Intriguingly, microtubule
depoly-merization is thought to be required for UCD in C.
elegans
13,28,62although the mechanism responsible is currently
unknown. It appears that this is not Kif2-dependent in C. elegans,
since inhibition of MCAK with RNAi does not prevent eccentric
spindle positioning
11.
The control of microtubule plus end dynamics by Kif2 that we
find here is remarkably similar to the axonal pruning function of
Kif2A in mammalian post-mitotic neurons. For example, in
developing neurites Kif2A is thought to bind to the plasma
membrane associated protein phosphatidylinositol 4-phosphate
5-kinase
48. Kif2A localizes to the tips of developing neurites in vivo
and functions to suppress collateral branch extension since the
knockout of Kif2A in mice causes increased microtubule stability at
the cell edge in growth cones creating more growth of collaterals
6.
Our results presented here indicate that the
flattened aster with
short microtubules and movement of the spindle toward the CAB
are both facilitated by the action of a cortically localized
micro-tubule depolymerase. Given that Kif2 is involved in asymmetric
spindle positioning in invertebrate chordate embryos and
mor-phogenesis of developing mammalian neurites, it may be
worthwhile investigating the role played by kinesin-13 family
members such as Kif2 and other microtubule depolymerases
during UCD as well as other biological processes where
micro-tubule dynamics alter when they encounter the cortex.
Methods
Origin of the animals. Phallusia mammillata were collected at Sète (Etang de Tau, Mediterranean coast, France) and Ciona intestinalis at Roscoff. Ascidian eggs were dechorionated with 0.1% Trypsin (Sigma-Aldrich, T9201) in sea water for 90 min. then transferred to fresh sea water and stored until required. Ascidian sperm were activated with pH9.5 sea water for 10–20 min. then used to fertilize dechorionated eggs.
Antibodies,fixation and reagents. Embryos were fixed in −20° methanol con-taining 5µM ethylene glycol-bis(β-aminoethyl ether)-N,N,N′,N′-tetraacetic acid (EGTA) and immunolabelled46. We used anti aPKC (1/200, Santa Cruz 216) and anti PEM1 (1/100)37to label the CAB, anti-tubulin (1/200, YL1/2 and 1/500 DM1a, Sigma) for microtubules, anti Kif2 (1/200 following affinity purification of anti-human Kif263on Phallusia Kif2 protein produced in bacteria), and anti-γ tubulin (1/200, Sigma GTU88) for centrosomes. DiI (injection of saturated oil droplet into eggs, Invitrogen) and Mitotracker (2µg/ml, Invitrogen) were used to label ER and mitochondria respectively in live embryos, Paclitaxel (4µM, Sigma) to stabilize microtubules and nocodazole (20–50 µM, Sigma) to depolymerize microtubules. Caged Combretastatin (provided by Martin Wuhr) was added to 4-cell stage embryos at afinal concentration of 100 nM and de-caged during 8-cell stage mitosis to depolymerize microtubules.
For Western blot samples were prepared in Laemmli sample buffer and migrated on 10% polyacrylamide gels by sodium dodecyl sulfate polyacrylamide gel electrophoresis using standard procedures. Two lanes were loaded containing either 40 uninjected eggs or 40 eggs which had been injected with mRNA encoding full-length Kif2::GFP. After transfer to nitrocellulose, each lane was cut into two strips length-wise which were incubated overnight with either Kif2 or anti-GFP at a dilution of 1:1000 in TBS + 5% dry milk. The 4 strip blots were then washed in TBS + 0.1% tween, incubated with anti-rabbit secondary at 1:10,000, and washed in TBS-tween. The signal was detected using West Pico chemiluminescent substrate (Fisher) at an exposure of 2 min.
Preparation of isolated cortices. Isolated cortices were prepared following the methods previously established in the laboratory36,46. Briefly, embryos at the desired stage were transferred to calcium-free seawater then placed at high density on coverslips coated with protamine (1 mg/ml) to which they adhere within 1 min. After two washes with cortex isolation medium (cortex isolation medium (CIM): 0.8 M glucose, 0.1 M KC1, 2 mM MgCl2, 5 mM EGTA, 10 mM MOPS buffer, pH 7), a stream of CIM is sprayed gently with a Pasteur pipette, shearing off the embryos but leaving attached to the glass imprints of the adherent membrane and associated cortical structures. The coverslips are washed rapidly in CIM then placed in cold methanol forfixation, then rehydrated in phosphate-buffered saline and processed for immunofluorescence by standard procedures used for whole embryos. ER of isolated cortices was labeled with the addition of 0.2µg/ml DiO C6 (3) (Invitrogen) for 1 min. followingfixation and immunolabelling37,46. Microinjection and imaging. For microinjection dechorionated oocytes were mounted in glass wedges and injected with mRNA (1-2µg/µl pipette concentra-tion/~1–2% injection volume) using a high pressure system (Narishige IM300)64. mRNA-injected oocytes were left for 2–5 h or overnight before fertilization and imaging offluorescent fusion protein constructs. The lipophilic dye Cell Mask Orange (Molecular Probes) was prepared at a concentration of 10 mg/ml in DMSO and diluted in sea water at 20µg/ml then mixed 1:1 with the embryos just prior to imaging. Epifluorescence imaging was performed with an Olympus IX70, Zeiss Axiovert 100, or Axiovert 200 equipped with cooled CCD cameras and controlled with MetaMorph software package. Confocal microscopy was performed using a Leica SP5 or SP8fitted with 40×/1.3NA oil objective lens and 40×/1.1NA water objective lens, respectively. All live imaging experiments were performed at 18–19 ° C. For fast imaging of cortical preparations a rectangular image section of the imaging array was selected to increase the temporal resolution to 0.8 images/sec. Image analysis was performed using Image J, ICY and MetaMorph software packages. Calcium-free sea water: 450 mM NaCl, 9 mM KCl, 33 mM Na2SO4, 2.15 mM NaHCO3, 10 mM Tris pH 8, and 2.5 mM EGTA.
Micromanipulation. All manual micromanipulation experiments were performed on an Olympus IX70 microscope using a ×20 objective lens and Metamorph acquisition software. Embryos at the 4-cell stage were incubated with Cell Mask Orange diluted in sea water (1/1000) for 90 s then washed with sea water. Cell Mask labeled embryos were mounted at the 8-cell stage for observation. To prepare the nocodazole pipettes, nocodazole was added to liquid 1% low melt agarose in sea water giving afinal concentration of 20–50 µM nocodazole. Using a Narishige PN30 puller microinjection pipettes were pulled from GC100-T glass (filament-free) capillary tubes. The tips of the microinjection pipettes were broken and calibrated by microscopic observation. These micropipettes were dipped into the liquid nocodazole/agarose solution, placed at room temperature which caused the agarose containing nocodazole to solidify. These prepared microinjection needles were stored in humid chambers and used the same day. The nocodazole/agarose needles were advanced towards the 8-cell stage embryos and placed on the surface of one B4.1 blastomere near the CAB starting at nuclear envelope breakdown. Bright-field and fluorescence images were acquired every 10–20 s using Meta-Morph software package.
Synthesis of RNAs. We used the Gateway system (Invitrogen) to prepare N-terminal and C-terminal fusion constructs using pSPE3::Venus (a gift from P. Lemaire), pSPE3::Rfp1, pSPE3::Cherry, pSPE3::tomato for all constructs except PH::GFP which was cloned into pRN3. For construct details please refer to our previous methods publication38. All Kif2 constructs were prepared using Phallusia
mammillata Kif2 (unique gene ID: phmamm.g00002556) and Ciona intestinalis Kif2 (unique gene ID: Ciinte.g00008837). All synthetic mRNAs were transcribed and capped with mMessage mMachine kit (Ambion).
Bioinformatics and statistical analysis. We created a database of animal protein sequences derived from the complete genomes of various metazoan lineages: Amphimedon queenslandica, Mnemiopsis leidyi, Trichoplax adhaerens, Nematos-tella vectensis, Acropora digitifera, Hydra vulgaris, Crassostrea gigas, Aplysia cali-fornica, Capitella teleta, Lingula anatina, Caenorhabditis elegans, Drosophila melanogaster, Strongylocentrotus purpuratus, Branchiostomafloridae, Ciona intes-tinalis, Phallusia mammillata and Homo sapiens. All data was retrieved from the NCBI genomes portal:https://www.ncbi.nlm.nih.gov/genome/browse/. Phallusia mammillata unique gene ID phmamm.g00002556 and Ciona intestinalis unique gene ID Ciinte.g00008837 were used here and throughout for creating all molecular tools.
We searched this database with the PFAM Kinesin hidden Markov model [PMID: 26673716] using the global local strategy implemented in HMMER2 [http://hmmer.org/download.html] and the model specific ‘gathering threshold’ bit
scores as a cutoff. Kinesin regions (649 sequences), as defined by HMMER2 alignments, were extracted from full-length sequences and aligned using the MAFFT software package with default parameters [PMID: 12136088].
This alignment was used to create a phylogeny of all Kinesin domains, using the Bayesian approach implemented in phylobayes, with an LG + G model of sequence evolution [PMID: 19535536]. Two chains were run for 3500 generations. 700 generations were discarded as burnin. Although the chains had not converged, the region of the phylogeny around the human Kif2 proteins revealed a stable clade composed of orthologs of the human KIF19, KIF18, KIF24, and KIF2A/B/C genes with full support from posterior probabilities. The sequences representing this clade of orthologous groups were extracted. The Phallusia mammillata Kif13 protein sequence was added to the alignment, and another phylogeny reconstructed using the Phyml package with an LG + G evolutionary model and 100 bootstrap replicates [PMID: 20525638]. This tree is shown in Supplementary Fig.2.
Sample sizes vary between experiments. No statistical methods were used to predetermine sample size. Statistical significances were assessed using unpaired two-tailed Student’s t-test. F-test was used to determine variance and Kurtosis to determine skewness.
Data availability. All reagents are relevant data are available upon request.
Received: 8 August 2016 Accepted: 16 August 2017
References
1. Garzon-Coral, C., Fantana, H. A. & Howard, J. A force-generating machinery maintains the spindle at the cell center during mitosis. Science 352, 1124–1127 (2016).
2. Kern, D. M., Nicholls, P. K., Page, D. C. & Cheeseman, I. M. A mitotic SKAP isoform regulates spindle positioning at astral microtubule plus ends. J. Cell Biol. 213, 315–328 (2016).
3. Minc, N. & Piel, M. Predicting division plane position and orientation. Trends Cell. Biol. 22, 193–200 (2012).
4. Cowan, C. R. & Hyman, A. A. Asymmetric cell division in C. elegans: cortical polarity and spindle positioning. Annu. Rev. Cell Dev. Biol. 20, 427–453 (2004). 5. Kotak, S. & Gönczy, P. Mechanisms of spindle positioning: cortical force
generators in the limelight. Curr. Opin. Cell Biol. 25, 741–748 (2013). 6. Homma, N. et al. Kinesin superfamily protein 2A (KIF2A) functions in
suppression of collateral branch extension. Cell 114, 229–239 (2003). 7. Maor-Nof, M. et al. Axonal pruning is actively regulated by the
microtubule-destabilizing protein kinesin superfamily protein 2A. Cell Rep. 3, 971–977 (2013).
8. Siller, K. H. & Doe, C. Q. Spindle orientation during asymmetric cell division. Nat. Cell Biol. 11, 365–374 (2009).
9. Wessel, G. M. et al. The biology of the germ line in echinoderms. Mol. Reprod. Dev. 81, 679–711 (2014).
10. Galli, M. & van den Heuvel, S. Determination of the cleavage plane in early C. elegans embryos. Annu. Rev. Genet. 42, 389–411 (2008).
11. Grill, S. W., Gönczy, P., Stelzer, E. H. & Hyman, A. A. Polarity controls forces governing asymmetric spindle positioning in the Caenorhabditis elegans embryo. Nature 409, 630–633 (2001).
12. Labbé, J. C., Maddox, P. S., Salmon, E. D. & Goldstein, B. PAR proteins regulate microtubule dynamics at the cell cortex in C. elegans. Curr. Biol. 13, 707–714 (2003).
13. Kozlowski, C., Srayko, M. & Nedelec, F. Cortical microtubule contacts position the spindle in C. elegans embryos. Cell 129, 499–510 (2007).
14. Minc, N., Burgess, D. & Chang, F. Influence of cell geometry on division-plane positioning. Cell 144, 414–426 (2011).
15. Laan, L. et al. Cortical dynein controls microtubule dynamics to generate pulling forces that position microtubule asters. Cell 148, 502–514 (2012). 16. Lawrence, C. J. et al. A standardized kinesin nomenclature. J. Cell Biol. 167,
19–22 (2004).
17. Wordeman, L., Wagenbach, M. & von Dassow, G. MCAK facilitates chromosome movement by promoting kinetochore microtubule turnover. J. Cell Biol. 179, 869–879 (2007).
18. O’Rourke, S. M., Christensen, S. N. & Bowerman, B. Caenorhabditis elegans EFA-6 limits microtubule growth at the cell cortex. Nat. Cell Biol. 12, 1235–1241 (2010).
19. Gönczy, P. Mechanisms of asymmetric cell division:flies and worms pave the way. Nat. Rev. Mol. Cell Biol. 9, 355–366 (2008).
20. Galli, M. et al. aPKC phosphorylates NuMA-related LIN-5 to position the mitotic spindle during asymmetric division. Nat. Cell Biol. 13, 1132–1138 (2011).
21. Gotta, M., Dong, Y., Peterson, Y. K., Lanier, S. M. & Ahringer, J.
Asymmetrically distributed C. elegans homologs of AGS3/PINS control spindle position in the early embryo. Curr. Biol. 13, 1029–1037 (2003).
22. Tsou, M.-F., Hayashi, A. & Rose, L. S. LET-99 opposes Galpha/GPR signaling to generate asymmetry for spindle positioning in response to PAR and MES-1/ SRC-1 signaling. Development 130, 5717–5730 (2003).
23. Colombo, K. et al. Translation of polarity cues into asymmetric spindle positioning in Caenorhabditis elegans embryos. Science 300, 1957–1961 (2003). 24. Couwenbergs, C. et al. Heterotrimeric G protein signaling functions with
dynein to promote spindle positioning in C. elegans. J. Cell Biol. 179, 15–22 (2007).
25. Severson, A. F. & Bowerman, B. Myosin and the PAR proteins polarize microfilament-dependent forces that shape and position mitotic spindles in Caenorhabditis elegans. J. Cell Biol. 161, 21–26 (2003).
26. Collins, E. S., Balchand, S. K., Faraci, J. L., Wadsworth, P. & Lee, W.-L. Cell cycle-regulated cortical dynein/dynactin promotes symmetric cell division by differential pole motion in anaphase. Mol. Biol. Cell 23, 3380–3390 (2012). 27. Kiyomitsu, T. & Cheeseman, I. M. Cortical dynein and asymmetric membrane
elongation coordinately position the spindle in anaphase. Cell 154, 391–402 (2013).
28. Nguyen-Ngoc, T., Afshar, K. & Gönczy, P. Coupling of cortical dynein and Gα proteins mediates spindle positioning in Caenorhabditis elegans. Nat. Cell Biol. 9, 1294–1302 (2007).
29. Rabinowitz, J. S. & Lambert, J. D. Spiralian quartet developmental potential is regulated by specific localization elements that mediate asymmetric RNA segregation. Development 137, 4039–4049 (2010).
30. Lambert, J. D. Developmental patterns in spiralian embryos. Curr. Biol. 20, R72–R77 (2010).
31. Holy, J. & Schatten, G. Differential behavior of centrosomes in unequally dividing blastomeres during fourth cleavage of sea urchin embryos. J. Cell Sci. 98(Pt 3), 423–431 (1991).
32. Schroeder, T. E. Fourth cleavage of sea urchin blastomeres: microtubule patterns and myosin localization in equal and unequal cell divisions. Dev. Biol. 124, 9–22 (1987).
33. Hibino, T., Nishikata, T. & Nishida, H. Centrosome-attracting body: a novel structure closely related to unequal cleavages in the ascidian embryo. Dev. Growth Differ. 40, 85–95 (1998).
34. Prodon, F. et al. Dual mechanism controls asymmetric spindle position in ascidian germ cell precursors. Development 137, 2011–2021 (2010). 35. Nishikata, T., Hibino, T. & Nishida, H. The centrosome-attracting body,
microtubule system, and posterior egg cytoplasm are involved in positioning of cleavage planes in the ascidian embryo. Dev. Biol. 209, 72–85 (1999). 36. Patalano, S. et al. The aPKC-PAR-6-PAR-3 cell polarity complex localizes to
the centrosome attracting body, a macroscopic cortical structure responsible for asymmetric divisions in the early ascidian embryo. J. Cell Sci. 119, 1592–1603 (2006).
37. Paix, A., Le Nguyen, P. N. & Sardet, C. Bi-polarized translation of ascidian maternal mRNA determinant pem-1 associated with regulators of the translation machinery on cortical Endoplasmic Reticulum (cER). Dev. Biol. 357, 211–226 (2011).
38. McDougall, A. et al. Centrosomes and spindles in ascidian embryos and eggs. Methods Cell Biol. 129, 317–339 (2015).
39. Ren, X. & Weisblat, D. A. Asymmetrization offirst cleavage by transient disassembly of one spindle pole aster in the leech Helobdella robusta. Dev. Biol. 292, 103–115 (2006).
40. Paix, A., Chenevert, J. & Sardet, C. Localization and anchorage of maternal mRNAs to cortical structures of ascidian eggs and embryos using high resolution in situ hybridization. Methods Mol. . Biol. 714, 49–70 (2011). 41. Hirokawa, N. & Takemura, R. Kinesin superfamily proteins and their various