HAL Id: hal-00302864
https://hal.archives-ouvertes.fr/hal-00302864
Submitted on 18 Jun 2007
HAL is a multi-disciplinary open access
archive for the deposit and dissemination of
sci-entific research documents, whether they are
pub-lished or not. The documents may come from
teaching and research institutions in France or
abroad, or from public or private research centers.
L’archive ouverte pluridisciplinaire HAL, est
destinée au dépôt et à la diffusion de documents
scientifiques de niveau recherche, publiés ou non,
émanant des établissements d’enseignement et de
recherche français ou étrangers, des laboratoires
publics ou privés.
Application of local singularity in prospecting potential
oil/gas Targets
Shuyun Xie, Qiuming Cheng, Gao Chen, Zhijun Chen, Zhengyu Bao
To cite this version:
Shuyun Xie, Qiuming Cheng, Gao Chen, Zhijun Chen, Zhengyu Bao. Application of local singularity
in prospecting potential oil/gas Targets. Nonlinear Processes in Geophysics, European Geosciences
Union (EGU), 2007, 14 (3), pp.285-292. �hal-00302864�
www.nonlin-processes-geophys.net/14/285/2007/ © Author(s) 2007. This work is licensed
under a Creative Commons License.
Nonlinear Processes
in Geophysics
Application of local singularity in prospecting potential oil/gas
Targets
Shuyun Xie1,2, Qiuming Cheng1,3, Gao Chen4, Zhijun Chen1, and Zhengyu Bao1,2
1State Key Lab of Geological Processes and Mineral Resources, China University of Geosciences, Wuhan, 430074, China 2Faculty of Earth Sciences, China University of Geosciences, Wuhan, 430074, China
3Department of Earth and Space Science and Engineering, York University, Toronto, ON, M3J 1P3, Canada 4Southern Company of China Petrochemical Corporation, Kunming, Yunnan, 650021, China
Received: 14 February 2007 – Revised: 27 April 2007 – Accepted: 29 May 2007 – Published: 18 June 2007
Abstract. Together with generalized self-similarity and the
fractal spectrum, local singularity analysis has been intro-duced as one part of the new 3S principle and technique for mineral resource assessment based on multifractal modeling, which has been demonstrated to be useful for anomaly de-lineation. Local singularity is used in this paper to char-acterize the property of multifractal distribution patterns of geochemical indexes to delineate potential areas for oil/gas exploration using the advanced GeoDAS GIS technology. Geochemical data of four oil/gas indexes, consisting of acid-extracted methane (SC1), ethane (SC2), propane (SC3), and secondary carbonate (1C), from 9637 soil samples amassed within a large area of 11.2×10⁴ km2 in the Songpan-Aba district, Sichuan Province, southwestern China, were ana-lyzed. By eliminating the interference of geochemical oil/gas data with the method of media-modification and Kriging, the prospecting area defined by the local singularity model is better identified and the results show that the subareas with higher singularity exponents for the four oil/gas indexes are potential targets for oil/gas exploration. These areas in the shape of rings or half-rings are spatially associated with the location of the known producing drilling well in this area. The spatial relationship between the anomalies delineated by oil/gas geochemical data and distribution patterns of local singularity exponents is confirmed by using the stable iso-tope of δ13C.
1 Introduction
As one of the direct techniques used to prospect for petroleum resources, oil/gas geochemical exploration, from a geochemical point of view, can delineate the effective spaces and ranges of the oil/gas reservoirs and then appraise the
Correspondence to: Qiuming Cheng
oil/gas potential of study regions. Among various kinds of oil/gas geochemical exploration methods, hydrocarbon aci-dolysis and the 1C technique have attracted a lot of interest from many petroleum geologists. The analytical method for acid-extractable hydrocarbons occluded on surface soils was developed in the 1930s (Horvitz, 1939, 1972, 1985) and 1C in soils was believed to be an effective technique for oil/gas geochemical exploration (Duchscherer, 1988). By analyz-ing the association of surface geochemical indicators with a deep gas pool, one can obviously obtain large numbers of surface geochemical tracks from deep gas accumulations which are closely related to the type and scale of the deep gas accumulation area. Since their early uses, the hydro-carbon acidolysis method and 1C technique have become common in surface geochemical exploration and plenty of data derived from the two methods have been accumulated throughout the world. Nevertheless, because of diverse inter-ference factors, such as geographical conditions, sampling media, and variations of soil composition, some geochemi-cal signatures are not considered to be distinguishable from background signals with current methods used by the indus-try (Abrams, 2005). This could be one of the reasons why geochemical hydrocarbon exploration remains an unconven-tional approach in the petroleum industry and did not result in widdly used prospecting methods for oil/gas data process-ing although geochemical hydrocarbon exploration was sys-temically studied back in 1929 (Davidson, 1994; Saunders et al., 1999). To improve the application of these data to hy-drocarbon prospecting, many researchers have studied vari-ous data-processing methods since the 1990s, including in-terference elimination and anomaly recognition. However, the methods for anomaly recognition and interference elimi-nation based on classical statistics (Horvitz, 1985) can not be used effectively and still restrain the extraction of valuable information for oil/gas discovery because the data of interest can not meet the prerequisites of some typical statistic meth-ods, such as normal distributions of multi-source data; and
286 Shuyun Xie et al.: Application of local singularity in prospecting potential oil/gas targets
usually it is hard to separate background from anomalies by probability analysis.
In recent years, with the development of fractal theory, fractal and multifractal methods have become gradually re-garded as effective and efficient means to analyze spatial structures in oil fields, except for extensive application in metallic geochemical systems. Christopher and Paul (1995) discussed the frequency-size distribution of oil fields and Xie (2005) and Bao (2004) and Xie et al. (2005) presented the multifractal distribution patterns of different hydrocarbons in Tarim Basin, China. The concentration-area (C-A) multifrac-tal model (Cheng et al., 1994) has been applied to anomaly recognition based on wavelet analysis and it is believed tech-niques based on fractals and multifractals have greatly im-proved the prediction capability of the existing data (Zhang et al., 2006).
As one new multifractal theory applied in geosciences, lo-cal singularity has been used to analyze the hydrothermal mineralization processes of elements and delineate the po-tential mineralization district in metallic geochemical fields (Cheng, 2006a), to map the distribution patterns of geochem-ical data analyzed from samples collected from surface me-dia for mineral exploration (Cheng, 2000). As is generally known, metallic geochemical fields have some characteris-tics in common with petroleum regions, but there exist great discrepancies both in the mechanism of formation and in spa-tial structures between these two kinds of geochemical fields. What if we looked at the singularity patterns of oil/gas in-dexes and could the local singularity values help map the oil/gas anomalous trapping areas?
In this study, 9637 soil samples were taken from an area of 11.2×10⁴km2in the Songpan-Aba district, Sichuan Province, southwestern China, and four oil/gas geochemi-cal indexes, i.e. acid-extracted methane (SC1), ethane (SC2),
propane (SC3), and secondary carbonate (1C), which are believed to be of great significance for oil/gas exploration (Duchscherer, 1988), were measured. The data was ana-lyzed in order to recognize anomalous areas with the method of local singularity, which is available in an advanced Geo-DAS system (Cheng, 2000). 119 isotope data (δ13C) were then used to characterize the relationship between chemical composition anomalies and distribution patterns of oil/gas in-dexes in surface soils.
2 Local singularity principle
Since the concept underlying the multifractals was originally introduced by Mandelbrot (1972, 1974), many kinds of frac-tal and multifracfrac-tal models have been developed and ap-plied in different scientific fields to characterize self-similar or self-affine measures (Schertzer and Lovejoy, 1991; Ev-ertsz and Mandelbrot, 1992). Together with generalized self-similarity and fractal spectrum, local singularity has been introduced as one part of the new
“singularity-similarity-spectrum” (3S) principle and techniques for mineral re-source assessment based on multifractal modeling, which has been demonstrated to be useful for singularity analysis and anomaly delineation (Cheng, 2006a,b).
Singularity can be defined mathematically as the point where conventional mathematical modeling breaks down. One example of a singularity in the geometry of space would be a ”black hole”. From a geochemical point of view, sin-gularity could be defined as one special phenomenon with the anomalous accumulation of materials and abrupt release of energy during a short period and within a narrow space, which could be characterized by multifractal models and could be quantitatively described as the following power-law relationship (Cheng, 2006b):
µi(ε) ∝ εαi (1) where ∝ denotes proportionality and the measure µi(ε) de-notes the total amount of material in the i-th box with box size ε; and µi(ε)also could be expressed in an average den-sity format as below (Cheng, 1999):
µi(ε) ∝ ε2ρi (2) and, the density of material in the space could be transformed as:
ρi =εαi−2 (3) where αi is called the singularity exponent or local H¨older exponent (Evertsz and Mandelbrot, 1992), αi−2 is the ex-ponent of the power-law and value 2 in Eq. (2) and Eq. (3) is the Euclidean dimension of the 2-D boxes. As discussed above, when the material is evenly distributed in space, we will have α=2. Otherwise, for boxes relatively enriched with the material, µi(ε)will be larger than ε2. As we are mainly interested in the limit situation ε→0, we have ε≪1 and a larger µi(ε)means that local H¨older exponent αi is less than 2. The smaller the α values are, the stronger the local en-richment of the materials is in corresponding boxes. That is to say, α<2 corresponds to local enrichment. Similarly,
α>2 implies local depletion. Thus, if the singularity expo-nent values could be calculated and mapped, it will be very valuable to delineate the trapping areas of mineralization and oil/gas formation with association of spatial distribution pat-terns of singularity exponents. A method and the advanced GeoDAS GIS technical computer software has been devel-oped (Cheng, 2000) to map the distribution of singularity based on geochemical data of samples collected from sur-face media such as soil, water, and till. The current paper will use GeoDAS to map the singularity distribution patterns and then to delineate the oil/gas potential areas for an oil/gas geochemical survey.
3 Geochemical data
Songpan-Aba Basin is situated in Southwest China, ranging 31◦36′−34◦56′ of latitude and 101◦−105◦10′ of longitude,
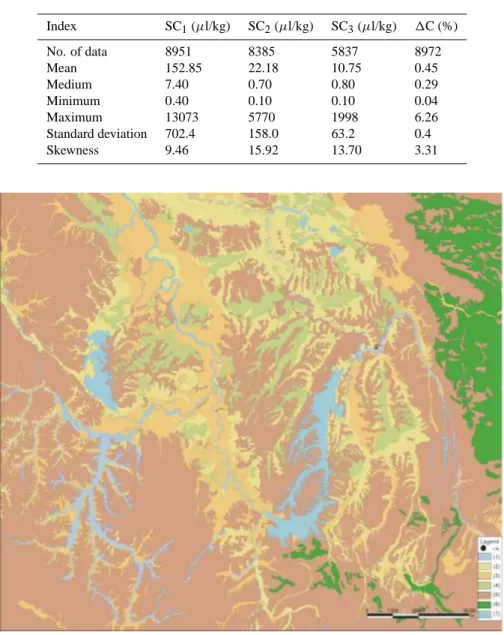
Table 1. Table of basic descriptive statistics for geochemical oil/gas indexes in Songpa-Aba area, Sichuan Province, Southwestern China. Index SC1(µl/kg) SC2(µl/kg) SC3(µl/kg) 1C (%) No. of data 8951 8385 5837 8972 Mean 152.85 22.18 10.75 0.45 Medium 7.40 0.70 0.80 0.29 Minimum 0.40 0.10 0.10 0.04 Maximum 13073 5770 1998 6.26 Standard deviation 702.4 158.0 63.2 0.4 Skewness 9.46 15.92 13.70 3.31
Fig. 1. The landscape of different types of surface soils in Songpan-Aba district. Different shades of gray are representative of different
sampling media: (1) Lacustrine deposits; (2) water-saturated marsh soil; (3) marsh soil; (4) Quaternary alluvial deposits; (5) poor soil overlying bed-rock; (6) forest or shrubbery soil; and (7) fluvial deposits.
covering an area of 11.2×10⁴ km2. South to the Sichuan basin, which is rich in natural gas, Songpan-Aba basin shares the same geological base with the Yangtze Platform and be-longs to one part of the ancient Yangtze landmass. The base-ment of the Songpan-Aba basin consists of dark lithologic sequences of early Paleozoic age, over 5000 m in thickness, and a late Paleozoic carbonate landmass covered with ma-rine sediments of the Triassic Period; and it is regarded as a new oil/gas prospecting area to be explored. The geographi-cal features and hence the sampling media are quite diverse. On the basis of a detailed remote sensing interpretation, the sampling materials on the surface of the study area could be
classified into seven types: (1) lacustrine deposits; (2) water saturated marsh soil; (3) marsh soil; (4) Quaternary alluvial deposits; (5) poor soil over bed-rocks; (6) forest or shrubbery soil; and (7) fluvial deposits (Fig. 1).
As one part of an ambitious oil/gas prospecting project, a surface geochemical survey had been conducted in the dis-trict in 2002 by the Training Center of Oil/Gas Geochemi-cal Exploration in Hefei, China PetrochemiGeochemi-cal Corporation. Samples were taken on a grid of 1×2 km and 9637 were col-lected with 15 geochemical variables measured for each sam-ple. Among these variables, acid-extractable methane (SC1),
288 Shuyun Xie et al.: Application of local singularity in prospecting potential oil/gas targets
are believed to be of great significance for oil/gas exploration (Duchscherer, 1988) and were used in this study to delineate the prospecting areas in this field. Since the concentrations of some indexes in certain samples are lower than the detec-tion limit, the available data of various indexes are different and the basic statistic parameters of each index are listed in Table 1. It can be seen that the standard deviations of the four indexes are comparatively high and the maximum values are quite a lot larger than the medium and mean contents. This may be due to outliers of data existing in some samples.
4 Data processing
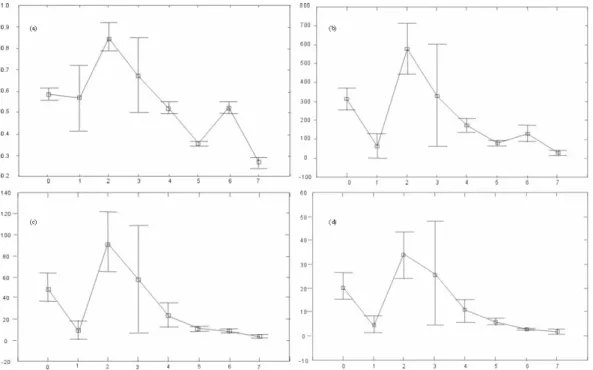
In Fig. 2 the minimum, medium, and maximum values of oil/gas indexes in different types of soils are displayed. The numbers in the abscissa represent the types of the soils and the vertical axis shows the contents of acid-extractable hy-drocarbon. The value at the center of the small pane rep-resents the medium content of each index, and the contents represented by the short lines above and below the pane stand for the maximum and minimum, respectively. The broken line is applied to show the content fluctuation of the index of interest by connecting the central dot in the small pane. It should be noted that different sampling media possess quite different contents of trapped light hydrocarbons. The highest medium values for all four hydrocarbons of study are from the water saturated marsh soils; and the contents of the in-dexes in the samples amassed from the marsh soils are also higher than the others except for those of the first type. But for the others, the content values are not so scattered but lim-ited to narrow ranges. We do not present interpretation de-tails here, but it can be seen that the characteristics within different types of soils are clearly different.
Figure 3a shows a geochemical contour map of original (non-preprocessing) contents of secondary carbonate (1C) performed by Surfer 8.0, using kriging with an exponen-tial semivariogram model. Comparing Fig. 3a with Fig. 1, it is quite clear that the main anomalous area of high val-ues shown in Fig. 3a approximately coincides with the ar-eas where the second and third types of soils are distributed (Fig. 1). The other three indexes used in the study also show the same kind of distribution tendency. This kind of differ-ence is significantly infludiffer-enced by the physical and chemical characteristics of the soils and it is hard to ascertain the rela-tionship between the anomalous area and the meaningful mi-croseepage from underlying potential oil/gas reservoirs. In fact, many studies have indicated that soil interference with its hydrocarbon content is quite common and results from the dilution by sand in soils or from condensation in clays or carbonates (Horvitz, 1985; Ruan and Cheng, 1992). From this perspective, the original data set is not sufficient to char-acterize the true spatial structures of any underlying oil/gas pool and some sort of category normalized data preprocess-ing seems necessary.
In order to eliminate the medium interference related to the oil/gas geochemical field, a procedure of categorized stan-dardization is employed in relation to each type of soil sam-ple. The transformation of the original data set xij consists of the following two steps:
The first is to reduce the discrepancy among different types of soil samples by normalization. On the basis of the soil classification, each type of soil sampling data has been trans-formed by Eq. (4):
xij′ = xij− ¯xj sj
(4)
where xij is the value of variable j (content of a certain hy-drocarbon) in sample i, ¯xj and sjrepresent the average value and standard deviation of variable j in each type of soil.
The second task is to eliminate negative values. Since the preceding transformation procedure generates a new data set
xij′ with some negative values, we therefore apply another standardization procedure to avoid negative data before log-transformation necessary for the calculation of local singu-larity exponents in the next sections. The standardization is achieved by:
xij′′ =
xij′ −xj min′
x′j max−xj min′ (5)
where xj′maxand x′jminare the maximum and minimum val-ues of the data set x′
ij for variable j in all samples, respec-tively; and the value which equals 0 was deleted directly. Af-ter this preprocessing, the subsequent data are all positive. The contour map generated with the same procedure was also employed for the analysis of the new data set x′′
ij for
1C. Unexpectedly, a similar trend of geochemical distribu-tion was obtained and is shown in Fig. 3b. The anomalies with high values of acid-extractable hydrocarbons are also located in the northern part of the study area. But it seems that the highly anomalous areas are smaller and the data dis-tribute more evenly on the contour map of Fig. 3b, which may reflect that data preprocessing has removed some out-liers from the data and has eliminated some kind of interfer-ence related to the soil compositions.
5 Results and discussion
The transformed values of acid-extractable methane (SC1),
ethane (SC2), propane (SC3), and secondary carbonate
con-tent (1C) from the soil samples were used for calculating and mapping of local singularities with the advanced Geo-DAS system. The half-window size r of each square window used for the calculation was set from 0.75 to 30.75 km with an interval of 1.5 km. As for edge effects, the local singu-larity exponents in the corners of every side of the area in study can not be calculated unless we would apply Kriging
Fig. 2. The variations in abundance of oil/gas geochemical indexes in different types of soil: 0- Non-classified soil samples; 1- lacustrine
deposits; 2- water saturated marsh soil; 3- marsh soil; 4- Quaternary alluvial deposits; 5- poor soil overlying bed-rock; 6- forest or shrubbery soil; and 7- fluvial deposits. (a) 1C; (b) SC1; (c) SC2; (d) SC3. The numbers along the abscissa represent the types of the soils and the
vertical axis shows the contents of acid-extractable hydrocarbon.
Fig. 3. 2-D structural contour map of secondary carbonate (1C) contents. (a) The contour map of 1C with original data; (b) the isoline map
of 1C with categorization-standardized data. Black solid lines are the regional boundaries of different counties within the area of study. The small circle with triangle inside it near the center is location of the drilling well, Hongcan 1#.
or other data processing methods. Here we only used the real data measured from the samples and so every side of the original area was reduced by 30.75 km. Consequently, the area for which local singularity exponents were estimated is smaller than that in Figs. 2 and 3.
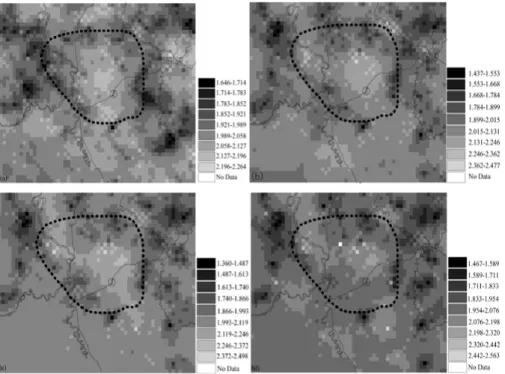
Figure 4 is the raster map of local singularities estimated by means of the windows-based method for the four oil/gas indexes of the study. The shades in Fig. 4 go from black to offwhite. The areas with α-value <2 are shown as jet black pixels, the areas with an α-value larger than 2 as offwhite
pixels, and those with medium levels of α-value close to 2 as gray pixels. Mostly inside the areas with dark color, a dashed line has been drawn on the map that shows a ring-shape anomalous zone of NW-SE orientation, which can be divided into separate cinctures. The offwhite pixel areas compose first central cincture, the center of which is close to the site of the commercial drilling well, Hongcan 1#. The smaller α-value area outside the dashed line with jet black pixels was delineated as the outermost cincture, and the in-termediate zone is between the off white central cinctures
290 Shuyun Xie et al.: Application of local singularity in prospecting potential oil/gas targets
Fig. 4. Estimated singularity α-values by the windows-based method with GeoDAS: (a) 1C; (b) SC1; (c) SC2; (d) SC3. Dark colored patterns represent low values. Polygons enclosed by the dashed line represent the favored target area delineated by local singularity values. The small circle included in the center is the location of the drilling well, Hongcan 1#.
and the dashed line. The three cinctures change gradually outerward from the center, as indicated by the shades of gray. This kind of α-value distribution pattern can be called a ring-shaped anomaly in surface geochemical exploration for oil and gas (Zhang et al., 1995). The inner cincture of the ring-type anomalous area is of stronger singularity (lower α-values) than outside the perimeter of the anoma-lous area. As explained above, strong singularity (lower α-values) may reflect strong accumulation of material, and on the contrary, relative depletion of material may show weak singularity (higher α-values). For major petroleum indica-tors in the oil/gas geochemical field, from the center to the border of the ring-shaped anomalous zone, the α-values de-crease gradually.
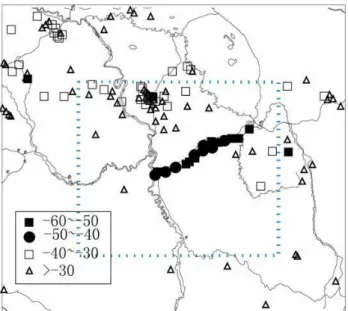
δ13C values of methane from 119 samples in the Songpan-Aba ring-type anomalous area (Fig. 5) range from −58.6 to 92.39‰, with −20.60‰ on average, which is heavier than the δ13C values of methane originating from both the Earth’s surface and those associated with a biogenic gas contribu-tion. Generally speaking, methane from the metamorphic re-actions and degassing of the Earth’s mantle typically shows a considerably heavier isotopic signature and the relative con-tent of the δ13C value is heavy, amounting to −40‰, whereas the contents of supergenic and biogenic methanes will con-tain relatively lighter isotopic compositions and their δ13C values would range from −70 to −60‰ on average (Stevens and Rust, 1982; Stevens and Engelkemeir, 1988; Kadir et al., 2005). In the central part of the anomalous area, the δ13C
values are mainly between −60 and −40‰ (Fig. 5); while in the marginal parts, they are greater than −40‰. As for the non-anomalous area, there is not any obvious concentration range. In brief, mainly lighter value dots of δ13C fall around the vicinity of Hongcan 1# and the center of the anomalous ring; and the dots on Fig. 5 with δ13C values higher than
−40‰ area distributed in a scattered fashion around the mar-gin of the ring.
The ring-shaped anomaly is a special kind of phenomenon that commonly occurs in soils above many reservoirs (Ruan, 1992). In these reservoirs, hydrocarbons will migrate up-wards in different ways, and the speed and strength of the migration changes according to their structural position. To-gether with the data of δ13C values, the generating mecha-nism for the ring-shaped singularity anomaly shown in Fig. 4 can be depicted as follows:
At the initial stage of vertical seepage of oil/gas ingre-dients, representing the channel of hydrocarbon migration, pores in the porous media are nearly empty. With time, on top of the oil/gas reservoir, massive hydrocarbon compounds enter into an oxidization belt through vertical seepage and release of CO2, which will then react with calcareous
miner-als in the cap rock to form carbonates (Duchscherer, 1988). With the continuous accumulation of secondary carbonates, the channel for vertical migration will become jammed by the carbonates and some pores will be filled with oil and gas. Consequently, water will be driven out to the edge of the oil/gas reservoir. Usually, oil/gas diffuses upwards to the
Fig. 5. The distribution of δ13C values in Songpan-Aba district. The area delineated by the dashed line is as large as the area in Fig. 4.
surface due to differences in concentration. Under this condi-tion, hydrocarbons migrate upwards to the surface with lower diffusion speed and accordingly the kinetic fractionation ef-fect of isotopes will be stronger (Zhang et al., 1995), which results in lower δ13C at the surface of the soil on top of the reservoir; i.e., the central part of the ring. As displayed in Fig. 5, the site where the lowest δ13C value occurs is close
to Hongcan 1#. The slow exchange of material will cor-respondingly lead to stronger fractionation of hydrocarbons with higher singularity (Fig. 4) in oil/gas/water systems.
Whereas at the margins of the reservoir, corresponding to the anomalous marginal zone, except diffusion, hydrocar-bons and other oil/gas ingredients will continuously traverse the pores of the bedrocks and then migrate toward the sur-face together with oil-field water. In this case, the fast mi-gration of hydrocarbons will result in weaker fractionation of isotopes and weaker singularity of hydrocarbons (Fig. 4). Thereby, often nearly reaching the surface, the carbon iso-tope composition of the highly concentrated methane will change slightly compared with its premigrated state, and thus the δ13C values at the margins of the anomalous ring will be heavier than those at the ring center (Fig. 5).
In such a case, the hydrocarbon anomaly areas of lower
α-values may be exactly at the edge of the underlying oil/gas reservoir, and the center of the anomaly ring’s perimeter may coincide with the position of the oil/gas deposit. Therefore, Hongcan 1# is of great importance in the oil/gas prospect-ing in this area and we believe drillprospect-ing close to it will brprospect-ing success; and the delineated areas could be considered as fa-vorable for detailed drilling and geological survey.
6 Conclusions
The application of the local singularity method to the oil/gas geochemical data demonstrates that the new multifractal the-ory has overcome some disadvantages of traditional spatial methods and therefore constitutes a powerful tool for extract-ing local hidden spatial information from oil/gas geochemi-cal data and for predicting undiscovered natural resources. Through the technique of local singularity analysis using the advanced GeoDAS system, one can extract new local in-formation from the patterns concerned and try to character-ize the tendency of enrichment and depletion of oil/gas in-dexes defined by underlying hydrocarbons. The center of the anomalous area delineated by the local singularity method in the current paper coincides with the producing drilling well.
Acknowledgements. Thanks are due to F. Agterberg at the Geolog-ical Survey of Canada, Ottawa, for his critGeolog-ical review of the paper and constructive comments. The authors are much in debted to L. Fanglin and Z. Zhi of China University of Geosciences (Wuhan) for their help in imagery processing and statistical analysis, and to T. Junhong of Hangzhou University of Electronic Technology, China, for her assistance in carrying out isotopic analysis. This re-search was jointly supported by the Natural Science Foundation of China (Grant no. 40502029, 40373003, 40525009, and 40638041). Edited by: A. Tarquis
Reviewed by: F. Agterberg
References
Abrams, M. A.: Significance of hydrocarbon seepage relative to petroleum generation and entrapment, Marine and Petroleum Ge-ology, 22, 457–477, 2005.
Cheng, Q., Agterberg, F. P., and Ballantyne, S. B.: The separation of geochemical anomalies from background by fractal methods, Exploration Geochemistry, 51, 109–130, 1994.
Cheng, Q.: Multifractality and spatial statistics, Computers and Geosciences, 25, 9, 949–961, 1999.
Cheng, Q.: GeoData Analysis System (GeoDAS) for mineral Ex-ploration: User’s Guide and Exercise Manual. Material for the training workshop on GeoDAS held at York University, Toronto, Canada, 1, 3, 204pp., http://www.gisworld.org/geodas, 2000. Cheng, Q.: Mapping singularities with stream sediment
geo-chemical data for prediction of undiscovered mineral deposits in Gejiu, Yunnan Province, China, Ore Geology Reviews, doi:10.1016/j.oregeorev.2006.10.002, 2006b.
Cheng, Q.: Singularity-generalized self-similarity-fractal spectrum (3S) model, earth Science, Journal of China University of geo-sciences, 31, 337–348, 2006a.
Christopher, C. B. and Paul, R. L.: Fractals in Petroleum Geology and Earth Processes, Plenum Press, New York, 317pp., 1995. Davidson, M. J.: On the acceptance and rejection of surface
geo-chemical exploration, Oil & Gas Journal, 94, 23, 70–76, 1994. Duchscherer Jr., Wm.: Integrating geochemical techniques found
useful, World Oil, 207, 81–84, 1988.
Evertsz, C. J. G., and Mandelbrot, B. B.: Multifractal measures (Appendix B) [A], in: Chaos and Fractals [C], edited by: Peitgen,
292 Shuyun Xie et al.: Application of local singularity in prospecting potential oil/gas targets
H.-O., Jurgens, H., and Saupe, D., Springer Verlag, New York, 922–953, 1992.
Horvitz, L.: On geochemical prospecting – I, Geophysics, 4(2), 210–229, 1939.
Horvitz, L.: Vegetation and geochemical prospecting for petroleum, AAPG Bulletin, 56(5), 925–940, 1972.
Horvitz, L.: Geochemical exploration for petroleum, Science, 229, 4716, 821–827, 1985.
Kadir, G., Philp, R. P., Chris C., Hasan, E., and Muzaffer, S.: Geo-chemical and isotopic approach to maturity/source/mixing esti-mations for natural gas and associated condensates in the Thrace Basin, NW Turkey, Appl. Geochemistry, 20, 2017–2037, 2005. Mandelbrot, B. B.: Possible refinement of the lognormal
hypothe-sis concerning the distribution of energy dissipation in intermit-tent turbulence, in: Statistical Models and Turbulence, edited by: Rosenblatt, M. and Van Atta, C., Lecture Notes in Physics 12, Springer, New York, pp. 333–351, 1972.
Mandelbrot, B. B.: Intermittent turbulence in self-similar cascades: Divergence of high moments and dimension of the carrier, J. Fluid Mechanics, v. 62, p. 331–358, 1974.
Ruan, T. and Cheng, J.: Exploration Geochemistry for Oil and Gas, The Press of China University of Geosciences, Wuhan, 120 pp (in Chinese), 1992.
Saunders, D. F., Burson, K. R., and Thompson, K.: Model for hydrocarbon microseepage and related near-surface alternation, AAPG Bulletin, 8(1), 170–185, 1999.
Schertzer, D. and Lovejoy, S.: Non-linear Variability in Geophysics, Kluwer Academic Publishers, Dordrecht, 318 pp, 1991. Stevens, C. M. and Rust, F. E.: The carbon isotopic composition of
atmospheric methane, J. Geophys. Res., 87, 4879–4882, 1982. Stevens, C. M. and Engelkemeir, A.: Stable carbon isotopic
compo-sition of methane from some natural and anthropogenic sources, Journal of Geophysical Research, 93, 725–733, 1988.
Xie, S. and Bao, Z.: Fractal and multifractal properties of geochem-ical fields, Mathematgeochem-ical Geology, 36, 7, 847-864, 2004. Xie, S., Bao, Z., Su, J., and Jia, X.: Multifractal properties of oil
and gas indexes in the southern Aixieke-Sangtamu Region of Xinjiang, China (In Chinese with English Abstract), Geological Review, 51, 1, 107–112, 2005.
Zhang, L., Bai, G., Zhao, K., and Sun, C.: Restudy of acid-extractable hydrocarbon data from surface geochemical survey in the Yimeng Uplift of the Ordos Basin, China: Improve-ment of geochemical prospecting for hydrocarbons, Marine and Petroleum Geology, 23, 529–542, 2006.
Zhang, P., Wang, X., Sheng, Q., and Zhang, Q.: Carbon isotope composition characteristics of 1C in the soil of ring-type anoma-lous area of surface geochemical exploration for oil and gas in the Taolimian district, Chinese Science Bulletin, 40, 2, 173–174, 1995.