HAL Id: cea-00994891
https://hal-cea.archives-ouvertes.fr/cea-00994891
Submitted on 2 Nov 2020
HAL is a multi-disciplinary open access
archive for the deposit and dissemination of
sci-entific research documents, whether they are
pub-lished or not. The documents may come from
teaching and research institutions in France or
abroad, or from public or private research centers.
L’archive ouverte pluridisciplinaire HAL, est
destinée au dépôt et à la diffusion de documents
scientifiques de niveau recherche, publiés ou non,
émanant des établissements d’enseignement et de
recherche français ou étrangers, des laboratoires
publics ou privés.
Distributed under a Creative Commons Attribution| 4.0 International License
The lesser role of starbursts in star formation at z = 2
G. Rodighiero, Emanuele Daddi, E. Baronchelli, I. Cimatti, A. Renzini, A.
Aussel, H. Popesso, P. Lutz, D. Andreani, P. Berta, et al.
To cite this version:
G. Rodighiero, Emanuele Daddi, E. Baronchelli, I. Cimatti, A. Renzini, et al.. The lesser role of
starbursts in star formation at z = 2. The Astrophysical journal letters, Bristol : IOP Publishing,
2011, 739 (2), pp.L40. �10.1088/2041-8205/739/2/L40�. �cea-00994891�
arXiv:1108.0933v1 [astro-ph.CO] 3 Aug 2011
THE LESSER ROLE OF STARBURSTSFOR STAR FORMATION AT z = 2
G. Rodighiero1,2, E. Daddi,3, I. Baronchelli1, A. Cimatti4, A. Renzini5, H. Aussel3, P. Popesso6, D. Lutz6, P. Andreani7, S. Berta6, A. Cava8, D. Elbaz3, A. Feltre1, A. Fontana9, N. M. F¨orster Schreiber6, A.
Franceschini1, R. Genzel6, A. Grazian9, C. Gruppioni10, O. Ilbert11, E. Le Floch3, G. Magdis,3,12, M. Magliocchetti13, B. Magnelli6, R. Maiolino9, H. McCracken14, R. Nordon6, A. Poglitsch6, P. Santini9, F.
Pozzi4, L. Riguccini3, L.J. Tacconi6, S. Wuyts6, G. Zamorani10
Accepted in Astrophysical Journal Letter
ABSTRACT
Two main modes of star formation are know to control the growth of galaxies: a relatively steady one in disk-like galaxies, defining a tight star formation rate (SFR)-stellar mass sequence, and a starburst mode in outliers to such a sequence which is generally interpreted as driven by merging. Such starburst galaxies are rare but have much higher SFRs, and it is of interest to establish the relative importance of these two modes. PACS/Herschel observations over the whole COSMOS and GOODS-South fields, in conjunction with previous optical/near-IR data, have allowed us to accurately quantify for the first time the relative contribution of the two modes to the global SFR density in the redshift interval 1.5 < z < 2.5, i.e., at the cosmic peak of the star formation activity. The logarithmic distributions of galaxy SFRs at fixed stellar mass are well described by Gaussians, with starburst galaxies representing only a relatively minor deviation that becomes apparent for SFRs more than 4 times higher than on the main sequence. Such starburst galaxies represent only 2% of mass-selected star forming galaxies and account for only 10% of the cosmic SFR density at z ∼ 2. Only when limited to SFR> 1000M⊙/yr, off-sequence sources significantly contribute to the SFR density (46 ± 20%).
We conclude that merger-driven starbursts play a relatively minor role for the formation of stars in galaxies, whereas they may represent a critical phase towards the quenching of star formation and morphological transformation in galaxies.
Subject headings:galaxies: evolution — galaxies: interactions — galaxies: nuclei — galaxies: starburst
1. INTRODUCTION
Star forming galaxies follow a tight correlation between their stellar mass (M∗) and star formation rate (SFR),
defining a main sequence (MS) that has been recognized
Herschel is an ESA space observatory with science instruments provided by European-led Principal Investigator consortia and with important participation from NASA.
1
Dipartimento di Astronomia, Universita’ di Padova, Vicolo dell’Osservatorio 3, I-35122, Italy
2
email: [email protected]
3
Laboratoire AIM, CEA/DSM-CNRS-Universit´e Paris
Diderot, IRFU/Service d’Astrophysique, Bˆat.709, CEA-Saclay,
91191 Gif-sur-Yvette Cedex, France.
4
Dipartimento di Astronomia, Universit`a di Bologna, via
Ranzani 1, I-40127 Bologna, Italy
5
INAF-Osservatorio Astronomico di Padova, Vicolo
dell’Osservatorio 2, I-35122 Padova, Italy
6
Max-Planck-Institut f¨ur extraterrestrische Physik, Postfach
1312, 85741 Garching, Germany
7
European Southern Observatory, Karl-Schwarzschild-Str. 2, 85748 Garching, Germany
8
Departamento de Astrof´ısica, Facultad de CC. F´ısicas, Universidad Complutense de Madrid, E-28040 Madrid, Spain
9
INAF-Osservatorio Astronomico di Roma, via di Frascati 33, 00040 Monte Porzio Catone, Italy
10
INAF-Osservatorio Astronomico di Bologna, Via Ranzani 1, I-40127, Bologna, Italy
11
Laboratoire d’Astrophysique de Marseille, Universite de Provence, CNRS, BP 8, Traverse du Siphon, 13376 Marseille Cedex 12, France
12
Department of Physics, University of Oxford, Keble Road, Oxford OX1 3RH
13
INAF-IFSI, Via Fosso del Cavaliere 100, I-00133 Roma, Italy
14
Institut d’Astrophysique de Paris, UMR7095 CNRS,
Universit´e Pierre et Marie Curie, 98 bis Boulevard Arago, 75014
Paris, France
in the local Universe (Brinchmann et al. 2004; Salim et al. 2007; Peng et al. 2010), as well as at intermediate redshifts 0.5 < z < 3 (Noeske et al. 2007; Elbaz et al. 2007; Daddi et al. 2007; Pannella et al. 2009; Rodighiero et al. 2010a, Karim et al. 2011), and beyond (Daddi et al. 2009; Gonzalez et al. 2010). With SFR ∝ Mα
∗, the
slope α can differ substantially depending on sample se-lection and the procedures for measuring SFR and M∗,
with values in the above literature ranging from ∼ 0.6 to ∼1. Moreover, its normalization rapidly rises from z = 0 to z ∼ 2–2.5 as (1 + z)∼3.5, then flattening all the way to
the highest redshifts (Daddi et al. 2007, Rodighiero et al. 2010a; Karim et al. 2011). Slope and normalization of the SFR−M∗relation play a crucial role in the growth of
galaxies and in the evolution of their mass function (Ren-zini 2009; Peng et al. 2010, 2011). Observations of the CO molecular gas content of MS galaxies indicate that their star formation efficiency does not depend strongly on cosmic epoch to z ∼ 2, with the SFR increase being due to higher molecular gas fractions (Daddi et al. 2008; 2010a; Tacconi et al. 2010; Geach et al. 2011).
On the other hand, outliers are known to exist, with very high specific SFR (SSFR) compared to normal MS galaxies, such as local ultra-luminous infrared galaxies (ULIRG, Sanders & Mirabel 1996, Elbaz et al. 2007), and at least some of the submm-selected galaxies (SMG) at 1 < z < 4 (Tacconi et al. 2008; Daddi et al. 2007; 2009; Takagi et al. 2008). What does differentiate such active behemoths from the dominant MS population? Outliers are galaxies in which the SSFR has been boosted by some event, possibly a major merger (e.g., Mihos & Hernquist 1996; di Matteo et al. 2008; Martig et al. 2010;
2 Rodighiero et al. Bournaud et al. 2011), as suggested by local ULIRGs
and SMGs being dominated by gas-rich major mergers (e.g. Sanders et al. 1988). Indeed, MS galaxies and outliers appear to be in different star formation regimes: a quasi–steady, long–lasting mode for disks and a more rapid, starburst mode in major mergers or in the densest SF regions (Daddi et al. 2010b; Genzel et al. 2010).
So far it has been unclear by which of these two modes most of the stars in galaxies were formed. While MS galaxies are optically thin in the UV (Daddi et al. 2005; 2007), MS outliers are generally optically thick (Goldader et al. 2002, Chapman et al. 2005) and far-IR observa-tions are required to reliably derive their SFRs. The PACS camera (Poglitsch et al. 2010) onboard Herschel (Pilbratt et al. 2010) now allows for the first time to ob-tain deep far-IR observation probing SFRs down to MS levels for typical galaxies with M∗ ∼1010M⊙ at z ∼ 2,
i.e., at the peak epoch of the cosmic SFR density and of the space density of SMGs (Chapman et al. 2005). In this letter we combine wide area PACS observations of the COSMOS field with deeper data in the GOODS field, both taken as a part of the PEP survey (Lutz et al. 2011), and obtain a first accurate estimate of the relative role of MS and outlier galaxies on the formation of stars at z ∼ 2. Red and dead (passive) galaxies, though, exist at these cosmic epochs, and form a separate sequence be-low the MS of star-forming galaxies. Their contribution will be ignored in this Letter. We use a Salpeter IMF and a standard WMAP cosmology.
2. SAMPLE SELECTION AND MEASUREMENTS
In order to obtain a meaningful census of star-forming galaxies on and off the MS, one has to cover the SFR−M∗
plane down to low SFR and M∗ levels, and do so over a
large area to include rare objects with the highest SFRs. We reach this goal by combining far-IR-selected (i.e., SFR-selected) and near-IR-selected (i.e., M∗-selected)
star-forming samples in the COSMOS and in GOODS-South fields, having both UV- and far IR-based SFR de-terminations. We first describe the datasets used, sample selections and SFR and M∗ measurements. We consider
only galaxies within the redshift range of 1.5 < z < 2.5, based either on spectroscopic or photometric redshifts. The datasets include in total 576 and 122 PACS-detected galaxies in the COSMOS and GOODS-South fields, re-spectively, and 18,981 and 586 BzK-selected (cf. Daddi et al. 2004) sources in the COSMOS and GOODS-South fields.
2.1. SFR-selected Herschel samples
Herschel-PACS observations cover 2.04 square degrees over the COSMOS field down to a 5σ limit of 8 and 17 mJy at 100 and 160 µm, respectively, well above con-fusion limits (Lutz et al. 2011). Blending is not a major issue in the PACS data, and photometry was carried out by PSF-fitting at 24µm prior positions. The detection limits correspond to ∼ 200 M⊙ yr−1 at z ∼ 2 (rising to
300M⊙ yr−1 at z=2.5). We cross-matched over a
com-mon area of 1.73 square degrees the PACS detections with the IRAC-selected catalog of Ilbert et al. (2010), so to obtain UV-to-8µm photometry, accurate photometric redshifts and stellar masses by SED fits as described in Rodighiero et al. (2010b). At z ∼ 2 the mass complete-ness is granted above ∼ 1010M
⊙(Ilbert et al. 2010). IR
luminosities (hence SFRs) are derived from PACS fluxes using a set of empirical templates of local objects (Pol-letta et al. 2007; Gruppioni et al. 2010) as described in Rodighiero et al. (2010a). If, instead, we adopt the templates from Chary & Elbaz (2001), consistent SFR estimates are obtained with no bias and a scatter of ∼0.15 dex (that represents the typical error associated to our SFRs) . The PACS data in GOODS are deeper than those in COSMOS, reaching 5σ detection levels of 1.8, 2.0 and 4.0 mJy at 70, 100 and 160 µm, respectively (Berta et al. 2011). The typical SFR limit at z ∼ 2 is ∼ 50M⊙ yr−1. For PACS data reduction, photometry,
far-IR based SFRs, and M∗ estimates we proceeded as
for the COSMOS field.
2.2. Mass-selected BzK samples
For the GOODS-S field we used the K-band selected sample of star-forming BzK galaxies from Daddi et al. (2007), which reaches ∼ M∗ ∼ 1010M
⊙ over a 120
arcmin2 field, with SFR estimated from the UV
rest-frame luminosity corrected for dust reddening and tak-ing advantage of a substantial fraction of spectroscopic redshifts. The deep BzK GOODS sample was comple-mented with the larger statistics (in particular for the more massive sources) provided by the BzK sample over the COSMOS field (McCracken et al. 2010), where here masses and SFRs have been computed using the same procedure as in Daddi et al. (2007), with typical errors of a factor ∼ 2.
Use of UV-based SFRs allows one to reach down to a few M⊙ yr−1 at z ∼ 2. Daddi et al. (2007)
per-formed detailed comparisons of UV-based SFRs with 70µm, 850µm, radio and X-ray based SFRs from stack-ing, finding good agreement. Pannella et al. (2009) used more than 30,000 BzK-selected galaxies in COS-MOS, finding that UV-based SFRs were slightly under-estimated compared to radio. More recently Nordon et al. (2010) suggest that UV-based SFRs might actually be overestimated up to a factor of 1.5-2 at z ∼ 2, using Herschel observations (although see Wuyts et al. 2011a for a discussion of how this conclusion depends on sam-ple selections). This relatively low level of uncertainty does not affect the main conclusion of this paper.
3. RESULTS
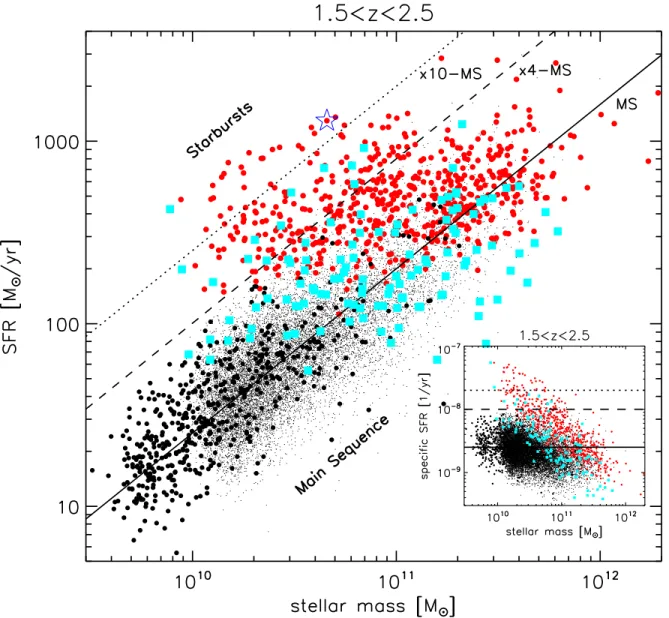
Fig. 1 shows the SFRs versus stellar masses for the four 1.5 < z < 2.5 galaxy samples in this study. At first sight the PACS-based SFR−M∗ relation for the
COSMOS sample (red symbols) bears little resemblance to the corresponding UV-based relation (black points). PACS-based SFRs run almost flat with mass, as opposed to the UV-based SFRs that increase almost linearly with mass. We maintain that this different behavior is due to the different selection of the two samples, one being SFR limited, the other being mass limited. It is imme-diately apparent from Fig. 1 that the vast majority of BzK-selected galaxies of a few to several 1010M
⊙are not
detected by PACS, implying that their SFR is lower than 200−300 M⊙yr−1. Hence the intrinsic SFR−M∗relation
must be steeper than suggested by the PACS data alone. That this must be the case is indicated by the deeper PACS data over the GOODS field (cyan points), which start populating to lower stellar masses the MS defined
Figure 1. Stellar mass – Star Formation Rate relation at 1.5 < z < 2.5. We use four main samples: the ”shallow” PACS-COSMOS sources (red filled circles), the deeper PACS-GOODS South (cyan squares), the BzK-GOODS sample (black filled circles) and the BzK-COSMOS sources (black dots). The solid black line indicates the main sequence (MS) for star-forming galaxies at z ∼ 2 defined by Daddi et al. (2007), while the dotted and dashed lines mark the loci 10 and 4 times above the MS (along the SFR axis), respectively. The star indicates the PACS source detected by Aztec at 1.1mm in the COSMOS field. In the smaller inset, we show the same information as in the main panel, however here the stellar mass is presented as a function of the SSFR.
by the BzK-selected sample with UV-based SFRs. Still, the PACS SFR-selection cut is visible at ∼ 60 M⊙/yr,
and most BzK galaxies remain undetected below this limit.
The PACS-GOODS sample also allows to populate the region with excess SFRs above the MS, something harder to do with UV-based SFRs due to obscuration. The com-bination of such datasets is clearly ideal to obtain a sta-tistical census of high-SFR galaxies as well as high SSFR (see the insert of Fig. 1). Indeed, half of PACS-detected sources over the COSMOS field, either do not have a BzK counterpart, or their SFR is a factor ∼ 4 or more higher than their UV-based SFR. We interpret this as evidence that most of the SF activity in these galaxies is heavily dust-obscured in the UV.
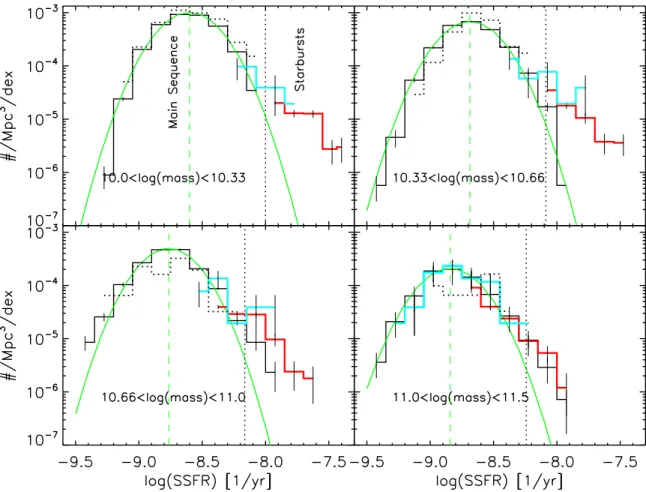
In order to investigate the frequency and relative role of galaxies on and off the MS, we have derived the
num-ber density distribution of galaxies in four stellar mass bins as a function of their SSFR (see Fig. 2). We assume no redshift incompleteness for the BzK galaxies over the 1.5 < z < 2.5 range (see, e.g., McCracken et al. 2010), whereas for PACS galaxies the flux limits imply different SFR limits as a function of redshifts. Therefore, 1/Vmax
corrections were computed with the same templates used to derive the IR luminosities. This procedure implicitly assumes no strong evolution of the number density of the population in the probed redshift range. This is con-firmed by the average V /Vmax being 0.504 ± 0.023 and
0.56 ± 0.05, for the COSMOS- and GOODS-PACS sam-ples, respectively. The SSFR distributions from the four samples agree within the errors (Poisson) in the regions of overlap, providing an important cross-check of the so-lidity of our approach.
distri-4 Rodighiero et al.
Figure 2. Distribution of the SSFR for the four samples, corrected by the corresponding comoving volumes and after accounting for
volume and selection incompleteness, splitted in four mass bins. The dotted-black, solid-black, cyan and red histograms correspond to the BzK-GOODS, BzK-COSMOS, PACS-GOODS South and PACS-COSMOS data-sets. Error bars are Poisson. The green curves show the Gaussian fits to the black-solid histograms. The green dashed vertical lines mark the vertex of each best-fit Gaussian, and the dotted black vertical lines +0.6 dex above show our choice to separate ON- and OFF-sequence galaxies along the SSFR distribution.
bution functions shown in Fig. 2 allow us to objectively define MS outliers, hence starburst galaxies. To this pur-pose, Gaussians functions are fitted to the BzK distribu-tions in the four mass bins, resulting in a nearly constant σ = 0.24 dex, slightly lower than reported in Daddi et al. (2007). Deviations from the Gaussian distributions start to be clearly detected at SSFRs 0.6 dex above the average (Fig. 2; or some 2.5σ), and we adopt this thresh-old to define on-sequence and off-sequence galaxies. Such deviations are less obvious in the highest mass bin. We also note that the peak positions of the Gaussians shift as a function of the bin central mass, with a slope of 0.79 ± 0.04 in the log(SFR)–log(M∗) relation15(slightly
shallower than the 0.9 slope reported by Daddi et al. 2007). It is worth emphasizing the good agreement of the four independent samples in the common SSFR bins, in particular for M∗> 1011M⊙, where PACS-GOODS fully
samples the MS distribution around its peak. In this case the UV and IR SFR tracers define exactly the same Gaussian distribution.
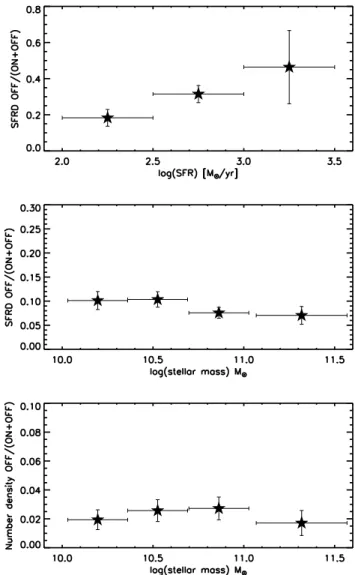
From the histograms in Fig. 2 we have estimated the relative contribution of on-sequence and off-sequence galaxies to the total comoving number density and SFR density, in absolute (Fig. 3) as well as relative (Fig. 4)
15
The MS best-fit is log(SFR)=-6.42+log(mass)*0.79
terms. The space density of galaxies in the highest mass bin is getting lower, as we are entering the exponentially decaying part of the mass function. The MS population dominates the SFR density at all masses, whereas off-sequence starburst galaxies contribute almost constantly ∼ 10% of the total, or even less since some outliers may actually be MS objects with exceptionally large er-rors (in either SFR or M∗). If a top-heavy IMF were
really to apply to starbursts, then this fraction would even be largely reduced. The number density of off-sequence sources is also very small, varying between 2 and 3% as a function of the stellar mass. Only in SFR-limited samples (Fig. 4), off-sequence galaxies be-come important representing 46 ± 20% of the galaxies with SFR> 1000 M⊙ yr−1 and 20±4% of those with
SFR> 100 M⊙ yr−1. This suggests that even among
SMGs (or luminous Herschel selected populations) only a fraction of the galaxies are strong MS outliers.
4. COMBINING UV AND IR SFR TRACERS
An important aspect of this work concerns the combi-nation of UV-based and IR-based SFR indicators for the sources for which both data are available. Indeed, about 70%(80%) of the COSMOS(GOODS) PACS sources have a BzK counterpart. For ∼ 30% of these PACS-detected galaxies the IR-based SFRs exceed the UV-based SFRs
Figure 3. SFR density (top panel) and number density (bottom panel) of ON sequence sources (blue open squares) and OFF se-quence sources (red filled squares), in the four mass bins considered in Fig. 2. Error bars are Poisson.
by factors of 4–10, that we qualify as optically thick star-bursts. For these sources the SFR(UV) is totally unreli-able. However, these objects are almost all outliers from the MS, and they represent only ∼ 2% of the total BzK population. For the other objects, a direct comparison of UV-based and far IR-based SFRs for GOODS BzK-selected galaxies shows reasonably good agreement, con-sistently with the results of Nordon et al. (2010) and Reddy et al. (2011 in prep.).
To further test the reliability of the SFR(UV), we an-alyzed the BzK population with SFR(UV) in the same SFR range accessible by PACS in the deep GOODS field. We restricted our analysis to 60 <SFR(UV)< 300M⊙/yr
objects in two mass bins: a) 10.0 <log(M)< 10.75M⊙
and b) 10.75 <log(M)< 11.0M⊙, and then stacked on
the 160µm map the BzK PACS-undetected sources com-bining them with PACS detections to get a mean far-IR SFR for the BzK samples (as in Rodighiero et al. 2010a). For the two mass bins the result is: a) <SFR(UV)>= 79 ± 1M⊙/yr and <SFR(PACS)>= 69 ± 10M⊙/yr; b)
<SFR(UV)>= 126 ± 1M⊙/yr and <SFR(PACS)>=
113 ± 6M⊙/yr. Reassuringly, in the common mass and
SFR ranges, the PACS and UV SFR are in excellent agreement (with only ∼10% of UV overestimation in the highest mass bin that would not affect the conclusion of this work).
Summarizing, we found that PACS and UV based SFRs are in good agreement along the MS, while the off-sequence discrepancies (i.e., objects for which UV can dangerously underestimate the actual SFR) are due to dust obscuration at high SFR levels. These objects represent ∼ 2% of star-forming galaxies at z ∼ 2 and M∗> 1010M⊙.
Figure 4. Contribution of OFF sequence galaxies to the total
SFR density in different SFR bins (top panel) and stellar mass bins (middle panel). In the bottom panel we also report the num-ber density percentage of OFF sequence sources. Error bars are Poisson.
5. THE MOST EXTREME STAR FORMING
SOURCES AND THE OBSCURED AGN ACTIVITY
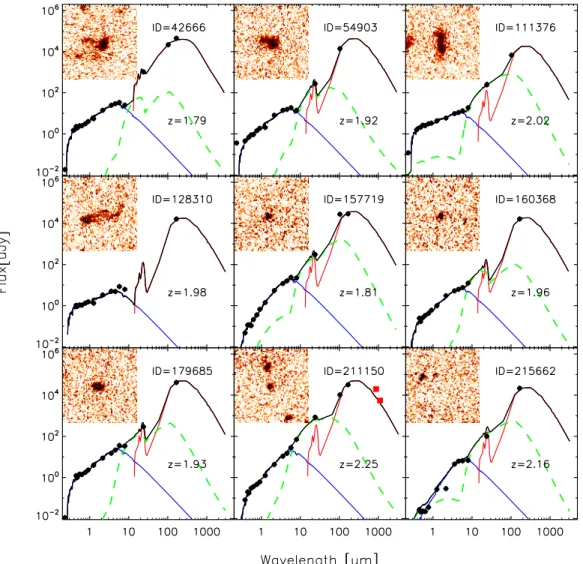
We have shown that the distribution of SSFRs in z ∼ 2 massive galaxies are largely Gaussian with σ of 0.24 dex, and relatively minor deviations only detected above 0.6 dex of the main trend. Although some of these high SSFR galaxies will just be normal MS galaxies being scattered there by measurement errors, we conservatively identify all of them as (merging-driven) starbursts. Of course, also galaxies that are still on the MS can be wit-nessing merging events, given that not all mergers are expected to produce strong SFR enhancements (di Mat-teo et al. 2008), hence our off-sequence galaxies can be seen as objects where a major merger event has substan-tially boosted the SSFR, increasing it by a factor of ≥ 4. In order to investigate the nature of off-MS galaxies we have focused on the most extreme 28 objects, lying a fac-tor 10 above the MS. We performed a simultaneous three components SED fitting analysis including the emission
6 Rodighiero et al. of stars and star-heated dust, and allowing also for the
presence of a dusty torus (AGN), using the method de-scribed in Fritz et al. (2006). In Fig. 5 we report an example of the resulting SED fitting obtained for 9 rep-resentative objects, selected among the 28 sources. The presence of an AGN is required in most cases (25 out of 28) to reproduce the 24µm emission, while its con-tribution to the L[8 − 1000µm] is always lower than 5-10%, thus negligible. None of the 16 galaxies observed by Chandra is detected (Elvis et al. 2009), suggesting that the AGNs are extremely obscured. These objects are probably similar to the Fe Kα emitting Compton
thick QSO at z = 2.5 from Feruglio et al. (2011), that qualifies as a starburst galaxy according to our criterion. Only 2 of our 28 sources fall in the AzTEC area (Scott et al. 2008), and one of them is detected in the millimeter catalog. Fig. 5 also reports ACS-F775W cutouts for the example objects. A few objects are consistent with ad-vanced stage mergers (double components on the I-band ACS COSMOS image, Koekemoer, A.M. et al. 2007), others are quite compact (consistent with the analysis of Elbaz et al. 2011), whereas some remain undetected. A more extended morphological analysis is postponed to a future paper (but see also Wuyts et al., 2011b).
6. DISCUSSION
The redshift range 1.5 < z < 2.5 corresponds to a ∼ 2 Gyr cosmic time interval, hence our star-forming galaxies have on average spent in it ∼ 1 Gyr. There-fore, the fact that only ∼ 2% of the massive galaxies are off the main sequence implies that on average each galaxy spends ∼ 20 Myr in such a phase. This is actually much shorter than both the gas depletion timescale and the (outer rotation) dynamical time in starburst galaxies (Daddi et al. 2010; Genzel et al. 2010). This is also much shorter than the expected duration of the SFR-excess phase in mergers based on numerical simulations (e.g. di Matteo et al. 2008, Martig et al. 2010), where the duration of the phase with SFR in excess of > 4 over the pre-merger SFR is of order of 200-300 Myr (Bournaud et al. 2011). Most likely this is because only a fraction of massive star-forming galaxies undergoes major mergers during this time interval, and/or because most mergers do not produce a substantial increase of the SFR (con-sistent with the simulations of di Matteo et al. 2008).
All in all, our results quite clearly show that the merger-enhanced SFR phases are relatively unimportant for the formation of stars in z ∼ 2 galaxies, and proba-bly at all redshifts given that z ∼ 2 is known to be the ’prime time’ for SMGs (Chapman et al. 2005), and that this is similar to what is observed in the local Universe (e.g. the percentual contribution of starburst is very small, Sanders & Mirabel, 1996). Still, going through this merging-driven starburst phase may be a critical phase for the transformation of star-forming galaxies into passive ellipticals. Hence, we maintain that off-sequence galaxies are likely to be crucial objects for our under-standing galaxy formation and evolution.
GR acknowledges support from ASI (Herschel Sci-ence Contract I/005/07/0). ED acknowledges fund-ing support from ERC-StG grant UPGAL 240039 and
ANR-08-JCJC-0008. PACS has been developed by a consortium of institutes led by MPE (Germany) and including UVIE (Austria); KU Leuven, CSL, IMEC (Belgium); CEA, LAM (France); MPIA (Germany); INAF- IFSI/OAA/OAP/OAT, LENS, SISSA (Italy); IAC (Spain). This development has been supported by the funding agencies BMVIT (Austria), ESA-PRODEX (Belgium), CEA/CNES (France), DLR (Germany),
ASI/INAF (Italy), and CICYT/MCYT (Spain). We
thank the anonymous referee for a constructive report.
REFERENCES Berta, S., et al. 2011, arXiv:1106.3070 Bournaud, F., et al. 2011, ApJ, 730, 4
Brinchmann, J., Charlot, S., White, S. D. M., Tremonti, C., Kauffmann, G., Heckman, T., & Brinkmann, J. 2004, MNRAS, 351, 1151
Chapman, S. C., Blain, A. W., Smail, I., & Ivison, R. J. 2005, ApJ, 622, 772
Chary, R., & Elbaz, D. 2001, ApJ, 556, 562
Daddi, E., Cimatti, A., Renzini, A., Fontana, A., Mignoli, M., Pozzetti, L., Tozzi, P., & Zamorani, G. 2004, ApJ, 617, 746 Daddi, E., et al. 2005, ApJ, 631, L13
Daddi, E., et al. 2007, ApJ, 670, 156
Daddi, E., Dannerbauer, H., Elbaz, D., Dickinson, M., Morrison, G., Stern, D., & Ravindranath, S. 2008, ApJ, 673, L21 Daddi, E., et al. 2009, ApJ, 694, 1517
Daddi, E., et al. 2010, ApJ, 713, 686 Daddi, E., et al. 2010, ApJ, 714, L118
Di Matteo, P., Bournaud, F., Martig, M., Combes, F., Melchior, A.-L., & Semelin, B. 2008, A&A, 492, 31
Elbaz, D., et al. 2007, A&A, 468, 33 Elbaz, D., et al. 2011, arXiv:1105.2537 Elvis, M., et al. 2009, ApJS, 184, 158
Feruglio, C., Daddi, E., Fiore, F., Alexander, D. M., Piconcelli, E., & Malacaria, C. 2011, ApJ, 729, L4
Fritz, J., Franceschini, A., & Hatziminaoglou, E. 2006, MNRAS, 366, 767
Geach, J. E., Smail, I., Moran, S. M., MacArthur, L. A., Lagos, C. d. P., & Edge, A. C. 2011, ApJ, 730, L19
Genzel, R., et al. 2010, MNRAS, 407, 2091
Goldader, J. D., Meurer, G., Heckman, T. M., Seibert, M., Sanders, D. B., Calzetti, D., & Steidel, C. C. 2002, ApJ, 568, 651
Gonz´alez, V., Labb´e, I., Bouwens, R. J., Illingworth, G., Franx,
M., Kriek, M., & Brammer, G. B. 2010, ApJ, 713, 115 Gruppioni, C., et al. 2010, A&A, 518, L27
Ilbert, O., et al. 2010, ApJ, 709, 644 Karim, A., et al. 2011, ApJ, 730, 61
Koekemoer, A. M., et al. 2007, ApJS, 172, 196 Lutz, D., et al. 2011, arXiv:1106.3285
Martig, M., & Bournaud, F. 2010, ApJ, 714, L275 McCracken, H. J., et al. 2010, ApJ, 708, 202 Mihos, J. C., & Hernquist, L. 1996, ApJ, 464, 641 Noeske, K. G., et al. 2007, ApJ, 660, L43 Nordon, R., et al. 2010, A&A, 518, L24 Pannella, M., et al. 2009, ApJ, 698, L116 Peng, Y., et al. 2010, ApJ, 721, 193
Peng, Y., Lilly, S. J., Renzini, A., & Carollo, M. 2011, arXiv:1106.2546
Pilbratt, G. L., et al. 2010, A&A, 518, L1 Poglitsch, A., et al. 2010, A&A, 518, L2 Polletta, M., et al. 2007, ApJ, 663, 81 Renzini, A. 2009, MNRAS, 398, L58 Rodighiero, G., et al. 2010, A&A, 518, L25 Rodighiero, G., et al. 2010, A&A, 515, A8 Salim, S., et al. 2007, ApJS, 173, 267
Sanders, D. B., Soifer, B. T., Elias, J. H., Madore, B. F., Matthews, K., Neugebauer, G., & Scoville, N. Z. 1988, ApJ, 325, 74
Sanders, D. B., & Mirabel, I. F. 1996, ARA&A, 34, 749 Scott, K. S., et al. 2008, MNRAS, 385, 2225
Scoville, N., et al. 2007, ApJS, 172, 1 Tacconi, L. J., et al. 2008, ApJ, 680, 246 Tacconi, L. J., et al. 2010, Nature, 463, 781
Takagi, T., Ono, Y., Shimasaku, K., & Hanami, H. 2008, MNRAS, 389, 775
Wuyts, S., et al. 2011, ApJ in press, arXiv:1106.5502 Wuyts, S., et al. 2011, submitted to ApJ, arXiv:1107.0317
Figure 5. Spectrophotometric properties of 9 out of 28 representative sources lying a factor 10 above the MS. We performed a simultaneous three components SED fitting analysis including stellar (blue), dusty torus (green) and starburst (red) emissions. The sum of the three components is also reported (black). A cutout of the ACS i band (5” × 5”) is reported.