HAL Id: hal-01789187
https://hal.archives-ouvertes.fr/hal-01789187
Submitted on 9 May 2018
HAL is a multi-disciplinary open access
archive for the deposit and dissemination of
sci-entific research documents, whether they are
pub-lished or not. The documents may come from
teaching and research institutions in France or
abroad, or from public or private research centers.
L’archive ouverte pluridisciplinaire HAL, est
destinée au dépôt et à la diffusion de documents
scientifiques de niveau recherche, publiés ou non,
émanant des établissements d’enseignement et de
recherche français ou étrangers, des laboratoires
publics ou privés.
ISM PROPERTIES OF A MASSIVE DUSTY
STAR-FORMING GALAXY DISCOVERED AT Z
∼ 7
M. L. Strandet, A. Weiß, C. de Breuck, D. P. Marrone, J. D. Vieira, M.
Aravena, M. L. N. Ashby, M. Bethermin, M. S. Bothwell, C. M. Bradford, et
al.
To cite this version:
M. L. Strandet, A. Weiß, C. de Breuck, D. P. Marrone, J. D. Vieira, et al.. ISM PROPERTIES OF
A MASSIVE DUSTY STAR-FORMING GALAXY DISCOVERED AT Z
∼ 7. The Astrophysical
ISM PROPERTIES OF A MASSIVE DUSTY STAR-FORMING GALAXY DISCOVERED AT Z ∼ 7
M. L. Strandet1,2, A. Weiß1, C. De Breuck3, D. P. Marrone4, J. D. Vieira5,6, M. Aravena7, M. L. N. Ashby8,
M. B´ethermin9, M. S. Bothwell10,11, C. M. Bradford12, J. E. Carlstrom13,14,15,16, S. C. Chapman17,
D. J. M. Cunningham17, 18, Chian-Chou Chen3, C. D. Fassnacht19, A. H. Gonzalez20, T. R. Greve21,
B. Gullberg22, C. C. Hayward8,23, Y. Hezaveh24,25, K. Litke4, J. Ma20, M. Malkan26, K. M. Menten1, T. Miller17,
E. J. Murphy27, D. Narayanan20, K. A. Phadke5, K. M. Rotermund17, J. S. Spilker4, J. Sreevani5
1
Max-Planck-Institut f¨ur Radioastronomie, Auf dem H¨ugel 69 D-53121 Bonn, Germany
2Member of the International Max Planck Research School (IMPRS) for Astronomy and Astrophysics at the Universities of Bonn and Cologne
3European Southern Observatory, Karl Schwarzschild Straße 2, 85748 Garching, Germany 4Steward Observatory, University of Arizona, 933 North Cherry Avenue, Tucson, AZ 85721, USA 5
Department of Astronomy, University of Illinois, 1002 West Green St., Urbana, IL 61801 6Department of Physics, University of Illinois, 1002 West Green St., Urbana, IL 61801 7
N´ucleo de Astronom´ıa, Facultad de Ingenier´ıa y Ciencias, Universidad Diego Portales, Av. Ej´ercito 441, Santiago, Chile 8Harvard-Smithsonian Center for Astrophysics, 60 Garden Street, Cambridge, MA 02138, USA
9Aix Marseille Univ, CNRS, LAM, Laboratoire d’Astrophysique de Marseille, Marseille, France 10Cavendish Laboratory, University of Cambridge, 19 J.J. Thomson Avenue, Cambridge, CB3 0HE, UK 11Kavli Institute for Cosmology, University of Cambridge, Madingley Road, Cambridge CB3 0HA, UK 12
Jet Propulsion Laboratory, 4800 Oak Grove Drive, Pasadena, CA 91109, USA
13Kavli Institute for Cosmological Physics, University of Chicago, 5640 South Ellis Avenue, Chicago, IL 60637, USA 14
Department of Physics, University of Chicago, 5640 South Ellis Avenue, Chicago, IL 60637, USA 15Enrico Fermi Institute, University of Chicago, 5640 South Ellis Avenue, Chicago, IL 60637, USA
16Department of Astronomy and Astrophysics, University of Chicago, 5640 South Ellis Avenue, Chicago, IL 60637, USA 17
Dalhousie University, Halifax, Nova Scotia, Canada
18Department of Astronomy and Physics, Saint Mary’s University, Halifax, Nova Scotia, Canada 19
Department of Physics, University of California, One Shields Avenue, Davis, CA 95616, USA
20Department of Astronomy, University of Florida, Bryant Space Sciences Center, Gainesville, FL 32611 USA 21
Department of Physics and Astronomy, University College London, Gower Street, London WC1E 6BT, UK
22Centre for Extragalactic Astronomy, Department of Physics, Durham University, South Road, Durham DH1 3LE, UK 23Center for Computational Astrophysics, Flatiron Institute, 162 Fifth Avenue, New York, NY 10010, USA
24
Kavli Institute for Particle Astrophysics and Cosmology, Stanford University, Stanford, CA 94305, USA 25Hubble Fellow
26
Department of Physics and Astronomy, University of California, Los Angeles, CA 90095-1547, USA 27National Radio Astronomy Observatory, 520 Edgemont Road, Charlottesville, VA 22903, USA
ABSTRACT
We report the discovery and constrain the physical conditions of the interstellar medium of the highest-redshift millimeter-selected dusty star-forming galaxy (DSFG) to date, SPT-S J031132−5823.4 (here-after SPT0311−58), at z = 6.900 ± 0.002. SPT0311−58 was discovered via its 1.4 mm thermal dust continuum emission in the South Pole Telescope (SPT)-SZ survey. The spectroscopic redshift was determined through an ALMA 3 mm frequency scan that detected CO(6–5), CO(7–6) and [CI](2–1),
and subsequently confirmed by detections of CO(3–2) with ATCA and [CII] with APEX. We constrain
the properties of the ISM in SPT0311−58 with a radiative transfer analysis of the dust continuum photometry and the CO and [CI] line emission. This allows us to determine the gas content without ad
hoc assumptions about gas mass scaling factors. SPT0311−58 is extremely massive, with an intrinsic gas mass of Mgas= 3.3 ± 1.9 × 10¹¹M . Its large mass and intense star formation is very rare for a
source well into the Epoch of Reionization.
2
Keywords: galaxies: high-redshift — galaxies: star formation — early universe
1. INTRODUCTION
Searches for the most distant galaxies have now reached as far back as the first billion years in the history of the Universe, and are peeking into the epoch of reion-ization (EoR) at 6 < z < 11 (Planck Collaboration et al. 2016). Some of the most important questions in obser-vational cosmology concern the time scale over which the reionization of the Universe took place, the identifi-cation of the objects providing the ionizing photons and the enrichment of galaxies with metals. It is expected that star-forming galaxies play a major role in the reion-ization, so to understand the evolution of the Universe from its neutral beginning to its present ionized state we must study the galaxies in the EoR (see reviews by
Stark 2016; Bouwens 2016). How galaxies formed and evolved in the EoR is unknown. Galaxies in this era are currently being found from rest-frame ultraviolet (UV) surveys (e.g.Ouchi et al. 2010). Most of these systems, however, are low-mass star-forming galaxies for which the enrichment of the cold ISM is difficult to study even in long integrations with the Atacama Large Millime-ter/submillimeter Array (ALMA) (Bouwens et al. 2016, b).
Massive dusty star-forming galaxies (DSFGs) (Casey et al. 2014) are not expected to be found into the EoR because it is difficult to produce their large dust masses within a few hundred Myr of the Big Bang (Ferrara 2010;
Mattsson 2015). Recent wide-area Herschel and optical QSO surveys, however, have revealed dusty galaxies out to z ∼ 6 − 7 (e.g.,Venemans et al. 2012;Riechers et al. 2013). These systems offer the unique opportunity to study extreme cases of metal/dust enrichment of the ISM within the EoR in the most massive over-densities at these redshifts.
Here we present the DSFG SPT-S J031132−5823.4 (hereafter SPT0311−58) discovered in the South Pole Telescope (SPT)-SZ survey (Carlstrom et al. 2011;
Vieira et al. 2013). SPT0311−58 is the highest redshift millimeter-selected DSFG known to-date, located well into the EoR at a redshift of z = 6.900 ± 0.002. With this source, we take a step of almost 100 Myr closer to the Big Bang than the previously most distant DSFG at z = 6.34 found by Riechers et al. (2013), bringing us ∼760 Myr away from Big Bang. Throughout the pa-per, we assume a ΛCDM cosmology with H0=70 km s−1
Mpc−1, Ω
Λ= 0.7 and ΩM= 0.3.
2. OBSERVATIONAL RESULTS
2.1. Determining the redshift
The redshift search for SPT0311-58 was performed in ALMA band 3 by combining five tunings covering 84.2 – 114.9 GHz (project ID: 2015.1.00504.S; seeWeiß et al. 2013;Strandet et al. 2016, for further details on the ob-serving setup). The observations were carried out on 2015 December 28 and 2016 January 2 in the Cycle 3 compact array configuration. The number of antennas varied from 34 to 41, with baselines up to 300 m yield-ing a synthesized beam size of 2.002−3.000. Typical system
temperatures for the observations were Tsys= 50 – 80 K
(SSB). Flux calibration was done with Uranus, band-pass calibration with J0334−4008, and phase calibra-tion with J0303−6211 and J0309−6058. The on-source time varied between 60 seconds and 91 seconds per tun-ing, accounting for a total of 6 minutes and 10 seconds. The data were processed using the Common Astronomy Software Application package (CASA, McMullin et al. 2007).
We created a cleaned 3 mm continuum image combin-ing all 5 tuncombin-ings. This yields a high signal to noise ratio (SNR) detection of ∼35. We also generated a spectral cube using natural weighting with a channel width of 19.5 MHz (50 – 65 kms−1 for the highest and lowest
ob-serving frequency, respectively), which gives a typical noise per channel of 0.9 –1.7 mJy beam−1.
The ALMA 3 mm spectrum of SPT0311−58 was ex-tracted at the centroid of the 3 mm continuum emis-sion (α: 03h11m33.s142 δ: −58◦23033.0037 (J2000)) and is
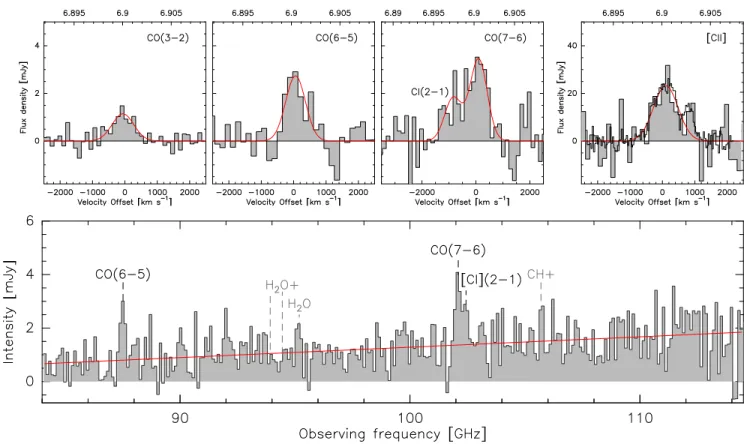
shown in Figure1. We detect emission in the CO J = 6 – 5 and 7 – 6 lines and the [CI]3P2−3P1 line (in the
following 2 − 1) and their noise-weighted line frequen-cies yield a redshift of z = 6.900 ± 0.002. We also see hints of H2O(211 – 202) and CH+(1–0), but these are
not formally detected in this short integration.
The line and continuum properties are given in Table
1. For the fit to the CO(7–6) and [CI](2–1) lines we fix
the line width to the mean value derived from the un-blended lines. Their uncertainties include the variations of the line intensities for a fit where the line width is a free parameter.
2.2. Observations of CO(3–2) and [CII]
We used the 7 mm receivers of the Australia Telescope Compact Array (ATCA) to observe the CO(3–2) line (project ID: CX352). Observations were carried out with the hybrid H214 array, which yields a beam size of 5-600 at the observing frequency of 43.77 GHz. The
line is detected with a SNR of 5.0 at a frequency and line width consistent with the ALMA derived redshift and line profiles.
Exper-Figure 1. The lower part of the figure shows the ALMA 3 mm spectrum of SPT0311−58 spanning 84.2 – 114.9 GHz. The spectrum has been binned to best show the lines. Transitions labeled in black are detected and grey labels indicate where other transitions should be. The red line indicate the zeroth order baseline. The sub-panels above the spectrum show, from left to
right, the continuum-subtracted spectra of: ATCA CO(3–2), ALMA CO(6–5), ALMA CO(7–6) and CI(2–1), and APEX [CII]
with ALMA [CII] overlaid as a solid black histogram. Gaussian fits to the spectra are shown in red.
iment (APEX) to observe [CII] at 240.57 GHz. The
observations were carried out in 2016 April–May in good weather conditions with a precipitable water va-por content <1.5 mm (project IDs E-296.A-5041B-2016 and M-097.F-0019-2016). The observations were per-formed and the data processed as described byGullberg et al. (2015). The [CII] line is detected with a SNR of
4.3. From ALMA high spatial resolution observations of the [CII] line (Marrone et al. in prep.; project ID:
2016.1.01293.S), we extract a [CII] spectrum and flux,
which are in good agreement with the APEX data. We adopt the ALMA [CII] flux hereafter.
The line parameters derived from Gaussian fits to the data are given for both transitions in Table1; the spec-tra are shown in Figure1.
2.3. FIR dust continuum
Table 1 (right) summarizes the dust continuum
observations of SPT0311−58. With seven
broad-band continuum detections between 3 mm to 250 µm, the far-infrared spectral energy distribution (SED) of SPT0311−58 is thoroughly covered.
The SPT 1.4 and 2.0 mm flux densities were extracted and deboosted as described by Mocanu et al. (2013). We obtained a 870 µm map with APEX/LABOCA
(project ID: M-091.F-0031-2013). The data were ob-tained, reduced, and the flux extracted followingGreve et al. (2012). Using Herschel/SPIRE, we obtained maps at 250 µm, 350 µm and 500 µm (project ID: DDT mstrande 1). The data were obtained and reduced as described byStrandet et al.(2016).
From our photometry, we derive an apparent far-infrared (FIR) luminosity (integrated between 40– 120 µm rest) of LFIR= 4.1 ± 0.7 × 10¹³L (see Figure
2).
3. CHARACTERIZING THE ISM IN SPT0311−58
3.1. Source properties from high resolution imaging ALMA high spatial resolution imaging (angular res-olution of 0.3 × 0.500) of the [CII] line in SPT0311−58
shows that the system consists of two galaxies in close proximity (Marrone et al. in prep.). Only the western source is significantly gravitationally magnified and this source dominates the apparent continuum luminosity (> 90% of the restframe 160 µm continuum flux den-sity is emitted by the western source). In the following, we assume that the contribution from the eastern source is negligible and model the system as a single object, us-ing the system magnification of µ = 1.9 (Marrone et al. in prep.).
4
Table 1. Observed properties of SPT0311-58
Line properties Continuum properties
Transition R SdV dVa L0 L Wavelength Sν [Jy km/s] [km/s] ×1011[K km/s/pc2] ×108[L ] [µm] [mJy] CO(3–2) 0.96 ± 0.15 790 ± 150 1.52 ± 0.24 2.01 ± 0.32 3000 1.30 ± 0.05 CO(6–5) 2.10 ± 0.33 720 ± 140 0.83 ± 0.13 8.8 ± 1.4 2000 7.5 ± 1.3 CO(7–6) 2.78 ± 0.80 750b 0.81 ± 0.11 13.6 ± 1.8 1400 19.0 ± 4.2 [CI](2–1) 1.29 ± 0.80 750b 0.37 ± 0.10 6.4 ± 1.8 870 32.0 ± 5.0 [CII]APEX 22.1 ± 5.1 890 ± 260 1.16 ± 0.27 254 ± 59 500 52.0 ± 8.0 [CII]ALMA 25.88 ± 0.65 1.36 ± 0.03 298.1 ± 7.5 350 38.0 ± 6.0 250 29.0 ± 8.0
aFWHMbfixed from CO(3–2) and CO(6–5).
Figure 2. Results of simultaneous fitting of the CO SLED (left ), SED (middle) and [CI] (right ) line flux. The CO line intensities
are plotted as filled circles, the continuum fluxes as open circles and the [CI]flux as an asterisk. The blue dashed line and squares
show the cold component, the red dotted line and triangles show the warm component, the black solid line and circles (in right panel) show the combination of the two components. In grey is shown similar data for HFLS3 (dots and dotted line) and Arp220 (crosses and solid line), normalized to the CO(6–5) flux of SPT0311-58 for the CO-SLED and to the peak of the continuum
SED of SPT0311-58 for the SED. The line fluxes and continuum properties fitted are listed in Table2. Left : Two component
CO-SLED. Middle: Two component SED fitting based. Right : The contribution of each of the two components to the [CI](2–1)
line and predictions for the [CI](1–0) line.
3.2. Radiative Transfer Models
We use the FIR photometry and the line luminosities from Table 1 to simultaneously model the dust contin-uum, CO spectral line energy distribution (SLED), and the [CI](2–1) line following the radiative transfer
calcu-lation presented inWeiß et al.(2007). In this model, the background radiation field is set to the cosmic microwave background (CMB) for the dust and to the CMB plus the dust radiation field for the lines. The line and dust continuum emission are further linked via the gas col-umn density in each component that introduces the tur-bulence line width as a free parameter in the calculation (see Eq. 7 inWeiß et al. 2007). The gas column density calculated from the line emission together with the gas to dust mass ratio (GDMR) then determines the optical
depth of the dust.
The calculations treat the dust and the kinetic tem-perature as independent parameters, but with the prior that the kinetic gas temperature has to be equal to or higher than the dust temperature. Physically, this al-lows for additional sources of mechanical energy (e.g. shocks) in the ISM in addition to photo-electric heat-ing.
The chemical parameters in our model are the CO and [CI] abundances relative to H2 and the GDMR.
We use a fixed CO abundance of 8 × 10⁻⁵ relative
to H2 (Frerking et al. 1982), but keep the [CI]
abun-dance and the GDMR as free parameters. For the fre-quency dependence of the dust absorption coefficient we adopt κd(ν) = 0.04 (ν/250 GHz)β [m2kg−1] (Kr¨ugel &
Siebenmorgen 1994), which is in good agreement with κ870µm= 0.077 m2kg−1 used in other work (seeSpilker
et al. 2015, and references therein), for our best-fitting β.
Model solutions are calculated employing a Monte-Carlo Bees (Pham & Castellani 2009) algorithm which randomly samples the parameter space and gives finer sampling for good solutions (as evaluated from a χ2
analysis for each model). In total, we sample ∼ 107
mod-els. Parameter values and uncertainties were calculated using the probability-weighted mean of all solutions and the standard deviations.
3.3. Model results
Figure 2 shows the CO SLED, the continuum SED, and [CI] flux density. From the figure, it is apparent
that the dust continuum SED cannot be modeled with a single temperature modified blackbody, so we instead fit two components. Since we have no information on the high-J CO transition, we use the shape of the CO SLED of Arp220 (Rosenberg et al. 2015) and HFLS3 (Riechers et al. 2013) as priors. With this choice, we compare the moderately excited CO SLED of Arp220 (seeRosenberg et al.(2015) for a comparison of Arp220 to other local ULIRGs) to the more extreme case of HFLS3 where the CO SLED stays high up to the Jup=9 level (see Fig. 2).
The use of the priors mainly affects the parameters of the warm gas and therefore only has a small effect on our derived gas mass (see below). Table2lists the parame-ters obtained from the radiative transfer calculations for the Arp220 prior, not corrected for magnification.
For both priors, the warm dust component dominates the peak of the CO SLED and the short wavelength part of the dust spectrum and therefore the FIR luminosity. Its size is small compared to the cold gas with an area ratio of ∼ 6 (r0= 1.7±1.4 kpc where r0is the equivalent
radius defined as r0= DApΩs/π(Weiß et al. 2007)) for
HFLS3 and slightly smaller for Arp220) which implies that the region of intense FIR continuum emission is sig-nificantly smaller than the overall gas distribution. Due to a lack of observations of CO transitions beyond (7–6), its properties are mainly driven by the assumed shape of the CO SLED for the high-J transitions. But the models for both priors indicated consistently that the warm gas has a substantial density (of order 105cm−3),
a dust temperature of ∼ 100 K and a kinetic tempera-ture in excess (but consistent within the errors) of the dust temperature (Tkin=180 ± 50 K when using Arp220
priors).
The cold dust component is required to fit the CO(3– 2) and [CI] line emission, and the long wavelength part
of the dust SED. Due to its large extent and relatively high density (r0=3.7 ± 1.3 kpc, log(n(H2)=3.7 ± 0.4)), it
carries ≈ 90% of the gas mass. The abundance of neutral
carbon in this gas phase is [CI]/[H2] = 6.0 ± 1.4 × 10
in agreement with other estimates at high redshift and in nearby galaxies (e.g.Weiß et al. 2005, and references therein). For both priors, the cold gas dominates the CO(1–0) line luminosity. As for the warm gas, we find that the kinetic temperature is above the dust tempera-ture (Tdust=36 ± 7 K, Tkin=58 ± 23 K), which may
sug-gest that the ISM in SPT0311-58 experiences additional mechanical energy input e.g., via feedback from stellar winds or AGN driven outflows. This is also supported by the large turbulent line width of order 100 km s−1
and super-virial velocity gradients (κvir >1, see note b
in Table2) we find for both components and priors. We use the kinematic parameters (dvturb and κvir)
together with the source size and the H2density for each
component (see Eq. 8 in Weiß et al. 2007) to derive a total apparent gas mass of Mgas=(6.3 ± 3.7) × 1011M
(including a 36% correction to account for the cosmic He abundance). For the HFLS3 prior, the gas mass is ∼ 30% higher.
4. DISCUSSION
4.1. Gas mass conversion factor
With the independent gas mass estimate from the radiative transfer models in-hand we can also derive the gas-to-dust mass ratio (GDMR) and the CO-to-H2 conversion factor (αCO) for SPT0311−58. Since
the CO(1–0) transition has not been observed, we use the flux density from the radiative transfer model which predicts ICO(1−0)=0.10 ± 0.03 Jy km/s. In our
models, we assume that each gas component has the same GDMR and we find GDMR=110 ± 15. Due to the different physical conditions in each gas compo-nent, there is a specific αCO value for each
compo-nent. For the cold dust component, we find αCO =
5.5 ± 4.0 M (K km s−1pc2)−1 and for the warm dust
component αCO= 3.1 ± 2.5 M (K km s−1pc2)−1.
Com-bining both gas components we find for SPT0311−58 αCO= 4.8 ± 2.9 M (K km s−1pc2)−1.
When calculating gas masses for ULIRGs, a factor of αCO= 0.8 M (K km s−1pc2)−1 is typically assumed
(Downes & Solomon 1998), significantly below our es-timate. The difference can easily be explained by the much higher densities we find in both components com-pared to the models fromDownes & Solomon(1998) in which most of the CO(1–0) luminosity arise from a dif-fuse inter-cloud medium. Since the bulk of the gas mass of this source is in the dense component, it is vital to include the higher-J CO transitions in the calculation of αCO.
A similar two-component analysis was done for the broad absorption line quasar APM08279+5255 at z = 3.9 (Weiß et al. 2007), where the dense component was
6
Table 2. ISM parameters of SPT0311-58 from the radiative transfer calculation
Parameter unit overall cold component warm component Equivalent radiusa pc (4000 ± 1700) µ−1/2 (3700 ± 1300) µ−1/2 (1500 ± 1200) µ−1/2 Tdust K 36 ± 7 115 ± 54 Tkin K 58 ± 23 180 ± 51 log(n(H2)) cm−3 3.7 ± 0.4 5.1 ± 1.9 dvturb km s−1 130 ± 17 100 ± 4 κvirb 1.9 ± 1.9 3.1 ± 2.5 GDMR 110 ± 15d β 1.91 ± 0.05d [CI]/[H2] (6.0 ± 1.4)×10−5 (1.7 ± 2.3)×10−5 Mdust M (5.7 ± 0.8)×109µ−1 (5.2 ± 0.7)×109µ−1 (4.8 ± 0.7)×108µ−1 Mgas M (6.3 ± 3.7)×1011µ−1 (5.7 ± 3.8)×1011µ−1 (5.3 ± 3.8)×1010µ−1 αCO M /K km s−1pc2 4.8 ± 2.9 5.5 ± 4.0 3.1 ± 2.5 LFIR L (4.1 ± 0.7) ×1013µ−1 (1.2 ± 1.1) × 1013µ−1 (2.9 ± 0.7) × 1013µ−1 SFRc M yr−1 (4100 ± 700) µ−1 tdep Myr 150 ± 90
Note—The values here are apparent values. Intrinsic values can be calculated using µ = 1.9.
ar
0= DApΩs/π bdv/dr=κ
vir× 3.1pn(H2)/1e4; we calculate the velocity gradient for virialized clouds (κvir= 1,Goldsmith 2001) but also consider
nonvirial, unbound motions (κvir> 1,Greve et al. 2009). cusing SFR=10−10× L
FIRbased on a Chabrier initial mass function (Kennicutt 1998;Chabrier 2003) dFitted in the radiative transfer calculation but set to be the same for both components.
found to dominate the CO(1–0) line by 70%. They find a high conversion factor of αCO∼ 6 M (K km s−1pc2)−1,
similar to what we find in the dense gas component. A similar reasoning for higher CO conversion factors ow-ing to the presence of dense gas was put forward by
Papadopoulos et al. (2012) based on the CO SLED in local (U)LIRGs.
4.2. [CII]
From our [CII] detection, we derive a L[CII]/LFIR
ra-tio of (7.3 ± 0.1)×10−4. Figure 3 shows that this puts
SPT0311−58 into the lower region of the L[CII]/LFIR
ratio observed in a larger sample of SPT-DSFGs ( Gull-berg et al. 2015). Similarly, low L[CII]/LFIR ratios are
found for the z = 6.3 star-forming galaxy HFLS3 ( Riech-ers et al. 2013) and for the z = 7.1 QSO host galaxy J1120+0641(Venemans et al. 2012).
The L[CII]/LCO(1–0)ratio in SPT0311−58 is similar to
what is observed in the SPT sample (4300 ± 1300 com-pared to 5200 ± 1800 Gullberg et al. 2015), and HFLS3 (∼3000, Riechers et al. 2013). This is consistent with the picture in which the [CII] emission stems from the
surface of dense clouds exposed to the strong UV field from the intense starburst in SPT0311−58 (Stacey et al. 2010;Gullberg et al. 2015;Spilker et al. 2016).
The larger [CII] deficit together with the decreasing
L[CII]/LCO(1–0) ratio of SPT0311−58 and other high
redshift sources compared to local galaxies may be
un-Figure 3. L[CII]/LFIR vs L[CII]/LCO(1–0) with PDR
mod-els and samples adapted from Gullberg et al. (2015). The
red star shows how SPT0311-58 falls within the larger SPT DSFG sample. The typical error bar for the low redshift sample is presented by the black cross.
derstood as a consequence of an increasing gas sur-face density (Narayanan & Krumholz 2017): the higher molecular gas surface density pushes the HI + H2mass
budget towards higher H2 fractions. Since [CII] mainly
arises from the PDR zone associated with HI and the
emitting region and therefore the [CII] line intensity. At
the same time, the ratio of L[CII]/LCO(1–0)will decrease
due to an increase in the fraction of carbon locked in CO compared to [CII].
4.3. Concluding remarks
Both our radiative transfer model and fine structure line results indicate that SPT0311-58 resembles typical DSFGs, just at z ∼ 7. This is also supported by its ex-treme SFR surface density of ΣSFR∼ 600 M yr−1kpc−2
(derived using the size of the warm gas component that dominates the FIR luminosity) which approaches the modeled values for radiation pressure limited starbursts (103M
yr−1kpc−2 Thompson et al. 2005) and is
com-parable to what is found in other starburst like Arp220, HFLS3 and other SPT-DSFGs (Scoville 2003;Riechers et al. 2013; Spilker et al. 2016). Future observations of this source will explore its spatial structure, physical conditions, formation history, and chemical evolution in great detail as it is one of very few massive galaxies known at z ∼ 7
MLS was supported for this research through a stipend from the International Max Planck Research School (IMPRS) for Astronomy and Astrophysics at the Universities of Bonn and Cologne. MA acknowl-edges partial support from FONDECYT through grant 1140099. JDV, DPM, KCL, JSS and SJ acknowledge support from the U.S. National Science Foundation un-der grant No. AST-1312950. BG acknowledges
sup-port from the ERC Advanced Investigator programme DUSTYGAL 321334. The Flatiron Institute is sup-ported by the Simons Foundation. Partial support for DN was provided by NSF AST-1009452, AST-1445357, NASA HST AR-13906.001 from the Space Telescope Sci-ence Institute, which is operated by the Association of University for Research in Astronomy, Incorporated, un-der NASA Contract NAS5-26555, and a Cottrell College Science Award, awarded by the Research Corporation for Science Advancement. ALMA is a partnership of ESO (representing its member states), NSF (USA) and NINS (Japan), together with NRC (Canada) and NSC and ASIAA (Taiwan), in cooperation with the Repub-lic of Chile. The Joint ALMA Observatory is operated by ESO, AUI/NRAO and NAOJ. The National Radio Astronomy Observatory is a facility of the National Sci-ence Foundation operated under cooperative agreement by Associated Universities, Inc. Herschel is a European Space Agency Cornerstone Mission with significant par-ticipation by NASA. APEX is a collaboration between the Max-Planck-Institut f¨ur Radioastronomie, the Eu-ropean Southern Observatory, and the Onsala Space Observatory. The Australia Telescope is funded by the Commonwealth of Australia for operation as a National Facility managed by CSIRO. The SPT is supported by the National Science Foundation through grant PLR-1248097, with partial support through PHY-1125897, the Kavli Foundation and the Gordon and Betty Moore Foundation grant GBMF 947.
REFERENCES
Bouwens, R. 2016, in Astrophysics and Space Science Library, Vol. 423, 111
Bouwens, R. J., Aravena, M., Decarli, R., et al. 2016, ApJ, 833, 72
Carlstrom, J. E., Ade, P. A. R., Aird, K. A., et al. 2011, PASP, 123, 568
Casey, C. M., Narayanan, D., & Cooray, A. 2014, PhR, 541, 45 Chabrier, G. 2003, ApJL, 586, L133
Downes, D., & Solomon, P. M. 1998, ApJ, 507, 615
Ferrara, A. 2010, in American Institute of Physics Conference Series, Vol. 1294, 148–157
Frerking, M. A., Langer, W. D., & Wilson, R. W. 1982, ApJ, 262, 590
Goldsmith, P. F. 2001, ApJ, 557, 736
Greve, T. R., Papadopoulos, P. P., Gao, Y., & Radford, S. J. E. 2009, ApJ, 692, 1432
Greve, T. R., Vieira, J. D., Weiß, A., et al. 2012, ApJ, 756, 101 Gullberg, B., De Breuck, C., Vieira, J. D., et al. 2015, MNRAS,
449, 2883
Kennicutt, Jr., R. C. 1998, ApJ, 498, 541
Kr¨ugel, E., & Siebenmorgen, R. 1994, A&A, 288, 929
Mattsson, L. 2015, ArXiv e-prints:1505.04758, arXiv:1505.04758 McMullin, J. P., Waters, B., Schiebel, D., Young, W., & Golap, K. 2007, in Astronomical Data Analysis Software and Systems XVI, Vol. 376, 127
Mocanu, L. M., Crawford, T. M., Vieira, J. D., et al. 2013, ApJ, 779, 61
Narayanan, D., & Krumholz, M. R. 2017, MNRAS, 467, 50 Ouchi, M., Shimasaku, K., Furusawa, H., et al. 2010, ApJ, 723,
869
Papadopoulos, P. P., van der Werf, P. P., Xilouris, E. M., et al. 2012, MNRAS, 426, 2601
Pham, D. T., & Castellani, M. 2009, Proceedings of the Institution of Mechanical Engineers, Part C: Journal of Mechanical Engineering Science, 223, 12
Planck Collaboration, Ade, P. A. R., Aghanim, N., et al. 2016, A&A, 594, A13
Riechers, D. A., Bradford, C. M., Clements, D. L., et al. 2013, Nature, 496, 329
Rosenberg, M. J. F., van der Werf, P. P., Aalto, S., et al. 2015, ApJ, 801, 72
Scoville, N. 2003, Journal of Korean Astronomical Society, 36, 167
Spilker, J. S., Aravena, M., Marrone, D. P., et al. 2015, ApJ, 811, 124
Spilker, J. S., Marrone, D. P., Aravena, M., et al. 2016, ApJ, 826, 112
Stacey, G. J., Hailey-Dunsheath, S., Ferkinhoff, C. an d Nikola, T., et al. 2010, ApJ, 724, 957
8
Strandet, M. L., Weiss, A., Vieira, J. D., et al. 2016, ApJ, 822, 80 Thompson, T. A., Quataert, E., & Murray, N. 2005, ApJ, 630,
167
Venemans, B. P., McMahon, R. G., Walter, F., et al. 2012, ApJL, 751, L25
Vieira, J. D., Marrone, D. P., Chapman, S. C., et al. 2013, Nature, 495, 344
Weiß, A., Downes, D., Henkel, C., & Walter, F. 2005, A&A, 429, L25
Weiß, A., Downes, D., Neri, R., et al. 2007, A&A, 467, 955 Weiß, A., De Breuck, C., Marrone, D. P., et al. 2013, ApJ, 767,
![Figure 2 . Results of simultaneous fitting of the CO SLED (left), SED (middle) and [C I ] (right) line flux](https://thumb-eu.123doks.com/thumbv2/123doknet/14792475.602011/5.918.92.833.429.669/figure-results-simultaneous-fitting-sled-left-middle-right.webp)

