HAL Id: hal-00299312
https://hal.archives-ouvertes.fr/hal-00299312
Submitted on 7 Nov 2005
HAL is a multi-disciplinary open access
archive for the deposit and dissemination of
sci-entific research documents, whether they are
pub-lished or not. The documents may come from
teaching and research institutions in France or
abroad, or from public or private research centers.
L’archive ouverte pluridisciplinaire HAL, est
destinée au dépôt et à la diffusion de documents
scientifiques de niveau recherche, publiés ou non,
émanant des établissements d’enseignement et de
recherche français ou étrangers, des laboratoires
publics ou privés.
comparison and evaluation
A. Brenning
To cite this version:
A. Brenning. Spatial prediction models for landslide hazards: review, comparison and evaluation.
Natural Hazards and Earth System Science, Copernicus Publications on behalf of the European
Geo-sciences Union, 2005, 5 (6), pp.853-862. �hal-00299312�
Natural Hazards and Earth System Sciences, 5, 853–862, 2005 SRef-ID: 1684-9981/nhess/2005-5-853
European Geosciences Union
© 2005 Author(s). This work is licensed under a Creative Commons License.
Natural Hazards
and Earth
System Sciences
Spatial prediction models for landslide hazards: review, comparison
and evaluation
A. Brenning
Institute of Medical Informatics, Biometry and Epidemiology, University of Erlangen-N¨urnberg, Erlangen, Germany Received: 18 July 2005 – Revised: 15 September 2005 – Accepted: 28 October 2005 – Published: 7 November 2005 Part of Special Issue “Spatial prediction modeling in natural hazards and risk”
Abstract. The predictive power of logistic regression,
sup-port vector machines and bootstrap-aggregated classification trees (bagging, double-bagging) is compared using misclas-sification error rates on independent test data sets. Based on a resampling approach that takes into account spatial auto-correlation, error rates for predicting “present” and “future” landslides are estimated within and outside the training area. In a case study from the Ecuadorian Andes, logistic regres-sion with stepwise backward variable selection yields lowest error rates and demonstrates the best generalization capabil-ities. The evaluation outside the training area reveals that tree-based methods tend to overfit the data.
1 Introduction
The spatial prediction of landslide hazards is one important field of geoscientific research in which statistical classifica-tion rules have been applied. The aim of these methods is to identify areas that are susceptible to future landsliding, based on the knowledge of past landslide events and terrain param-eters, geological attributes and other, possibly anthropogenic environmental conditions that are associated with the pres-ence or abspres-ence of such phenomena.
The primary objective of modelling landslide hazards is the prediction of landslide-prone areas in space and/or time. This contrasts with other areas of geomorphological research, where similar classification problems occur, but where the analysis of observed distribution patterns as re-lated to environmental conditions is of primary interest. For instance, Brenning (2005) applied logistic regression analy-sis to determine factors influencing the spatial distribution of rock glaciers. Based on this analysis, he characterized the geomorphological niche of rock glaciers as related to topog-raphy (size of the contributing area, horizontal curvature) and climate (temperature, solar radiation).
Correspondence to: A. Brenning
The question whether the analysis or prediction is the main goal influences the choice of methods and error measures to be studied. In the present work, the focus is on predic-tion. Predictors of landslide hazard distribution are fitted or “trained” on a training data set of observed landslide dis-tribution and thematic data such as morphometric attributes (slope, aspect etc.) and information on land use (deforesta-tion, proximity to road, and other variables). In this predic-tive context, the misclassification rate as measured on test data sets is the primary quantitative measure for evaluating the predictive power of a classification rule.
The objective of the present work is to review the present practice of applied spatial landslide hazard modelling as re-flected by the scientific literature, and to compare selected statistical classification rules in a case study. Evaluation tech-niques are introduced that take into account the spatial struc-ture of the prediction problem and control spatial overfitting. Two scenarios for the preparation of susceptibility maps are distinguished: First, if multi-temporal landslide invento-ries are available, successions of landslide distribution pat-terns and land use may be used to predict future events. Specifically, and along the lines of time series analysis, a classifier is trained to predict landslide distribution at time point t1given environmental data from time points t0and t1, and landslide distribution at time point t0as explanatory vari-ables. Multi-temporal information is particularly important since future landslide hazards partly depend on the scarps of past events (Casadei et al., 2003) and should therefore be modelled conditional on these. This will be done in the case study, which is based on data from Stoyan (2000).
On the other hand, often multi-temporal inventories or pre-cise knowledge on landslide age are lacking, and only the current distributional pattern can be used to identify sus-ceptible areas (Atkinson and Massari, 1998; Ohlmacher and Davis, 2003).
Regarding the evaluation of predictive landslide mod-elling techniques, this work proposes to adapt the cross-validation technique (Efron and Gong, 1983; Efron and Tib-shirani, 1986) to estimate misclassification errors of spatial
and spatio-temporal prediction problems. Cross-validation is a computationally-intensive estimation technique that is based on subsequently partitioning a data set into subsets for training and testing the classifier. It is important that the test data is independent of the training data; an appropriate re-sampling scheme will therefore be proposed.
2 Basic concepts and techniques
2.1 Classifiers
A classifier is a mathematical mapping that assigns an object to a class based on known covariates describing the object. It is fitted to or trained on a given training data set. This data set consists of objects (here: grid points) with known class membership (here: landslide or non-landslide) and a set of also known covariates representing possibly relevant envi-ronmental conditions such as morphometry (slope, curvature, distance to ridge and others), land use and land cover (veg-etation, infrastructure). Given a set of objects with known covariates, the classifier may be used to predict the (most likely) class membership. In some instances, it is desirable to predict the probability of class membership instead of the class membership itself.
A great variety of classification methods has been devel-oped by researchers in the fields of statistics and machine learning (Hand, 1997). Common statistical approaches are logistic regression (Hosmer and Lemeshow, 2000) and dis-criminant analysis, both of which are based on linear com-binations of the explanatory variables. More recent de-velopments include support vector machines (SVM; Vap-nik, 2001), artificial neural networks (ANN), and bootstrap-aggregated classification trees (Breiman, 1996; Hothorn and Lausen, 2003). Logistic regression, SVM and bootstrap-aggregated classification trees will be presented and applied later in this work (Sect. 5).
2.2 Error rates
The misclassification rate or error rate is one measure of model performance. It is defined as the total proportion of objects in a data set that is wrongly classified, i. e. of land-slide grid points being predicted as non-landland-slides (false neg-atives) and of non-landslide points being predicted as land-slides (false positives).
An error rate that is measured on the training data set is called the apparent misclassification error. This error rate will not reflect the performance of the classifier on a test data set. It will rather be too optimistic, i.e. a biased estimator of the conditional or true error rate of the classifier on an infinite test data set from the same distribution as the training data set (Hand, 1997). The conditional error rate is the quantity of interest in the assessment of classification rules.
An important property of the objects in a test data set is to be independent of the objects in the training data set. This poses a problem in the context of spatial data, where indepen-dence between two observations may in many applications
only be assumed if their distance is greater than some thresh-old, the range of autocorrelation, which may be empirically estimated from the data set (Cressie, 1993).
Further parameters related to the error rate are the sen-sitivity, i.e. the proportion of correctly predicted landslide points, and the specificity, which measures the proportion of correctly predicted non-landslide points. Depending on the purpose of a study and on the cost associated with false-positive and false-negative predictions, the sensitivity or the specificity may be of different relevance in practice (Saisana et al., 2004).
2.3 ROC plots
Many predictive modelling techniques such as logistic re-gression provide predictions of landslide probability instead of directly predicting the presence or absence of a landslide. This makes it easier to adjust the classification rule to re-strictions on sensitivities and specificities, and it also enables us to assess the model’s predictive power independently of a specific probability threshold that may be chosen to classify a grid point as a potential landslide or non-landslide area. Receiver-operating characteristic (ROC) plots can be used for this purpose (Zweig and Campbell, 1993). These curves are obtained by plotting all combinations of sensitivities (on the y-axis) and proportions of false-negatives (1−specificity; on the x-axis) that may be obtained by varying the decision threshold.
The information contained in this plot is often summa-rized by the area under the ROC curve (AUROC; Hosmer and Lemeshow, 2000). This threshold-independent measure of discrimination between both classes takes values between 0.5 (no discrimination) and 1 (perfect discrimination). As for the error rates, the AUROC may be determined on test or training data sets, the latter being referred to as apparent AUROC in the present work.
2.4 Success rate and prediction rate curve
Two types of plots that are similar to the ROC curve have frequently been used in landslide susceptibility modelling: the success rate and prediction rate curves (cf. Chung and Fabbri, 2003). The success rate curve is obtained by varying the decision threshold and plotting the respective sensitivi-ties against the total proportions of the data set classified as landslide. This may be done on independent test data sets or for the training data set, in which case the curve will here be called apparent success rate curve.
Prediction rate curves are the same as success rate curves, except that they are computed for landslide distribution pat-terns (possibly in the training area) for a time point posterior to the training data set’s temporal domain.
3 Review of modelling approaches
A review of recent publications reveals a large number of papers and conference contributions dealing with
predic-A. Brenning: Spatial prediction models for landslide hazards 855
Table 1. Review of predictive modelling and evaluation approaches used in landslide modelling.
Citation Method Covariates Training data Evaluation Ardizzone et al. (2002) Discriminant Morphometry, All grid points? Apparent error rate:
analysis geology, land use 22–23%; disagreement between models based on different inventories: 15.5% Atkinson and Massari (1998) Logistic regression Morphometry, geology, 442 rupture zone Apparent success rates
vegetation centers; 1458 non-landslide cells
Ayalew and Yamagishi (2005) Logistic regression Morphometry, geology, All grid points Apparent AUROC: 0.836, proximity to roads (1 054 768 cells) Pseudo-R2: 0.195 Beguer´ıa and Lorente (2002) Logistic regression Morphometry, satellite All grid points? Apparent error rate:
and thematic data 32%
Chi et al. (2002) Fuzzy inference Morphometry, geology, All grid points? Training and test areas; network forest data prediction rate curves Chung et al. (2002) Favourability Morphometry, geology, All grid points Temporal prediction
functions, fuzzy sets thematic data (437,019 cells) rate curve Chung and Fabbri (2003) Likelihood ratio Success rates in
model separate test areas
and for future slides Gorsevski et al. (2000) Logistic regression, Morphometry Sample of Apparent AUROC:
probit and grid points 0.713–0.716
complementary sensitivity 59%,
log-log model specificity 70%
Lee et al. (2003) Artificial neural Morphometry, vegetation, Random sample Separate test area networks soils
Ohlmacher and Davis (2003) Logistic regression Slope, aspect, 2,022,861 None geology, soils cells
Santacana et al. (2003) Discriminant Morphometry, Random sample Apparent error rate: analysis thematic data 140+140 points; 18%
van Westen et al. (2003) Heuristic “weights Slope, geology, All grid points Apparent success of evidence” thematic data rate curve
tive modelling of landslide hazards and the preparation of statistically-based susceptibility maps. Table 1 gives an overview of methods and data that have been used recently.
Logistic regression and discriminant analysis are the most frequently chosen models. Likelihood ratio methods (Chung, 2003), which are kernel-based classifiers, are also popular (cf. Chung and Leclerc 2003 for a review).
Statistical methods, if used for statistical inference, rely on distributional assumptions, one of which is usually the independence of the observations. This independence as-sumption is violated in the case of sufficiently dense, espe-cially gridded data, yielding e.g. invalid significance state-ments (Ohlmacher and Davis, 2003; Ayalew and Yamagishi, 2005) or invalid estimates of landslide probabilities aggre-gated over a surface (Chung and Fabbri, 2004, p. 165). In the case of logistic regression, there are appropriate methods available that explicitly model spatial autocorrelations (Au-gustin et al., 1996; Gotway and Stroup, 1997; Venables and Ripley, 2002). One such method is applied later in this work. If prediction is the primary task of hazard modelling, the analytical value of classifiers and hence the importance of
the significance of explanatory variables may be put aside, and the evaluation of error and success rates as defined above will deserve greater attention. However, a great part of the published work measures the predictive power on the training data set, yielding a too optimistic assessment if compared to estimates obtained on independent test data sets.
Some authors use either test data from the training area but for a different time period for evaluation (Chung et al., 2002; Chung and Fabbri, 2003), or data from an adjacent test area (Chung and Fabbri, 2003). Since landslide causes and characteristics may vary systematically in space (e.g. due to different geological conditions) and in time (e.g. due to ferent triggering rainfall intensities), they are drawn from dif-ferent distributions, and estimated error rates or success rate curves are hardly transferrable from one particular test data set to the general landslide distribution in the study area. On the other hand, if a random subset of the landslide popula-tion is set aside (Santacana et al., 2003), spatial dependen-cies between training and test data points separated by small distances may produce too optimistic error estimates. Conse-quently, the estimated error rates depend to a different extent
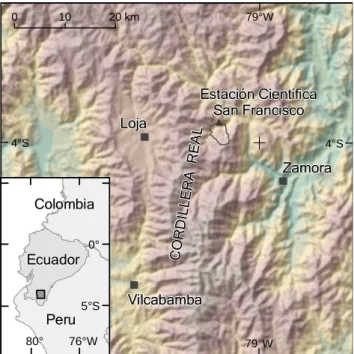
Loja Loja Vilcabamba Vilcabamba Zamora Zamora Estación Científica San Francisco Estación Científica San Francisco 80° 76°W 5°S 0° Ecuador Ecuador Peru Peru Colombia Colombia CO RD ILLE RA RE AL CO RD ILLE RA RE AL 79°W 79°W 4°S 4°S km 0 10 20
Fig. 1. Location of the study area.
on the generalization capabilities of the classifiers. Different evaluation strategies are therefore systematically compared in the following case study.
4 Study area
The case study focuses on the surroundings of the Estaci´on Cient´ıfica San Francisco (ECSF) in the Andes of Southern Ecuador at 4◦10S and 79◦50W (Fig. 1). The ECSF area has been investigated since the year 2000 within the com-pound project “Functionality in a Tropical Mountain Rain-forest” funded by the German Research Foundation (DFG). The aim of this multidisciplinary research project is to an-alyze the rainforest ecosystem of Southern Ecuador and to elaborate options for its sustainable use. This ecosystem is one of the hot spots of biodiversity on Earth (Beck and M¨uller-Hohenstein, 2001; Bussmann, 2001; Richter, 2003).
The study area comprises 11.2 km2and extends from 1720 to 3160 m a.s.l. Landslides were inventoried by Stoyan (2000) at a scale of 1:8800. A total area of 0.94 km2 was classified as active or inactive mass movements in the transi-tion between shallow transitransi-tional landslides and debris flows (Corominas, 1996; Stoyan, 2000). Landslide inventories were compiled for the years 1962, 1969, 1976, 1989 and 1998.
Vegetation is dominated by mountain rainforests and p´aramo. Slashing and burning and subsequent grazing take place in the lower, northwestern part of the mapping area along the road from Loja to Zamora. Landslide incidence is highest in these intervened areas.
5 Methods
Using geomorphometric attributes and information on land use, several statistical classifiers are applied to predict land-slide incidence in the study area. The predictive capabili-ties of these competing methods are compared based on mis-classification error rates estimated using spatial and spatio-temporal cross-validation approaches on independent test data sets. The spatio-temporal prediction situation consists of training classifiers based on all 1989 and pre-1989 data, and to predict with this classifier post-1989 (i. e. year 1998) land-slides based on the knowledge of pre-1998 landland-slides and of land-use data of 1998. Conditions of 1989 are referred to as “present” and 1998 as “future”. These future landslides are only used for error estimation as described below, not for training classifiers.
In general terms, different classifiers are fitted to training data sets, and error rates are measured on the following four types of independent test data sets: (1) Test points scattered within the spatial domain of the training area, corresponding to present conditions (spatial intra-domain error), (2) test data within the spatial domain of the training area, but cor-responding to the future inventory (spatio-temporal
intra-domain error), (3) test points outside the spatial intra-domain
of a restricted training area representing present-day condi-tions (spatial extra-domain error), and (4) test data outside the training area and representing future conditions
(spatio-temporal extra-domain error). Independent test and training
data sets are obtained by applying empirically-derived dis-tance buffers as described below in section 5.2
The difficulty of temporal and of extra-domain prediction lies in possible differences in the stochastic distribution of landslide events outside the spatial and temporal domain of the training data set. Algorithms that are able to generalize from the training data are expected to achieve better results in these settings than algorithms that tend to overfit the pecu-liarities of the training data.
Automated methods for training classification rules are used in the present work. This approach allows to automati-cally replicate training and test data sets and to apply cross-validation to the estimation of misclassification error. This would not be possible with classical statistical model-based approaches, which rely on more or less interactive model fit-ting by an expert. In addition, a qualitative comparison of model-based and data-driven approaches is presented in the discussion.
All analyses are performed within the open-source data analysis environment R (version 1.9.1; R Development Core Team, 2004).
5.1 Classifiers
In the case study, several variants of traditional and more re-cent classification methods are applied, ranging from logis-tic regression over support vector machines to bagging and double-bagging. Artificial neural networks are not used here because of the need for an adjustment of several
hyperpa-A. Brenning: Spatial prediction models for landslide hazards 857 rameters (number of layers, type of weight decay), which is
beyond the scope of this study (cf. Lee et al., 2003).
Logistic regression is a generalized linear model for bi-nary response variables (Hosmer and Lemeshow, 2000). In order to model the probability p of a positive outcome con-ditional on the covariates, p is transformed from the interval
]0, 1[ to its logit ln(p/(1−p)). Logits are unbounded quanti-ties and can be modelled linearly. Linear model coefficients are interpreted in terms of multiplicative changes in the odds
p/(p−1) as a function of a risk factor. Logistic regression is therefore a somehow natural way of analyzing the effect of risk factors on hazard susceptibility. In the present work, logistic regression is performed both after applying an au-tomatic stepwise backward variable selection based on the Akaike Information Criterion (AIC), which penalizes for the number of explanatory variables (acronym glmstep), and us-ing all available variables without selection (glm).
Spatial data are frequently autocorrelated up to a certain distance called the range of autocorrelation (Cressie, 1993). Classical logistic regression, which assumes independent ob-servations, will therefore yield wrong significance statements for model coefficients. A variant of logistic regression that honors spatial autocorrelation (glmspat) is included here. It is based on penalized quasi-likelihoods and implemented in the R functionglmmPQL(Venables and Ripley, 2002). The iterative fitting algorithm is numerically more demanding and less stable than the one used for ordinary logistic regres-sion. Therefore only a manually preselected set of (the most important) geomorphometric and thematic covariates could be used in the present context of repeated automated model fitting. The spatial correlation structure was represented by a fixed spherical correlogram with a range parameter of 180 m as derived from empirical residual correlograms of an ad-hoc ordinary logistic regression.
Support vector machines are a more recently developed method that is based on nonlinear transformations of the covariates into a higher-dimensional feature space (Vapnik, 2001). In this space, an optimal separating hyperplane is computed. In this work, C-classification is performed with radial basis functions as kernels, and shrinking heuristics are applied. The SVM implementation of the R package e10711 is used with default parameter settings.
Classification trees recursively split the covariate space into disjoint subsets (Breiman et al., 1984). These subsets are assigned to one of the classes, landslide or non-landslide. An object from the test data set is dropped down the tree in order to determine the subset it belongs to and hence to pre-dict its class membership.
Since classification trees are instable with respect to slight modifications of the training data set, bootstrap-aggregation techniques such as bagging have been proposed (Breiman, 1by D. Meyer, Institute of Information Systems, Vienna
Uni-versity of Economics and Business Administration, based on code by Chih-Chung Chang and Chih-Jen Lin, Department of Computer Science and Information Engineering, National Taiwan University, Taipei.
1996). Bagging consists of training separate classification trees on random subsamples of the data set. The bootstrap-aggregated prediction is obtained by majority voting among these trees. In this work, 25 bootstrap replications are used.
Double-bagging (Hothorn and Lausen, 2003) is an exten-sion of bagging that combines classification trees with other classifiers, in this work with stabilized linear discriminant analysis (L¨auter, 1992; dbagslda), logistic regression
(dbag-glm) and SVM (dbagsvm). Specifically, one of these
classi-fiers is trained on the out-of-bag sample, i.e. the part of the training data set that is not included in the bootstrap sam-ple. The prediction function of this classifier (in the case of discriminant analysis, the discriminant function) is used as an additional covariate in bootstrap-aggregated tree growth. This makes predictions smoother and more efficient than in bagging, and uses the information contained in the out-of-bag sample. Bagging and double-out-of-bagging are implemented in the R package ipred2.
5.2 Estimation of error rates
Misclassification rates are used to compare the predictive power of classifiers. While in a practical context different cost may be associated with both error types (false-positives and false-negatives), here both are treated as equally impor-tant since a more appropriate cost function is not available. Furthermore, independently of the proportion of landslide and non-landslide areas in the inventory maps, all analy-ses presented here are based on balanced training and test data sets of 50% landslide and 50% non-landslide samples. These simplifications were made in order to focus on dif-ferences between the classifiers that are independent of the actual prevalence of landslides.
Traditional cross-validation is based on partitioning the set of observations into equally-sized subsets to train the classi-fier on all but one of these subsets and test it on the remaining one (Efron and Gong, 1983; Efron and Tibshirani, 1986). Er-rors measured on these test data sets are averaged over all test data sets in order to obtain an overall error estimate. Cross-validation assumes that (pairs of) observations in different subsets of the partition are independent. In a spatial context, this is not easy to achieve.
The following procedure is used to extract appropriate test and training data sets from the gridded landslide inven-tory: First, an empirical correlogram was estimated from the (logit-scale) residuals of an ad-hoc logistic regression model of landslide distribution. The correlogram shows an approxi-mate range parameter of 180 m, indicating that the random component of landslide susceptibility distribution is auto-correlated at distances below this threshold. If the random field is assumed to be second-order stationary and Gaussian, model errors at pairs of points more than 180 m apart may be considered independent. If the assumptions do not hold, the 2by T. Hothorn, Institute of Medical Informatics, Biometry and
Epidemiology, University of Erlangen-N¨urnberg, Erlangen, Ger-many.
mentioned minimum distance between points is a necessary condition for independence. It is therefore an important con-straint for spatial cross-validation that the minimum distance of each test data point to the training data points is greater than the correlogram range.
In the present case study, first a set of 20 landslide and 20 non-landslide grid points is sampled from the study area in order to use it as a spatial test data set for the prediction of “present-day” (1989) landslide distribution. In addition, for spatio-temporal error estimation, samples of the same size are drawn from the inventory of “future” (1998) landslides. Based on the mentioned ad-hoc estimate of the correlogram range of ∼180 m, all grid points within this distance from both test data sets are excluded from the area from which the training data set is drawn randomly.
The size of the training data set is varied in order to deter-mine how the different methods are able to deal with an in-creasing spatial dependence of the data. The largest training data set consists of 1600 landslide and 1600 non-landslide points. It is split into two disjoint data sets of 800+800 and then four data sets of 400+400 points each.
This procedure of sampling both 20+20 test samples and an independent 1600+1600 training data set is repeated 50 times independently. Spatial and spatio-temporal intra-domain error rates are estimated on the corresponding test data sets. These estimates based on independent test data sets are estimates of the respective conditional misclassifica-tion rate.
Since it is not only desirable to achieve good predictions within the area spanned by the training data set, in a second evaluation approach the ability of predicting spatial trends beyond the training area is measured by means of extra-domain error rates. For this purpose, two subareas in the ex-treme southwest and northeast are used as test areas. These subareas, which comprise about half the mapping area, rep-resent an intervened area with high landslide incidence and a high-elevation area with low incidence. The area from which training data sets are drawn is separated from the test areas by a 180 m wide buffer in order to achieve independence. Both spatial and spatio-temporal error rates are calculated for the test areas.
The estimated error rates are compared to the results of the best classifier for each of the scenarios by means of a paired t-test. To adjust for multiple testing, a Bonferroni correction was applied to control family-wise error rates (Westfall and Young, 1993). The Bonferroni correction consists of multi-plying all p-values by the total number of tests performed in an analysis.
5.3 Explanatory variables
Digital elevation models (DEM) have become inexpensive sources of topographic information and hence a data base for the computation of geomorphometric attributes that are re-lated to mass movements. For the present case study, a set of standard topographic attributes has been derived from a DEM created by Stoyan (2000), which is based on contour
lines and corrected according to air photos and field measure-ments. The nominal resolution of the DEM is 5 m. Similar to the papers discussed earlier in this work, the terrain pa-rameters used range from local papa-rameters (elevation, slope, aspect, plan, profile and total curvature, convergence index) to parameters that depend on topological site characteristics (contributing area, its height, mean slope and mean aspect; vertical distance to channel network and from ridge). In the case of skewed variables or variables for which a nonlinear relationship is to be expected, simple transforms (logarithm; binary splits such as “distance to past landslides smaller than 200 m”) were added without regard of the covariates’ actual empirical relation to the response, i. e. without fitting the co-variates to the data manually. Terrain parameters were com-puted using the software SAGA3.
Multi-temporal land use and deforestation patterns in the study area as compiled by Stoyan (2000) were used as ad-ditional covariates. These covariates are categorical vari-ables such as a binary variable representing the polygonal deforestation areas. In addition, distance parameters were computed for such areas, and a set of binary splits of these variables was produced (e.g. “distance to road smaller than 200 m”). Reliable geological information is not available at the scale of the inventory.
6 Results
6.1 Extra-domain error rates
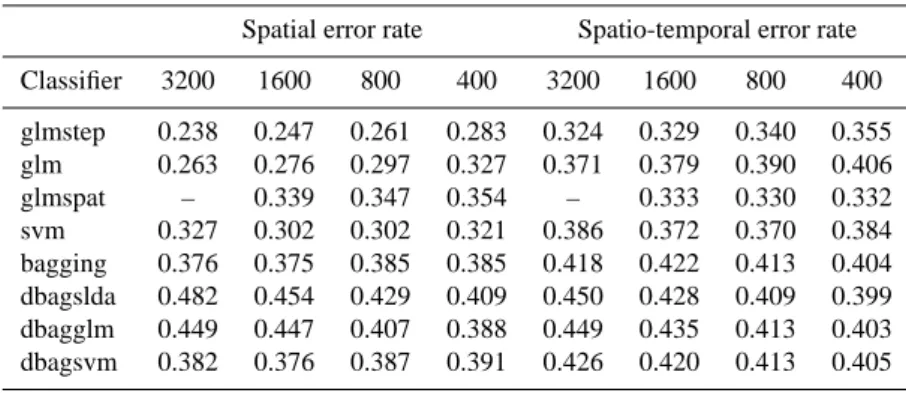
Logistic regression with stepwise variable selection achieved the lowest estimates of conditional error rates both for the spatial prediction of “present” landslides and the spatio-temporal prediction of “future” landslides outside the train-ing area. This is true for all sizes of traintrain-ing data sets con-sidered. Best results are obtained for the largest training data sets, the overall optimum being an error rate of 0.24 for present and 0.32 for future landslides (Table 2). This method is followed by logistic regression without variable selection in the case of spatial prediction, and by logistic re-gression with spatial autocorrelation structure in the case of future landslides.
SVM achieve average results as regards estimates of con-ditional error rates, with comparatively better results for present landslides than for future ones. Bagging and double-bagging perform considerably worse than the other methods regarding the conditional error estimates. There are no great differences within this group of classifiers, independently of the method trained on the out-of-bag sample.
6.2 Intra-domain error rates
Error rates obtained for independent test points within the spatial domain of the training data set show a different be-havior compared to the extra-domain error rates (Table 3).
3by O. Conrad, Geographical Institute, University of G¨ottingen,
A. Brenning: Spatial prediction models for landslide hazards 859
Table 2. Extra-domain error rates for present and future landslide prediction.
Spatial error rate Spatio-temporal error rate Classifier 3200 1600 800 400 3200 1600 800 400 glmstep 0.238 0.247 0.261 0.283 0.324 0.329 0.340 0.355 glm 0.263 0.276 0.297 0.327 0.371 0.379 0.390 0.406 glmspat – 0.339 0.347 0.354 – 0.333 0.330 0.332 svm 0.327 0.302 0.302 0.321 0.386 0.372 0.370 0.384 bagging 0.376 0.375 0.385 0.385 0.418 0.422 0.413 0.404 dbagslda 0.482 0.454 0.429 0.409 0.450 0.428 0.409 0.399 dbagglm 0.449 0.447 0.407 0.388 0.449 0.435 0.413 0.403 dbagsvm 0.382 0.376 0.387 0.391 0.426 0.420 0.413 0.405
Table 3. Intra-domain error rates for present and future landslide prediction.
Spatial error rate Spatio-temporal error rate Apparent error rate Classifier 3200 1600 800 400 3200 1600 800 400 3200 1600 800 400 glmstep 0.290 0.295 0.301 0.317 0.343 0.344 0.351 0.358 0.187 0.186 0.181 0.171 glm 0.317 0.315 0.329 0.345 0.350 0.352 0.359 0.378 0.176 0.171 0.161 0.137 glmspat – 0.338 0.339 0.334 – 0.327 0.314 0.336 – 0.267 0.264 0.240 svm 0.326 0.319 0.319 0.324 0.343 0.340 0.330 0.337 0.117 0.127 0.133 0.133 bagging 0.379 0.330 0.313 0.310 0.374 0.348 0.344 0.332 0.001 0.001 0.001 0.002 dbagslda 0.370 0.335 0.310 0.312 0.381 0.360 0.345 0.334 0.001 0.001 0.001 0.001 dbagglm 0.354 0.331 0.311 0.310 0.370 0.352 0.333 0.332 0.000 0.001 0.001 0.002 dbagsvm 0.373 0.337 0.316 0.312 0.361 0.349 0.338 0.335 0.001 0.001 0.001 0.002
In the case of conditional error rates for the distribution of present landslides, logistic regression with variable selec-tion (glmstep) generally achieves the best results (lowest er-ror rate: 0.29). For small sample sizes, erer-ror rates slightly increase, and there is no significant difference if compared to bagging and double-bagging predictors. These overfit, yield-ing highest error rates for large sample sizes. SVM does a good job for all sample sizes.
As regards the prediction of future landslides within the spatial training domain, logistic regression with spatial de-pendence (glmspat) achieves lowest estimated conditional er-ror rates. However, there is no significant difference com-pared to the other classifiers, since the general variability of error rates is greater than in the previous setting.
Estimated apparent error rates are much lower than the previously presented unbiased estimates of the conditional misclassification rate. Tree-based methods achieve apparent error rates < 1%, while SVM and logistic regression yield apparent error rates of more than half the unbiased estimates of the conditional error.
Since apparent error rates may be taken as (possibly too optimistic) upper bounds of the true error rate (Hand, 1997), and since glmspat generally performed quite well on inde-pendent test data, it is suggested that logistic regression with stepwise variable selection is very close to the minimum er-ror rates that may be achieved with this class of classifiers
and the covariates at hand. The estimated extra-domain er-ror rates are lower than intra-domain erer-rors. This can be at-tributed to the circumstance that the proportion of probably man-made landslides is greater in the test area than in the training area; man-made landslides are apparently easier to predict than landslides in the less intervened areas.
6.3 Susceptibility maps
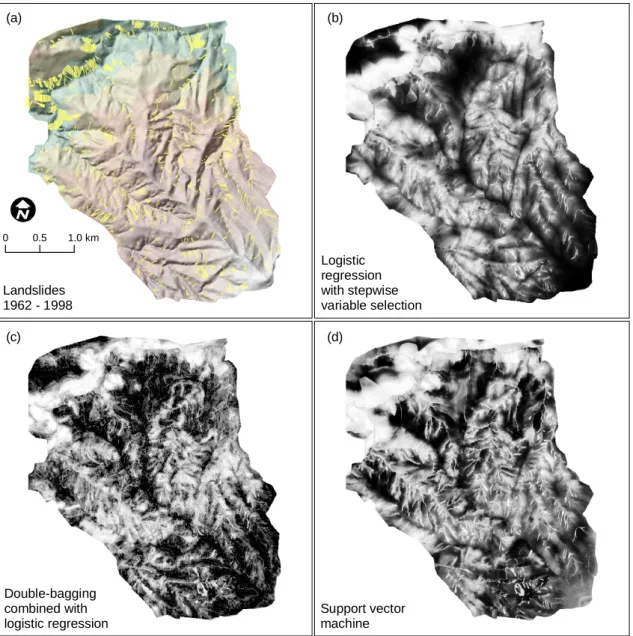
Figure 2 shows susceptibility maps for spatial intra-domain prediction using logistic regression with variable selection, double-bagging combined with logistic regression, and sup-port vector machines.
Logistic regression shows a smooth prediction surface, ex-cept for areas with changes in the categorical variables such as land-use boundaries or pre-existing landslide scarps. SVM predictions look similar, but show finer spatial structuring be-cause the method incorporates more complex variable trans-formations into the predictor. Interestingly, SVM predicts an altitudinal increase in landslide susceptibility towards the mountain situated in the extreme southeast of the study area. This (unrealistic) feature is missing in the logistic regression map.
In contrast to logistic regression, the tree-based predictions of bagging and double-bagging are not continuous func-tions of the covariates. They produce a complex
predic-Logistic regression with stepwise variable selection Double-bagging combined with logistic regression Support vector machine Landslides 1962 - 1998 (a) (b) (c) (d) 0 0.5 1.0 km
Fig. 2. (a) The overall distribution of landslides (yellow), and, (b)–(d), landslide susceptibility maps produced with logistic regression,
double-bagging and support vector machines.
tion pattern with isolated grid points of high susceptibility and some abrupt changes within short distances. These pat-terns hinder the construction of susceptibility maps that can be used in practice at the given scale, since individual high-susceptibility grid points are spread over the entire mapping area. The higher generalization capability of SVM and espe-cially of logistic regression are desirable features for hazard zonation.
6.4 Stability considerations
Both SVM and tree-based method are very stable algorithms. Ordinary logistic regression is also rather stable, but is sub-ject to the limitations of any linear model regarding the non-collinearity of covariates. This sometimes causes problems in the case of automated stepwise variable selection with
many covariates, especially when interaction terms are in-volved, which was avoided here for this reason.
Logistic regression with spatial autocorrelations as imple-mented byglmmPQLin R was the least stable method. Some subjectively less relevant covariates could not be included in these models since the full set of variables frequently pro-duced errors. In addition, 512 MB of RAM were not enough forglmmPQLto run on a training data set of 3200 autocor-related points. This method was also by far the slowest one.
7 Discussion
The results of the case study show that logistic regression with stepwise variable selection is flexible enough to com-pare favorably with machine-learning algorithms such as SVM and double-bagging. In contrast especially to the
lat-A. Brenning: Spatial prediction models for landslide hazards 861 ter, overfitting is not a serious problem for logistic regression.
Differences between the classifiers were greatest for predic-tions outside the training area (extra-domain error rates).
The large differences between biased apparent error rates and “true”, conditional error rates underlines the importance of using a spatial cross-validation technique based on repli-cated independent test data sets. This is crucial in the case of highly flexible machine-learning algorithms, and less prob-lematic if logistic regression is applied.
Regarding the model-based representation of spatial de-pendence in logistic regression, the results obtained with
glmmPQL suggest that a statistically correct model is not needed to achieve good predictive properties. However, if statistical inference on model coefficients are a secondary objective for analytical purposes, an adequate representation of the spatial autocorrelation structure is mandatory, but sub-ject to the uncertainties of fitting a covariance structure to the data.
Logistic regression and SVM produce sufficiently smooth prediction surfaces as for creating landslide susceptibility maps. Tree-based methods are more prone to producing spa-tial artifacts such as sudden changes in predicted landslide probability on rather smooth terrain surfaces.
While only automatic model-building algorithms have been considered so far, the interactive, manual analysis and variable selection in conjunction with logistic regression is a serious alternative. Experienced spatial modelers will easily recognize certain (univariate) nonlinearities in the relation-ship between the response variable and a covariate, or the need for applying transformations to the data. These data modelling tasks may also be achieved by flexible machine-learning algorithms, but only at the risk of overfitting the training data. Human analysts, in contrasts, make use of con-straints that arise from their domain knowledge, which may especially be useful in the case of extra-domain predictions.
8 Conclusions
Logistic regression with stepwise variable selection is an ad-equate method for the prediction of landslide susceptibility. In the present case study, this method compares favorably to machine-learning classifiers, which are more prone to over-fitting. In addition, variants of logistic regression that are able to represent spatial autocorrelation structures may be ap-plied for analytical purposes.
Even if a purely data-driven approach is used, the es-timated apparent and more relevant conditional error rates demonstrate how important it is to take into account spatial autocorrelations during model evaluation.
Beyond the use of misclassification error rates, related quality measures such as the sensitivity and specificity of the classifier will have to be controlled in practice, depending on the specific aims of a susceptibility map to be created. For this purpose, appropriate cost functions have to be defined for both error types. It will be of particular importance to
account for the spatial variability of these cost functions de-pending on infrastructure and land use.
Acknowledgements. The author thanks R. Stoyan, Erlangen, for
providing the landslide inventory and additional thematic data from the ECSF area.
Edited by: T. Glade
Reviewed by: G. Dubois and another referee
References
Allison, R. J., ed.: Applied geomorphology, Wiley, 2002.
Ardizzone, F., Cardinali, M., Carrara, A., Guzzetti, F., and Reichen-bach, P.: Impact of mapping errors on the reliability of landslide hazard maps, Nat. Hazards Earth Syst. Sci., 2, 3–14, 2002,
SRef-ID: 1684-9981/nhess/2002-2-3.
Atkinson, P. M. and Massari, R.: Generalised linear modelling of susceptibility to landsliding in the Central Apennines, Italy, Comp. Geosci., 24, 373–385, 1998.
Augustin, N. H., Mugglestone, M. A., and Buckland, S. T.: An autologistic model for the spatial distribution of wildlife, J. Appl. Ecol., 33, 339–347, 1996.
Ayalew, L. and Yamagishi, H.: The application of GIS-based logis-tic regression for landslide susceptibility mapping in the Kakuda-Yahiko Mountains, Central Japan, Geomorphology, 65, 15–31, 2005.
Beck, E. and M¨uller-Hohenstein, K.: Analysis of undisturbed and disturbed tropical mountain forest ecosystems in Southern Ecuador, Die Erde, 132, 1–8, 2001.
Beguer´ıa, S. and Lorente, A.: Damocles. Debrisfall assessment in mountain catchments for local end-users, Tech. rep., Instituto Pirenaico de Ecolog´ıa, Zaragoza, 2002.
Breiman, L.: Bagging predictors, Machine Learning, 24, 123–140, 1996.
Breiman, L., Friedman, J. H., Olshen, R. A., and Stone, C. J.: Clas-sification and regression trees, Chapman & Hall / CRC Press, New York, 1984.
Brenning, A.: Climatic and geomorphological controls of rock glaciers in the Andes of Central Chile: Combining statisti-cal modelling and field mapping, Dissertation, Mathematisch-Naturwissenschaftliche Fakult¨at II, Humboldt-Universit¨at zu Berlin, Berlin, urn:nbn:de:kobv:11-10049648, 2005.
Bussmann, R. W.: Epiphyte diversity in a tropical andean forest – Reserva Biol´ogica San Francisco, Zamora–Chinchipe, Ecuador, Ecotropica, 7, 43–60, 2001.
Casadei, M., Dietrich, W. E., and Miller, N. L.: Testing a model for predicting the timing and location of shallow landslide ini-tiation in soil-mantled landscapes, Earth Surface Processes and Landforms, 28, 925–950, 2003.
Chi, K.-H., Park, N.-W., and Chung, C. F.: Fuzzy logic integra-tion for landslide hazard mapping using spatial data from Boeun, Korea, in Symposium on Geospatial Theory, Processing and Ap-plications, Ottawa, 2002.
Chung, C. F.: Use of airborne geophysical surveys for constructing mineral potential maps, Economic geology, 11, 1–13, 2003. Chung, C. F. and Fabbri, A. G.: Validation of spatial prediction
models for landslide hazard mapping, Nat. Haz., 30, 451–472, 2003.
Chung, C. F. and Fabbri, A. G.: Systematic procedures of land-slide hazard mapping for risk assessment using spatial prediction models, in Glade et al. (2004), 140–173, 2004.
Chung, C. F. and Leclerc, Y.: Use of quantitative techniques for zoning landslide hazard, in: Earthquake Hazard Mapping for Landuse and Emergency Planning, Summary of Conference Pre-sentations, edited by: Levson, V. M. and Jonnes, S., Ministry of Energy, Mines and Petroleum Resources, British Columbia, Canada, 2003.
Chung, C. F., Kojima, H., and Fabbri, A. G.: Stability analysis of prediction models for landslide hazard mapping, in Allison (2002), 3–19, 2002.
Corominas, J.: Debris slide, in Dikau et al. (1996), 97–102, 1996. Cressie, N. A. C.: Statistics for spatial data, John Wiley & Sons,
New York, 1993.
Dikau, R., Brunsden, D., Schrott, L., and Ibsen, M.-L. (eds.): Land-slide recognition: identification, movement and causes, John Wi-ley & Sons, Chichester, 1996.
Efron, B. and Gong, G.: A leisurely look at the bootstrap, the jack-knife, and cross-validation, American Statistician, 37, 36–48, 1983.
Efron, B. and Tibshirani, R.: The bootstrap method for standard errors, confidence intervals, and other measures of statistical ac-curacy, Statistical Science, 1, 1–35, 1986.
Glade, T., Anderson, M., and Crozier, M. J. (eds.): Landslide hazard and risk, Wiley, 2004.
Gorsevski, P. V., Gessler, P., and Foltz, R. B.: Spatial prediction of landslide hazard using logistic regression and GIS, in 4th Inter-national Conference on Integrating GIS and Environmental Mod-eling (GIS/EM4), Problems, Prospects and Research Needs, 2–8 September, 2000, Banff, Alberta, Canada, 2000.
Gotway, C. A. and Stroup, W. W.: A generalized linear model ap-proach to spatial data analysis and prediction, Journal of Agri-cultural, Biological, and Environmental Statistics, 2, 157–178, 1997.
Hand, D. J.: Construction and assessment of classification rules, Wiley Series in Probability and Statistics, John Wiley & Sons, Chichester, 1997.
Hosmer, D. W. and Lemeshow, S.: Applied logistic regression, John Wiley & Sons, New York, 2nd edn., 373 pp., 2000.
Hothorn, T. and Lausen, B.: Double-bagging: combining classifiers by bootstrap aggregation, Pattern Recognition, 36, 1303–1309, 2003.
L¨auter, J.: Stabile multivariate Verfahren, Akademie Verlag, Berlin, 1992.
Lee, S., Ryu, J.-H., Min, K., and Won, J.-S.: Landslide suscep-tibility analysis using GIS and artificial neural network, Earth Surface Processes and Landforms, 28, 1361–1376, 2003. Ohlmacher, G. C. and Davis, J. C.: Using multiple logistic
regres-sion and GIS technology to predict landslide hazard in northeast Kansas, USA, Engineering Geology, 69, 331–343, 2003. R Development Core Team: R: A language and environment for
statistical computing, R Foundation for Statistical Computing, Vienna, Austria, http://www.R-project.org, 2004.
Richter, M.: Using epiphytes and soil temperatures for eco-climatic interpretations in Southern Ecuador, Erdkunde, 57, 161–181, 2003.
Saisana, M., Dubois, G., Chaloulakou, A., and Spyrellis, N.: Clas-sification criteria and probability risk maps: limitations and per-spectives, Environmental Science and Technology, 38, 1275– 1281, 2004.
Santacana, N., Baeza, B., Corominas, J., de Paz, A., and Marturi´a, J.: A GIS-based multivariate statistical analysis for shallow land-slide susceptibility mapping in La Pobla de Lillet area (Eastern Pyrenees, Spain), Nat. Haz., 30, 281–295, 2003.
Stoyan, R.: Aktivit¨at, Ursachen und Klassifikation der Rutschungen in San Francisco/S¨udecuador, Diplomarbeit, Geographisches In-stitut, Univ. Erlangen–N¨urnberg, Erlangen, Germany, 2000. van Westen, C. J., Rengers, N., and Soeters, R.: Use of
geomor-phological information in indirect landslide susceptibility assess-ment, Nat. Haz., 30, 399–419, 2003.
Vapnik, V. N.: The nature of statistical learning theory, Statistics for Engineering and Information Science, Springer, New York, 2nd edn., 2001.
Venables, W. N. and Ripley, B. D.: Modern applied statistics with S, Springer, New York, 4th edn., 2002.
Westfall, P. H. and Young, S. S.: Resampling-based multiple test-ing, Wiley, New York, 1993.
Zweig, M. H. and Campbell, G.: Receiver-operating characteristic (ROC) plots, Clinical Chemistry, 39, 561–577, 1993.