HAL Id: hal-00317873
https://hal.archives-ouvertes.fr/hal-00317873
Submitted on 13 Oct 2005
HAL is a multi-disciplinary open access
archive for the deposit and dissemination of
sci-entific research documents, whether they are
pub-lished or not. The documents may come from
teaching and research institutions in France or
abroad, or from public or private research centers.
L’archive ouverte pluridisciplinaire HAL, est
destinée au dépôt et à la diffusion de documents
scientifiques de niveau recherche, publiés ou non,
émanant des établissements d’enseignement et de
recherche français ou étrangers, des laboratoires
publics ou privés.
Observations of neutral winds, wind shears, and wave
structure during a sporadic-E/QP event
M. F. Larsen, M. Yamamoto, S. Fukao, R. T. Tsunoda, A. Saito
To cite this version:
M. F. Larsen, M. Yamamoto, S. Fukao, R. T. Tsunoda, A. Saito. Observations of neutral winds,
wind shears, and wave structure during a sporadic-E/QP event. Annales Geophysicae, European
Geosciences Union, 2005, 23 (7), pp.2369-2375. �hal-00317873�
SRef-ID: 1432-0576/ag/2005-23-2369 © European Geosciences Union 2005
Annales
Geophysicae
Observations of neutral winds, wind shears, and wave structure
during a sporadic-E/QP event
M. F. Larsen1, M. Yamamoto2, S. Fukao2, R. T. Tsunoda3, and A. Saito4
1Department of Physics, Clemson University, Clemson, SC, USA
2Research Institute of Sustainable Humanosphere, Kyoto University, Gokasho, Uji, Kyoto 611-0011, Japan 3SRI International, Menlo Park, CA, USA
4Department of Geophysics, Kyoto University, Kyoto 606-8502, Japan
Received: 24 March 2005 – Revised: 29 September 2005 – Accepted: 27 June 2005 – Published: 13 October 2005 Part of Special Issue “SEEK-2 (Sporadic-E Experiment over Kyushu 2)”
Abstract. The second Sporadic E Experiment over Kyushu
(SEEK-2) was carried out on 3 August 2002, during an ac-tive sporadic-E event that also showed quasi-periodic (QP) echoes. Two rockets were launched into the event from Kagoshima Space Center in southern Japan 15 min apart. Both carried a suite of instruments, but the second rocket also released a trimethyl aluminum (TMA) trail to measure the neutral winds and turbulence structure. In a number of earlier measurements in similar conditions, large winds and shears that were either unstable or close to instability were observed in the altitude range where the ionization layer occurred. The SEEK-2 wind measurements showed similar vertical struc-ture, but unlike earlier experiments, there was a significant difference between the up-leg and down-leg wind profiles. In addition, wave or billow-like fluctuations were evident in the up-leg portion of the trail, while the lower portion of the down-leg trail was found to have extremely strong turbulence that led to a rapid break-up of the trail. The large east-west gradient in the winds and the strong turbulence have not been observed before. The wind profiles and shears, as well as the qualitative characteristics of the strong turbulence are pre-sented, along with a discussion of the implications of the dy-namical features.
Keywords. Ionosphere (Mid-latitude ionosphere; Iono-spheric irregularities; Electric field and currents)
1 Introduction
The first Sporadic-E Experiment over Kyushu (SEEK) (Fukao et al., 1998) was carried out in August 1996 and pro-vided the first comprehensive measurements of the electrody-Correspondence to: M. F. Larsen
namic parameters in a quasi-periodic (QP) radar echo event. Radar echoes of this type were first identified unambiguously by Yamamoto et al. (1991, 1992), although some earlier stud-ies, such as that by Riggin et al. (1986), also showed evi-dence of similar structure, but these studies only provided measurements of some parameters, such as the radar echo morphology or Doppler shifts. The first SEEK campaign, on the other hand, provided measurements of a broad range of parameters, including the detailed electron density structure, the electric fields, and the neutral wind profile across the alti-tude range where the sporadic-E layer and QP structure were detected by ground-based coherent scatter radar.
An important conclusion of the earlier experiment was that the enhanced ionization layer was found in a region of strong shear. The collocation of the shear layer and the sporadic layer was not unexpected, of course (see, e.g. Whitehead, 1970, and references therein), but the magnitude of the shear was large enough to suggest that Kelvin-Helmholtz billows were likely to be present in the altitude range where the ion-ization layer was found (Larsen et al., 1998). These results led Larsen (2000) to re-examine the data available from past rocket and radar measurements made in sporadic-E condi-tions, which consistently showed neutral wind shears in the vicinity of the layers that were either unstable or close to instability in the Richardson number sense. In fact, the ob-served characteristics of the QP echo structures show spa-tial structures and periodicities that are in general agreement with those that would be expected for shear layers with the vertical gradients and shear magnitudes that have been ob-served. Larsen (2000) therefore suggested that the neutral shear instability could be responsible for the initial vertical displacements of the ionization that would seed the plasma instability responsible for the coherent radar echoes.
The dynamics and instability processes responsible for the QP echo phenomenon are still not clear. Recent modeling
2370 M. F. Larsen et al.: SEEK-2 winds and shears
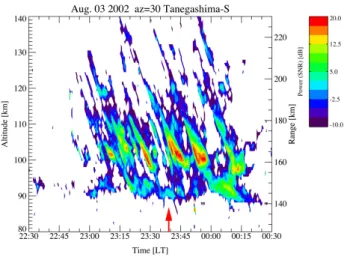
Fig. 1. Coherent scatter radar echoes shown as a function of range and time for the event studied in the experiment.
results have shown that large polarization electric fields can develop in conditions that are representative of sporadic-E (see, e.g. Yokoyama et al., 2004a,b, 2005). Other studies have developed the theory for new types of instabilities (see, e.g. Kagan, 2002; Tsunoda et al., 2004). The instability de-scribed by Tsunoda et al. (2004, and references therein) is particularly notable because it predicts the prevalent north-west to southeast orientation of the QP echo structures. Whichever mechanism or combination of mechanisms ulti-mately provides the best explanation of the physics, it seems clear that the neutral winds are critical to the electrodynamics and plasma physics of the sporadic-E layer. Larsen (2002) has shown that the winds and shears in the altitude range from 90 to 120 km are larger than those predicted by gen-eral circulation models or tidal theory, presumably because of gravity wave breaking or other small-scale instabilities (e.g. Larsen et al., 2004) that are not treated adequately by the models or theory. The somewhat limited set of neutral wind profile measurements made in sporadic-E conditions suggest that the shears and wind speeds in those conditions are at the extreme end of the range, i.e. the shears and wind speeds are consistently larger than the average values for that part of the atmosphere. In addition to acting as a driver for currents and electric fields, the large shears also provide a mechanism for generating structure within and vertical displacements of the ionization that can serve as a seeding mechanism for the various instabilities that have been proposed as an explana-tion for the QP echoes. Random gravity waves can serve the same purpose, but the Kelvin-Helmholtz billows have the ad-vantage that they would be generated by the same shears that are associated with the sporadic layers so that the seeding is directly related to the same processes that are responsible for the electrodynamic and plasma instabilities.
The objective of the SEEK-2 experiment was to provide a set of comprehensive measurements of the electrodynamic and plasma parameters in the environment that produces QP echo structure, as described by Yamamoto et al. (2005).
Al-though a number of earlier experiments have provided wind measurements in sporadic-E or QP conditions, the condi-tions observed in SEEK-2 showed significantly more vari-ability and larger gradients than in those earlier experiments and thus provide additional information about the range of variation that can be expected.
2 Experiment description
The SEEK-2 launches were carried out during the night of 3 August 2002, from Uchinoura Space Center in the southern part of Kyushu Island in Japan. The coherent scatter radar echoes from a 32-MHz radar during the launch event are shown in Fig. 1. The radar was located at the southern end of Tanegashima Island. The echoes show typical QP echo struc-tures with striations that slant toward the radar with increas-ing time and periodicities of 5–10 min between adjacent stri-ations. The direct measurement provided by the radar is the range to the echoes, which is shown in the right-hand scale in the figure. If the scatterers are aligned with the magnetic field lines, as expected, then the perpendicularity condition can be used to convert the range measurement to corresponding al-titude, shown on the left-hand scale in the figure. The mea-surements then indicate that the strongest scatter was from the altitude range between ∼98–105 km. The radar observa-tions are described in much greater detail in the companion paper by Saito et al. (2005), as well as in the overview paper by Yamamoto et al. (2005)
There were two launches in the SEEK-2 experiment. The first rocket carried a compliment of instruments only and was launched at 23:24 LT (see Yamamoto et al., 2005). The second rocket carried instruments and a trimethyl aluminum (TMA) canister that released a trail used to measure the neu-tral winds in the lower E region. The launch of the second rocket was at 23:39 LT, shown by the red arrow in Fig. 1. The flight of that rocket and the time during which the trail was visible thus occurred during a period when the echoes were strongest.
The geometry for the experiment is shown in Fig. 2. The coherent scatter radar was located in the southern part of Tanegashima, the launch site was at Uchinoura, and the rocket trajectory is shown by the light line that extends east-southeastward from Uchinoura. The section of the trajectory where TMA was released is shown as a thicker line. The re-lease was continuous across the flight apogee, so there was a section near the midpoint of the trajectory where the trail was close to horizontal. The map also shows the location of the camera sites that were used for the observations and subsequent triangulation of the trail, namely Tanegashima, Uchinoura, and Kochi.
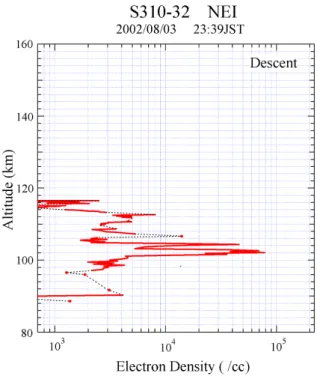
The electron density profiles measured during the flight are shown in Figs 3 and 4. The peak layer density occurred near 102 km with peak values exceeding 105cm−3on the up-leg portion of the flight and slightly lower peak values on the down-leg. There are several secondary layers, the most prominent being the one located near 105 km on the up-leg.
Fig. 2. Map showing the rocket trajectory and camera sites. The co-herent scatter radar was located at the southern end of Tanegashima.
Fig. 3. Electron density measured on the rocket during the up-leg portion of the flight. Values are in units of cm−3
The measurements and other aspects of the observations are discussed in more detail by Wakabayashi et al. (2005). 2.1 Wind measurements
Trimethyl aluminum has been used extensively as a tracer of the neutral motion in the E region (e.g. Larsen, 2002, and references therein). The trail was released during the flight starting at an altitude of ∼85 km, through apogee at 117 km, and to a similar altitude on the down-leg portion of the
tra-Fig. 4. Electron density measured on the rocket during the down-leg portion of the flight. Values are in units of cm−3
jectory. The release occurred over a period of a few min-utes. The TMA was visible for approximately five to thirty minutes, depending on the altitude. The triangulation was carried out using images from the three sites shown in Fig. 2. Because the apogee was very low, below 120 km, the top part of the trail was nearly horizontal, making it difficult to trian-gulate. The results presented here are therefore limited to altitudes at and below 110 km where the trail was more ver-tical and there was a clear separation between the up-leg and down-leg sections of the trail.
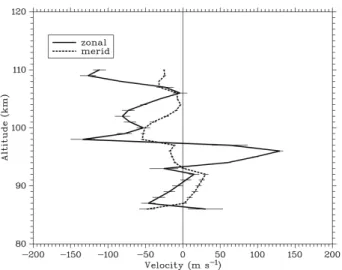
The up-leg wind profile produced by the triangulation pro-cedure is shown in Fig. 5. The winds are relatively small in magnitude, with maximum wind speeds that do not ex-ceed 80 m s−1. The down-leg wind profile shown in Fig. 6, on the other hand, has much larger maximum wind speeds, including winds exceeding 150 m s−1 near 96 km, 98 km, and 109 km. The two profiles are significantly different with much greater structure in the eastern, i.e. down-leg, profile. 2.2 Shear profiles
The wind shear profiles are shown in Figs. 7 and 8. The shears overall are much larger in the down-leg profile than in the up-leg profile, as would be expected from the wind pro-files shown in the previous section. In the up-leg profile the largest shears occur between 100 and 110 km. The down-leg profile shows large shears below 100 km that are not present in the up-leg profile. The shears above 100 km in that profile are generally consistent with the shears in the up-leg profile both in magnitude and in location, at least with respect to the shears in the zonal winds. The meridional winds have larger
2372 M. F. Larsen et al.: SEEK-2 winds and shears
Fig. 5. Wind components for the up-leg wind profile.
Fig. 6. Wind components for the down-leg wind profile.
shears in the up-leg portion of the flight than in the down-leg portion.
These observations are unusual in the context of the larger set of wind measurements in the lower thermosphere de-scribed by Larsen (2000). The mid-latitude wind measure-ments in that data set in which both up-leg and down-leg trails were deployed is limited to a few dozen cases, but such measurements show generally similar features in the two pro-files. The magnitudes of the winds and shears vary across the distance separating the two trails, but the same general fea-tures are evident in both profiles. A more typical example of the differences expected between the up-leg and down-leg wind profiles is shown by the data from the study by Larsen et al. (2003), for example. Even in sporadic-E conditions, which are expected to be more dynamic, the horizontal gra-dients in the winds and shears have not been as large as those shown here. For example, Wilson (2002) studied the winds from two separate observations made at Wallops Island,
Vir-Fig. 7. Figure shows the shear profiles obtained from the up-leg and down-leg wind profiles.
ginia, during sporadic-E and QP conditions. The observa-tions showed consistency between the up-leg and down-leg wind profiles similar to that observed by Larsen et al. (2003). 2.3 Stability and turbulence
The observations described in the previous sections suggest a highly dynamic environment with significant variability and large gradients in the winds along the flight trajectory. The overall stability, in the dynamical sense, depends on the to-tal shear magnitude, which is shown in Fig. 9. The largest shear magnitudes occur in the up-leg profile between 100 and 110 km. The shears in that altitude range in the down-leg profile show a similar vertical structure but with somewhat smaller magnitudes. The down-leg profile, however, also has very large shear magnitudes, i.e. low stability, between 90 and 100 km.
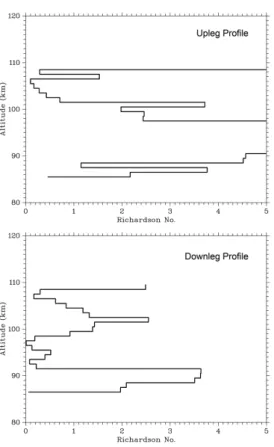
We have calculated the Richardson number profiles for both parts of the flight by using the observed wind shears and the thermodynamic parameters obtained from the MSIS model. There may be significant differences between the ac-tual temperature profiles and the MSIS temperature profiles, as shown in the case study by Bishop et al. (2004), for exam-ple, but the calculated Richardson numbers should at least provide a good indication of the stability of different atmo-spheric layers. The curves show the presence of a region of low stability between 100 and 110 km in both the up-leg and
Fig. 8. Panels show the shear profiles determined from the down-leg portion of the TMA trail.
down-leg profiles. In both profiles the Richardson numbers are less than the critical value of 1/4 in part of the height range. In the down-leg portion of the flight, there are also height ranges with low Richardson numbers between 90 and 100 km altitude.
The apogee of the rocket was 117 km, i.e. just above the altitude range where the layers were located. The trail was deployed in an unusual configuration therefore with a signif-icant horizontal extent in the altitude range of interest. The image shown in Fig. 11 is a view of the up-leg portion of the trail taken from the camera site at Kochi (see Fig. 2). Of par-ticular interest is the wave or billow-like structure evident in the trail. The section with the waves covers the altitude range from approximately 100 to 115 km. Note that the oscillations are evident throughout that height range, but the largest am-plitudes occur in the lowest part of the altitude range, i.e. in the same altitude range where the low Richardson number values are found in the stability analysis of the up-leg wind profile (see Fig. 10). The values obtained from the triangula-tion give a horizontal wavelength for the structure of approx-imately 5 km and a vertical wavelength slightly greater than 2 km. Periodic fluctuations were also observed in the elec-tric fields measured by the rocket that was launched 15 min earlier. Those observations, as well as their relationship to the neutral wind fluctuations, are described in more detail by Pfaff et al. (2005).
Fig. 9. Figure shows the total shear magnitude obtained from the up-leg and down-leg wind profiles.
The same type of structure was not discernible in the im-ages of the down-leg portion of the trail. The down-leg trail above 100 km appeared to be stable with little small-scale structure. The down-leg trail below 100 km showed signs of very strong turbulence with a rapid mixing of the TMA that was released. The strong mixing can be seen in Fig. 12, which shows the lower portion of the down-leg trail seen from the camera site at Uchinoura. This type of structure developed within a few minutes after the trail was deployed, and a few minutes later the trail had diffused so much that it became difficult to identify distinct features in the images obtained from the three sites. Such strong turbulence has not been evident in any earlier experiment to our knowledge. As noted above, the winds and shears were much larger in the down-leg section of the trajectory than in the up-leg, espe-cially below 100 km, i.e. in the altitude range where the very strong mixing was observed.
3 Conclusions
The maximum wind speeds and shear magnitudes observed in the SEEK-2 experiment are comparable to those observed in past experiments (e.g. Larsen et al., 1998; Larsen, 2002), but the horizontal gradients in the flow were unusual when compared with the larger data set of past observations. A
2374 M. F. Larsen et al.: SEEK-2 winds and shears
Fig. 10. Richardson number profiles calculated with the measured winds and estimates of the background thermodynamic parameters obtained from MSIS.
Fig. 11. Image taken from the Kochi camera site showing wave or billow structure in the up-leg portion of the TMA trail.
wave-like structure was observed in the lower thermosphere in the altitude range within and just above the sporadic-E layer. Such structure could be associated with random grav-ity waves propagating through the region, but the collocation of the structures with the region of low Richardson numbers suggest that the oscillations are most likely billows gener-ated by the shear instability. The images also suggest that the amplitude of the oscillations decreases rapidly with alti-tude above the heights with strong shears and low Richard-son numbers, which would be consistent with the behavior expected for a shear-instability structure. Ionosonde
mea-Fig. 12. Image showing the lower part of the down-leg portion of the TMA trail taken from the camera site at Uchinoura.
surements prior to and during the event (Maruyama et al., 2005) showed that fluctuations in the electron densities in the sporadic-E layer were present for approximately 50 min before the onset of the QP echoes. There is no direct evi-dence of a direct relationship between those fluctuations and the wave-like oscillations evident in the TMA trail, but the structure in the trail indicates that fluctuations were present in the neutral winds around the time of the experiment.
The same type of structure was not evident in the images of the down-leg portion of the trail, but the velocity profile had larger shears and low Richardson numbers over a broader altitude range in that part of the trajectory. The down-leg portion of the trail showed evidence of very strong mixing, especially in the lower part of the trail. Shear instabilities would initially generate quasi-periodic billow structure, but that eventually leads to a well-mixed layer as the unstable region re-stabilizes. The observations suggest that the down-leg region had a more developed instability while the up-down-leg region had an instability in an earlier phase of its develop-ment.
The sporadic-E and QP event studied in SEEK-2 was un-usual in that the event was very strong but developed from relatively quiescent conditions. In other studies (e.g. Hysell and Burcham, 2000; Hysell et al., 2004) most nights were characterized by activity that changed in strength and charac-teristics but was present through much of the night. In SEEK-2, not only did the event develop very rapidly in a fairly un-usual way, but the observed winds were also unun-usual in the sense that there were much larger horizontal gradients in the winds and much stronger turbulent mixing than observed in past experiments.
The role of neutral shear instabilities in seeding the pro-cesses that lead to the QP echo structures is still not clear, but the results presented here, as well as those from earlier stud-ies cited above, suggest that such instabilitstud-ies are a ubiqui-tous component of the electrodynamic environment in which sporadic-E layers and QP echoes occur.
Acknowledgements. MFL was partially supported by NASA grants
NAG5-5378 and NAG5-5372 and NSF grant ATM-0003168. MFL also gratefully acknowledges the support provided by Kyoto Uni-versity and ISAS in connection with the launches and operations associated with the TMA payload. The SEEK-2 rocket experi-ment was supported and conducted by ISAS/JAXA. This study was partly supported by a Grants-in-aid for Scientific Research B (2) (14340145) by the Ministry of Education, Culture, Sports, Sci-ence and Technology (MEXT), Japan. We express sincere thanks to Nishinoomote City, Takazaki Town, and Kochi-Prefecture Hata Youth-House for providing us with locations for cameras.
Topical Editor M. Pinnock thanks two referees for their help in evaluating this paper.
References
Bishop, R. L., Larsen, M. F., Hecht, J. H., Liu, A. Z., and Gardner, C. S.: TOMEX: Mesospheric and lower thermospheric diffusivi-ties and instability layers, J. Geophys. Res., 109, 2004.
Fukao, S., Yamamoto, M., Tsunoda, R. T., Hayakawa, H., and Mukai, T.: The SEEK (Sporadic-E Experiment over Kyushu) campaign, Geophys. Res. Lett., 25, 1761–1764, 1998.
Hysell, D. L. and Burcham, J.: The 30 MHz radar interferometer studies of midlatitude E region irregularities, J. Geophys. Res., 105, 12 797, 2000.
Hysell, D. L., Larsen, M. F., and Zhou, Q. H.: Common volume co-herent and incoco-herent scatter radar observations of mid-latitude sporadic-E-layers and QP echoes, Ann. Geophys., 22, 3277– 3290, 2004,
SRef-ID: 1432-0576/ag/2004-22-3277.
Kagan, L. M.: Effects of neutral gas motions on midlatitude E re-gion irregular structure, J. Atmos. Solar-Terr. Phys., 64, 1479– 1486, 2002.
Larsen, M. F.: A shear instability seeding mechanism for quasiperi-odic radar echoes, J. Geophys. Res., 105, 24 931–24 940, 2000. Larsen, M. F.: Winds and shears in the mesosphere and lower
ther-mosphere: Results from four decades of chemical release wind measurements, J. Geophys. Res., 107, 1215–, 2002.
Larsen, M. F., Fukao, S., Yamamoto, M., Tsunoda, R., Igarashi, K., and Yamamoto, M.: The SEEK chemical release experiment: Observed neutral wind profile in a region of sporadic-E, Geo-phys. Res. Lett., 25, 1789–1792, 1998.
Larsen, M. F., Liu, A. Z., Bishop, R. L., and Hecht, J. H.: TOMEX: A comparison of lidar and sounding rocket chemical tracer wind measurements, Geophys. Res. Lett., 30, 1375, 2003.
Larsen, M. F., Liu, A. Z., Gardner, C. S., Kelley, M. C., Collins, S. C., Friedman, J., and Hecht, J. H.: Observations of overturning in the upper mesosphere and lower thermosphere, J. Geophys. Res., 109, 2004.
Maruyama, T., Saito, S., Yamamoto, M., and Fukao, S.: Simulta-neous observation of sporadic-E with a rapid-run ionosonde and coherent VHF radar during SEEK-2, Ann. Geophys., accepted, 2005.
Pfaff, R., Freudenreich, H., Yokoyama, T., Yamamoto, M., Fukao, S., and Mori, H.: Electric field measurements of DC and long wavelength structures associated with sporadic-E layers and QP radar echoes, Ann. Geophys., 23, 2319–2334, 2005.
Riggin, D., Swartz, W. E., Providakes, J., and Farley, D. T.: Radar studies of long-wavelength waves associated with mid-latitude sporadic-E layers, J. Geophys. Res., 91, 8011–8024, 1986. Saito, S., Yamamoto, M., Fukao, S., Marumoto, M., and Tsunoda,
R. T.: Radar observations of field-aligned plasma irregularities in the SEEK-2 campaign, Ann. Geophys., 23, 2307–2318, 2005. Tsunoda, R. T., Cosgrove, R. B., and Ogawa, T.: Azimuth-dependent Es layer instability: A missing link found, J. Geophys. Res., 109, 2004.
Wakabayashi, M., Ono, T., Mori, T., and Bernhardt, P. A.: Electron density and plasma waves measurement in mid-latitude
sporadic-Elayer observed during the SEEK-2 campaign, Ann. Geophys., 23, 2335–2345, 2005.
Whitehead, J. D.: Production and prediction of sporadic-E, Rev. Geophys. Space Phys., 8, 65–144, 1970.
Wilson, R.: Ph. D. Thesis, Clemson University, 2001.
Yamamoto, M., Fukao, S., Woodman, R. F., Ogawa, T., Tsuda, T., and Kato, S.: Midlatitude E region field-aligned irregularities ob-served with the MU radar, J. Geophys. Res., 96, 15 943–15 949, 1991.
Yamamoto, M., Fukao, S., Ogawa, T., Tsuda, T., and Kato, S.: A morphological study on midlatitude E-region field-aligned irreg-ularities with the MU radar, J. Atmos. Terr. Phys., 54, 769–777, 1992.
Yamamoto, M., Fukao, S., Tsunoda, R. T., and Hayakawa, H.: SEEK-2 (Sporadic-E Experiment over Kyushu II) – Project out-line and significance, Ann. Geophys., 23, 2295–2305, 2005. Yokoyama, T., Horinouchi, T., Yamamoto, M., and Fukao, S.:
Mod-ulation of the midlatitude ionospheric E region by atmospheric gravity waves through polarization electric fields, J. Geophys. Res., 109, 2004a.
Yokoyama, T., Yamamoto, M., Fukao, S., and Cosgrove, R. B.: Three-dimensional simulation on generation of polarization elec-tric field in midlatitude E-region ionosphere, J. Geophys. Res., 109, 2004b.
Yokoyama, T., Yamamoto, M., and Fukao, S.: Numerical simula-tion of midlatitude ionospheric E region based on the SEEK and the SEEK-2 observations, Ann. Geophys., 23, 2377–2384, 2005.