HAL Id: insu-01267172
https://hal-insu.archives-ouvertes.fr/insu-01267172
Submitted on 4 Feb 2016
HAL is a multi-disciplinary open access
archive for the deposit and dissemination of sci-entific research documents, whether they are pub-lished or not. The documents may come from teaching and research institutions in France or abroad, or from public or private research centers.
L’archive ouverte pluridisciplinaire HAL, est destinée au dépôt et à la diffusion de documents scientifiques de niveau recherche, publiés ou non, émanant des établissements d’enseignement et de recherche français ou étrangers, des laboratoires publics ou privés.
The volcaniclastic series from the luang prabang basin,
Laos: A witness of a triassic magmatic arc?
Camille Rossignol, Sylvie Bourquin, Marc Poujol, Erwan Hallot, Marie-Pierre
Dabard, Thierry Nalpas
To cite this version:
Camille Rossignol, Sylvie Bourquin, Marc Poujol, Erwan Hallot, Marie-Pierre Dabard, et al.. The volcaniclastic series from the luang prabang basin, Laos: A witness of a triassic magmatic arc?. Journal of Asian Earth Sciences, Elsevier, 2016, 120, pp.159-183. �10.1016/j.jseaes.2016.02.001�. �insu-01267172�
THE VOLCANICLASTIC SERIES FROM THE LUANG PRABANG
BASIN, LAOS: A WITNESS OF A TRIASSIC MAGMATIC ARC?
Camille Rossignola,b,*, Sylvie Bourquina, Marc Poujola, Erwan Hallota, Marie-Pierre
Dabarda, Thierry Nalpasa.
aGéosciences Rennes, UMR CNRS 6118, Université de Rennes 1, OSUR, Campus de Beaulieu,
263 Avenue Leclerc, 35042 Rennes Cedex, France
bGéoHydrosystèmes Continentaux, EA 6293, Université François Rabelais, Tours, Campus
de Grandmont, 30 Avenue Monge, 37200 Tours, France [email protected] [email protected] [email protected] [email protected] [email protected] [email protected]
*Corresponding author: Camille ROSSIGNOL
Géosciences Rennes, UMR CNRS 6118, Université de Rennes 1, OSUR, Campus de Beaulieu, 35042 Rennes Cedex, France
Tel.: +33 2 23 23 64 29 / +33 2 47 36 70 05 Email: [email protected]
Abstract
The paleogeographic evolution of South East Asia (SEA) during the early Mesozoic is still poorly understood and a number of models have recently been put forward to account for the geodynamic evolution of SEA. The Luang Prabang Basin (north Laos), located in the core of a “paleogeographic jigsaw” in SEA, recorded a long lasting volcanism that spanned for ~ 35 my from the earliest Triassic up to Late Triassic as evidenced by combined stratigraphic and geochronological (U-Pb/zircon) analyses performed on both volcanic and volcaniclastic series. The volcanic rocks are arc tholeiites and calk-alkaline andesites to dacites. The volcaniclastic rocks contain, in part, volcaniclasts produced contemporaneously with sedimentation. Both the volcanic and volcaniclastic series display geochemical features characteristic of a subduction related volcanism. Therefore, the Luang Prabang Basin documents a magmatic arc in a good agreement with the recent recognition of neighboring ophiolitic rocks in the Luang Prabang area. Following a passive margin setting that prevailed from the late Carboniferous to the late Permian, an active margin then initiated along the western margin of the Indochina Block. This active magmatic arc developed as the result of an east-dipping subduction below the Indochina Block during most of the Triassic, at least from ca. 250 to 215 Ma. Subsequently, this oceanic subduction episode must have been followed by a continental collision of the Indochina Block with the eastern Simao Block, at a period that remains to be defined.
Keywords
Indochina Simao
Nan Uttaradit Suture Paleotethys
Volcaniclastic sediments Triassic
1. Introduction
The present day South East Asia (SEA) largely results from collisions between several continental blocks (e.g., the Sibumasu, Simao, Indochina and South China blocks, Fig. 1A) and volcanic arcs (e.g., Sukhothai arc, Fig. 1A) during the Triassic and Jurassic periods (e.g., Barr et al., 2006; Mitchell et al., 2012; Peng T. et al., 2013; Zaw et al., 2014; Burrett et al., 2014; Lai C.-K. et al., 2014a and references therein). The exact number of continental fragments and volcanic arcs that actually compose SEA, as well as the timing of their amalgamation, are still controversial and a number of geodynamic models have been proposed to account for the tectonic evolution of the east Tethyan domain (e.g., Ridd, 1971; Burrett, 1974; Sengör, 1979; Mitchell, 1981; Helmcke, 1985; Metcalfe, 1988, 2002; Lepvrier et al., 2004; Ferrari et al., 2008; Carter and Clift, 2008; Cai J.-X. and Zhang K.-J., 2009; Metcalfe, 2011; Liu J. et al., 2012; Cocks and Torsvik, 2013; Lai C.-K. et al., 2014b; Qian X. et al., 2015a). Corollary to these uncertainties about the geodynamic evolution of SEA from the late Paleozoic to the early Mesozoic, the spatial configuration (i.e., the shape) of the blocks that compose the east Tethyan domain and the nature of their boundaries are not precisely known (e.g., Heppe et al., 2007; Wang Q. et al., 2014).
Despite the fact that the Simao Block encompasses a relatively large geographic area with a triangular shape in south China (western Yunnan) and northern Laos (Fig. 1A), its paleogeographic affinity is poorly constrained. This block was initially recognized by Wu H. et al. (1995), and is sometimes considered as an independent continental block prior to the Late Triassic (e.g., Wu H. et al., 1995; Metcalfe, 2002; Wakita and Metcalfe, 2005). For instance, Kamvong et al. (2014) suggested that the Simao plate was independent before it collided with, and was integrated into, the eastern Indochina Block during the late Carboniferous. Contradictorily with the existence of this independent plate, the Simao Block is sometimes considered as belonging to the Indochina Block (e.g., Ferrari et al., 2008; Wang Q. et al., 2014), while Sone and Metcalfe (2008) considered it as a “semi-detached portion” of the Indochina Block. Another hypothesis by Barr et al. (2006), reasserted by Qian X. et al. (2015a), postulates that the Simao Block was part of a larger continental unit (called the Sukhothai Block by Barr et al., 2006) that includes both the Simao and the Sukhothai blocks, as depicted on Fig. 1A.
Central to the question of the paleogeographic affinity of the Simao Block is the actual nature of the mafic rocks cropping out along the Dien Bien Phu Fault (DBPF; Fig. 1B), in the vicinity of which are located the possible eastern and western margins of the Simao and Indochina blocks, respectively. Indeed, the estimated cumulated dextral offset along the Dien Bien Phu Fault (ca. 40 km, Roger et al., 2014) is largely insufficient to explain the occurrence of mafic rocks along the fault by a simple transposition from the Ailaoshan Suture to the NW and/or from the Nan Uttaradit Suture Zone to the SE (i.e., the line approximately located in between the cities of Nan and Uttaradit, Fig. 1B). Therefore, some of the mafic rocks cropping out along the Dien Bien Phu Fault could correspond to a suture zone, which was previously called “Nan Uttaradit – Luang
Prabang” and “Nan Uttaradit Luang Prabang Dien Bien Phu” by Hutchison (1975) and Wu H. et al. (1995), respectively. However, this potential suture zone did not receive the attention it deserves until recently, as Qian X. et al. (2015a) studied some mafic rocks cropping out ca. 35 km to the northeast of Luang Prabang. Their investigations lead them to infer a back-arc setting in northwest Laos during the late Carboniferous.
Some other mafic and felsic volcanic and volcaniclastic rocks have been documented in the Luang Prabang Basin (e.g., Bercovici et al., 2012; Blanchard et al., 2013, Fig. 2). However, the geodynamical significance of these rocks, as well as their relationships with the mafic rocks described by Qian X. et al. (2015a) as representative of late Carboniferous back-arc basins, are unknown, thus motivating the present work. Based on a petro-geochemical and geochronological study of the volcanic and volcaniclastic rocks from the Luang Prabang Basin, and a comparison of the results with those from Qian X. et al. (2015a), a geodynamical model for the northeast Indochina Block during the Triassic is proposed.
2. Geological setting
2.1. Regional setting
The blocks that compose the present-day SEA are delimited by proven (ophiolitic) or inferred suture zones (Fig. 1), corresponding to former continental plate boundaries. Some of these suture zones were reactivated and/or offset by Cenozoic shear zones such as the Dien Bien Phu Fault (Roger et al., 2014), the Mae Ping Fault (e.g., Ridd, 2012) or the Red River Fault (e.g., Faure et al., 2014).
The Simao Block (as depicted on Fig. 1A) is surrounded by a number of suture zones, some of which are poorly known and/or controversial. To the northeast, the Simao Block is separated from the South China Block by the Ailaoshan Suture (Fig. 1B), which is marked by the occurrence of N-MORB and plagiogranite Devonian to early Carboniferous in age (Jian P. et al., 2009a, b; Lai C.-K. et al., 2014a). The closure of the corresponding oceanic domain occurred during the late Permian to the Early Triassic (Jian P. et al., 2009a, b; Lai C.-K. et al., 2014a, b; Liu H. et al., 2014).
To the southeast, the Simao Block is delimited by the debated “Luang Prabang Suture” (Fig. 1B), commonly described as a part of a larger “Nan Uttaradit Luang Prabang Dien Bien Phu” Suture Zone (Hutchison, 1975; Wu H. et al., 1995). The existence of the Luang Prabang Suture was recently backed up by some new results from Qian X. et al. (2015a) who reported the occurrence of late Carboniferous dolerite (335.5 ± 3.3 Ma, U-Pb/zircon) with an E-MORB signature and pillow-lava basalt (304.9 ± 3.9 Ma, U-Pb/zircon) with a N-MORB affinity, ca. 35 km to the northeast of the city of Luang Prabang (Fig. 1B). This work evidences the presence of an oceanic (or oceanic-like) domain in the vicinity of Luang-Prabang during the late Carboniferous. However the timing of its closure and subsequent collision remain unknown.
West of the city of Simao, mafic rocks with an enriched to transitional MORB affinity, and inferred to represent the remnant of another early Permian oceanic paleolithosphere, have been reported in the Jinghong area (Hennig et al., 2009; Li G. et al., 2012; Fig. 1). However, these mafic rocks have also been interpreted as a component of a bimodal, late orogenic magmatic event (Heppe et al., 2007). Further studies are required to demonstrate that the Jinghong area really corresponds to a suture.
Westward, the Simao Block (or a larger block including the Simao area) is possibly delimited by the less controversial Changning Menglian Suture Zone (e.g., Wu
H. et al., 1995, Fig. 1). Indeed, the Changning Menglian Suture delineates the paleobiogeographic limit between the Gondwanian and the Cathaysian provinces (Wu H. et al., 1995; see also Zhang K.-J., 1998 and Wu H. et al., 1998). In addition, it contains early Permian blueschists (Zhang R.Y. et al., 1993; Heppe et al., 2007), dismembered ophiolitic complexes (Wu H. et al., 1995) limiting the Sibumasu Block to the west from an eastern block encompassing the Simao area. As a paleobiogeographic divide, this suture zone is also commonly accepted as representing remnants of the “main branch” of the Paleotethys ocean (e.g., Sone and Metcalfe, 2008). In the area, the Changning Menglian accretionary complex is unconformably overlain by unmetamorphosed Middle Jurassic molassic sediments (Zhang R.Y. et al., 1993), which were possibly deposited after a collision, even though the precise age of these molassic sediments is poorly constrained.
In addition to the suture zones delimiting the Simao Block (as depicted on Fig. 1A or as originally defined by Wu H. et al., 1995), numerous other suture zones have been described in SEA. The Indochina and the South China blocks are delimited by the Song Ma Suture (Fig. 1), represented by a ribbon of ultramafic and mafic rocks displaying a MORB affinity. As for the Ailaoshan Suture, these rocks are Devonian to Carboniferous in age (e.g., Trung et al., 2006; Vuong et al., 2013; Zhang R.Y. et al., 2013, 2014). However here, the timing of the oceanic closure and subsequent collision between the South China and the Indochina blocks is controversial. Carter and Clift (2008) argue for a collision during the Silurian while Liu J. et al. (2012) postulate that the collision took place during the Late Triassic. Various intermediate ages have also been proposed (i.e., early Carboniferous, Metcalfe, 2011; late Permian, Halpin et al., 2015; Early Triassic, Lepvrier et al., 2008; Kamvong et al., 2014, and Middle Triassic, Zhang R.Y. et al., 2013;
Faure et al., 2014). Recent investigations (Zhang R.Y. et al., 2013; Faure et al., 2014 and references therein) evidenced a high-pressure, low-temperature metamorphic event during the Middle Triassic (Fig. 1B), which is interpreted as the result of the collision between the South China and Indochina blocks, following a south- (e.g., Zhang R.Y. et al., 2013; Faure et al., 2014) or a north- (e.g., Nakano et al., 2010) dipping subduction.
To the south, the Nan Uttaradit Suture (Fig. 1) marks the western limit of the Indochina Block. It consists of ultramafic and mafic rocks displaying a supra-subduction zone affinity (Orberger et al., 1995) and high-grade metasedimentary rocks (blueschist facies, Barr and Macdonald, 1987). These mafic rocks are late Carboniferous in age (U-Pb/zircon dates of 311 ± 10 Ma and 316 ± 3 Ma obtained on a gabbro and a meta-basalt, respectively, and interpreted as their emplacement age, Yang W. et al., accepted). This suture zone also includes cherts containing early Permian to Middle Triassic (Anisian) radiolarian fauna (Ueno and Hisada, 2001; Saesaengseerung et al., 2008). There is a general consensus about the ophiolitic nature of the Nan Uttaradit Suture Zone, although the age of the oceanic closure (e.g., middle Permian; Hirsch et al., 2006; late Permian; Metcalfe, 2011, Early Triassic; Lepvrier et al., 2004; Middle Triassic; Salam et al., 2014 or Late Triassic; Kamvong et al., 2014) and its extension to the north are still controversial (Fig.1).
Westward, the Inthanon Suture Zone (Fig. 1), also called the “Chiang Rai tectonic line cryptic suture” (e.g., Ridd, 2014), has been proposed to represent the limit between the Sibumasu and the Sukhothai blocks (e.g., Sone and Metcalfe, 2008; Ridd, 2014). To the west of the “Chiang Rai tectonic line cryptic suture”, the Inthanon Zone corresponds to the Paleotethys ocean floor material, including seamounts with carbonate caps. This zone is interpreted as an extensive accretionary complex (e.g., Sone and Metcalfe, 2008). Alternatively, the boundary between the Sibumasu and the Sukhothai blocks is possibly
located further to the west along the Mae Yuam Fault (Fig. 1B), which is considered by Ferrari et al. (2008) as a reactivated suture zone. Indeed the fault also corresponds to the boundary between the Gondwanian and Cathaysian paleobiogeographic provinces (e.g., Ueno and Hisada, 2001). Nevertheless, giving support to the hypothesis of a suture along the Inthanon line, the occurrence of Cathaysian fauna in between the Inthanon line and the Mae Yuam Fault has been interpreted as the result of a westward thrusting of the Sukhothai Block, thus standing in an allochthonous position above the Sibumasu Block (Ridd, 2014).
In addition to the aforementioned sutures, some other structures, sometimes including ultramafic and/or mafic rocks have been reported in SEA. Among these, there is the Loei Suture, located to the west of Vientiane (Fig. 1B). When considered as a real suture, most authors propose that it was closed before the late Permian (Boonsoong et al., 2011; Qian X. et al., 2015b). Ultramafic rocks including peridotite and serpentinite of uncertain age are also reported ca. 50 km to the east of the Luang Prabang Basin (Geological map of Laos, 1990; Fig. 1B) but to our knowledge, these rocks have never been described nor characterized.
Several hypotheses concerning the lateral extension of the ophiolitic segments (dashed lines on Fig. 1) have been proposed in order to correlate assorted ophiolitic segments together and to localize the block boundaries (circled numbers, Fig. 1B). Particularly, the continuity of the Inthanon and Nan Uttaradit sutures toward the north have been hindered by the paucity of data in the concerned areas of Myanmar and Laos. Therefore, depending on the authors, the Inthanon Suture may correlate either with the Changning Menglian Suture (1, Fig. 1B), based on comparisons of the stratigraphic sequences (Sone and Metcalfe, 2008), or with the Jinghong Suture (2, Fig. 1B), based on
correlations of the interbedded volcanic series (Barr et al., 2006) or from general tectonic and stratigraphic considerations (Ridd, 2014).
Similarly, and relying on stratigraphic considerations, Sone and Metcalfe (2008) correlate the Nan Uttaradit Suture with the Jinghong Suture (3, Fig. 1B) while Feng Q. et al. (2005) correlate it with the Ailaoshan Suture (4, Fig. 1B). Barr et al. (2006) reached a similar conclusion as Feng Q. et al. (2005), derived from the comparison of volcanic series in northern Thailand and Yunnan. In this case, the Dien Bien Phu Fault possibly overprints a potential suture trace (4, Fig. 1B) that is referred to as the “Nan Uttaradit– Luang Prabang Suture” (Hutchison, 1975), because the estimated dextral offset along this fault (ca. 40 km, Roger et al., 2014) is largely insufficient to account for the offset of the Ailaoshan Suture up to the Nan Uttaradit Suture. The existence of the Luang Prabang Suture recently received some support from the description of mafic rocks displaying a N-MORB affinity along the Dien Bien Phu Fault, ca. 35 km to the northeast of Luang Prabang (Qian X. et al., 2015a, Fig. 1).
In addition to the uncertainties on the exact positions of the limits of the blocks, there are also contrasted opinions on the timing of the subductions and subsequent collisions that are inferred along these different suture zones. The east Tethyan domain comprises a large number of Permian to Lower Jurassic magmatic rocks (Fig. 1B), among which calk-alkaline volcanic and plutonic rocks are predominant. Depending on the interpretations deduced from these rocks, different timings might be discussed. Notably, the rocks belonging to the (high-K) calk-alkaline suites are subjected to different and somewhat contradictory interpretations. Indeed, the same rocks can be interpreted as emplaced either in a subduction or in a late orogenic setting. For instance, Barr et al. (2006) interpreted the calk-alkaline volcanic rocks cropping out between the
Nan-Uttaradit and the Inthanon sutures as subduction related, while Srichan et al. (2009), using the coeval occurrence of continental sedimentation, postulated a post-collisional setting for the same calk-alkaline volcanism. Elsewhere, the stratigraphic position of the magmatic rocks with respect to the regional unconformities has also been used to discuss the tectonic settings (e.g., Wang Y. et al., 2010; Peng T. et al., 2013; Liu H. et al., 2014; Wang B. et al., 2014). Nevertheless, the ages of the unconformities are often poorly constrained in SEA. Two to three major regional unconformities are known in northern Thailand (Stokes et al., 1996; Lovatt Smith and Stokes, 1997; Racey, 2009) and Yunnan (Feng et al., 2005) during the upper Permian to the Middle Triassic, the Upper Triassic and the Lower to Middle Jurassic.
2.2. Geological outline of the Luang Prabang Basin
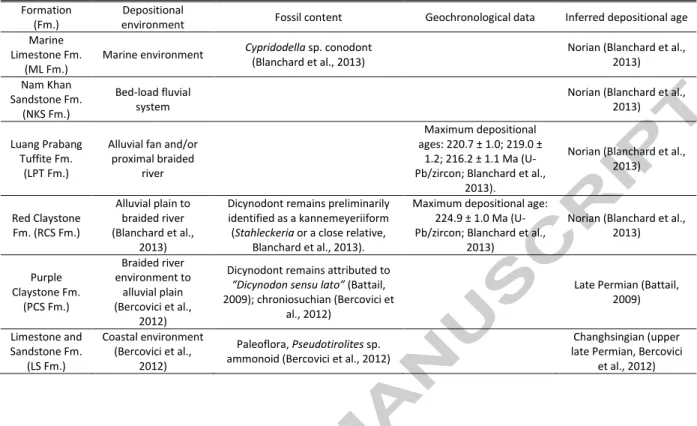
The Luang Prabang Basin, originally studied by Counillon (1896, see also Steyer, 2009 and references therein), has been recently investigated for depositional environments (Bercovici et al., 2012; Blanchard et al., 2013), geochronology (Blanchard et al., 2013) and paleontological remains (flora: Bercovici et al., 2012; and fauna: Battail, 2009; Blanchard et al., 2013). A brief outline of these recent results is provided in Table 1.
Structurally, the Luang Prabang Basin (Fig. 2) consists of an asymmetric NE-SW syncline (Blanchard et al., 2013) with a major thrust, possibly superimposed to an unconformity, separating the Purple Claystone (PCS) Formation and the Limestone and Sandstone (LS) Formation to the north from the Red Claystone (RCS) Formation to the south. Internal southeast verging thrusts are documented within the PCS and the LS formations (fms.) and the stratigraphic relationship between these formations is unclear (Fig. 2A; Blanchard et al., 2013). Two hypothesis were kept open by Bercovici et al.
(2012) and Blanchard et al. (2013): either the PCS Formation (Fm.) is stratigraphically below the LS Fm., or the LS Fm. is stratigraphically overlain by the PCS Fm. (Fig. 2C).
Southward, the Mafic Rocks Unit (MRU), of unknown age, is composed of volcaniclastic rocks and basaltic pillow-lava flows (Blanchard et al., 2013) that were sampled for this work. The MRU is separated from the RCS Fm. to the north by an inferred fault (Fig. 2A, B) and to the south by a reverse fault that constitutes the basal contact of the Luang Prabang nappe (Bush et al., 1996). This nappe, over-thrusting the basin, is composed of polygenic conglomerates including volcanic boulders. Volcanic boulders and volcaniclastic rocks from the Luang Prabang nappe and from the PCS, the RCS and the Luang Prabang Tuffite (LPT) fms. were also sampled for this study to complement those from Blanchard et al. (2013).
3. Methodology
3.1. Geochemistry
Major and trace element analyses were performed on 18 samples, including 4 volcanic and 8 volcaniclastic samples from the MRU along with 2 boulders of volcanic rocks and 4 volcaniclastic samples from the RCS and the LPT fms. The samples were first crushed in a steel jaw crusher, then separated in two aliquots and grounded in a tungsten or in an agate mill, for major and trace elements analyzes, respectively. The analyses were performed at the SARM laboratory, (CRPG-CNRS, Nancy, France) following the procedure described by Carignan et al. (2001). The powders were digested using lithium metaborate (LiBO2) fusion and acid dissolution techniques prior to analyses by Inductively Coupled Plasma – Atomic Emission Spectrometry (ICP-AES) for major
elements and Sc and by Inductively Coupled Plasma – Mass Spectrometry (ICP-MS) for trace elements. Loss On Ignition (LOI) was determined by heating 1g of sample at 1000°C and reweighing. Detection limits and analytical uncertainties are given in the Appendix 1.
The composition of magmatic (e.g., Pearce and Cann, 1973) and sedimentary (e.g., Roser and Korsch, 1986) rocks depends upon their tectonic setting, which can be assessed using discrimination diagrams. Discrimination diagrams used in the present study have been established by Verma and Verma (2013) for intermediate magmatic rocks (52% < SiO2(adj) ≤ 63%), by Verma et al. (2013) for acid magmatic rocks (SiO2(adj) > 63%) and by Verma and Armstrong-Altrin (2013) for volcaniclastic rocks. The subscript “adj” refers to an adjustment of the major element contents to 100% on an anhydrous basis for both magmatic and sedimentary rocks, and using the standard Fe oxidation ratios proposed by Middlemost (1989) for magmatic rocks. The diagrams dedicated to intermediate (Verma and Verma, 2013) and acid (Verma et al., 2013) magmatic rocks are based on discriminant functions using natural logarithm ratios of reputedly relatively immobile trace elements (Yb, La, Ce, Sm, Nb, Th, Y and Zr). The diagrams dedicated to sedimentary rocks (Verma and Armstrong-Altrin, 2013) are established on a similar approach, but use ratios of major elements including the total iron in the form Fe2O3t(adj) instead of the trace elements. Calculation of the probabilities for a given sets of samples to belong to a given field in these discrimination diagrams were carried out following the methodology described by Verma and Verma (2013). According to these authors, the classification performances of the discrimination diagrams were found relatively unaffected by large (± 20% for magmatic rocks and ± 40% for sedimentary rocks, respectively) post emplacement compositional changes (e.g., by weathering) making these diagrams of particular interest for weathered rocks.
All these diagrams allow the discrimination of the following tectonic settings: island arc, continental arc (or undifferentiated arc setting in the diagrams for sedimentary rocks), continental rift together with oceanic island (within plate) and collision. The late orogenic setting is absent from these diagrams. As magmatic suites in late orogenic settings may resemble those encountered in subduction related environments, the method is not able to discriminate a late orogenic setting from an arc setting.
3.2. U-Pb geochronology
3.2.1. Analytical methods
Zircon grains were extracted following a classical mineral separation procedure (e.g., Poujol and Anhaeusser, 2001). Heavy minerals from <250 μm grain size fraction were successively concentrated using a Wilfey table, a Frantz isodynamic magnetic separator and funnel separation in heavy liquids (bromoform then methylene iodide). Zircon grains were then handpicked under a binocular microscope to produce the most representative sampling, with the aim to avoid intentional bias (but see Sláma and Košler, 2012 and Malusà et al., 2013 and references enclosed in these papers). After embedding the grains in an epoxy resin, the pucks were hand grounded to reveal equatorial cross sections. Laser microsampling sites were chosen based on cathodoluminescence (CL) imaging using a Reliotron CL system equipped with a digital color camera.
To conduct in situ isotopic analyses, samples were ablated using an ESI NWR193UC Excimer laser system connected to an Agilent 7700x quadrupole ICP-MS
instrument located at the Géosciences Rennes laboratory. Detailed operating and instrumental conditions can be found in Ballouard et al. (2015). During the course of the
analyses, the signals of 204(Pb+Hg), 206Pb, 207Pb, 208Pb, and 238U masses were acquired.
No common Pb correction was applied. The 235U signal was calculated from 238U using
the ratio 235U/238U = 137.88. Laser spot diameters of 25 to 40 μm with repetition rates of
3-4 Hz were used for ablation. Every ten unknown analyses were bracketed by two measurements of primary GJ-1 standard (Jackson et al., 2004), followed by one measurement of secondary 91500 standard (Wiedenbeck et al., 1995), to correct for mass fractionation and bias and to control data reproducibility, respectively (Appendix 2).
3.2.2. Data filtering, maximum age calculations and detection limits
A two-step procedure has been applied to derive maximum depositional ages from the volcaniclastic samples. The first step consisted in filtering the data based on their probability of concordance (Ludwig, 1998; Nemchin and Cawood, 2005), calculated using the relevant function in Isoplot/Ex 3.00 (Ludwig, 2012). Decay constant errors were included in this calculation. The use of the probability of concordance instead of
the classical percent of concordance (defined as the percent ratio of the 206Pb/238U
versus the 207Pb/206Pb or 207Pb/235U ages) allows to take into account the errors linked
to each analysis. It also avoids variable age difference for grains of different ages at a given level of percent of concordance (e.g., 90% of concordance means that the
206Pb/238U and 207Pb/206Pb ages for a 2.0 Ga grain differ by 200 Ma while the difference
is only 2 Ma for a 20 Ma grain). Additionally, the use of a percent of concordance may be
degrees of concordance, for young ages. The use of the probability of concordance appears thus to be more convenient to filter the data regarding the drawbacks of percent concordance. The cut-off level applied to filter the data was 10%.
Data having a probability of concordance ≥ 10% were kept for the second step that consisted in calculating the maximum depositional age using the youngest cluster of at least 3 analyses from 3 different grains overlapping in age at 2σ (standard deviation) as proposed by Dickinson and Gehrels (2009) to ensure a statistically robust estimate of the maximum depositional ages. Maximum depositional ages were calculated as the concordia age (Ludwig, 1998) of these youngest clusters using Isoplot/Ex 3.00 (Ludwig, 2012) and are provided with 95% confidence limits. The MSWD (mean square of weighted deviates) and probabilities associated with the calculation of concordia ages refer both to the concordance and the equivalence of the chosen populations (Ludwig, 1998), unless otherwise mentioned. Errors on calculated ages take into account decay constant errors.
The ages of the volcanic samples have been calculated using the Tuff Zirc algorithm (Ludwig and Mundill, 2002) to minimize the effects of Pb loss. The algorithm isolates the largest cluster of analyses having a probability of fit in age at a higher value than 0.05 and calculates the median age of this cluster. The uncertainties (asymmetric) are provided with a 95% confidence limit.
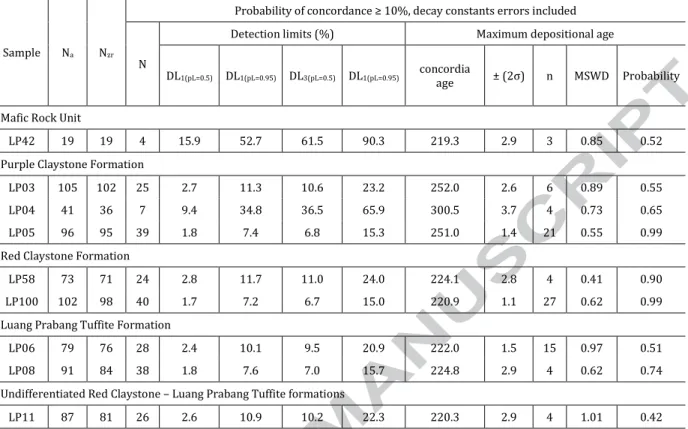
To assess whether the filtered data set for each volcaniclastic sample is representative, the detection limits (i.e., the relative proportions, expressed as the percentages of the largest population of zircon grains that are likely to remain undetected at a given confidence level; Andersen, 2005) are provided. Following Andersen (2005), the calculation of the detection limits for a single grain (assuming a random sampling) is given by:
(1)
where is the probability level assigned to the detection limit , and the number of
zircon grains displaying a probability of concordance ≥ 10%. However, as at least 3 grains are required to define a maximum depositional age following the criteria of
Dickinson and Gehrels (2009), the threshold value of is implicitly defined by the
following:
(2)
where k ranges between 0 and 2 to subtract, to the total space of probability, the chance to find not any grain (k = 0), only 1 grain (k = 1) and 2 grains (k = 2) belonging to a poorly represented population that would fall below the 3 grains criterion aforementioned.
Developing Eq. (2) we have:
(3)
Eq. (3) cannot be solved analytically but a solution can nevertheless be approximated. A comparison of the detection limits and the maximum depositional ages obtained following the aforementioned procedure with the classical filtering procedure
based on percent of concordance (206Pb/238U versus 207Pb/206Pb ages, cut-off level at 100
± 10%) is given in the Appendix 2.
4. Petrography and geochemistry
We focus here on the petro-geochemistry of the MRU, as well as on volcanic boulders and sediments forming part of the Luang Prabang nappe. The petrography of the
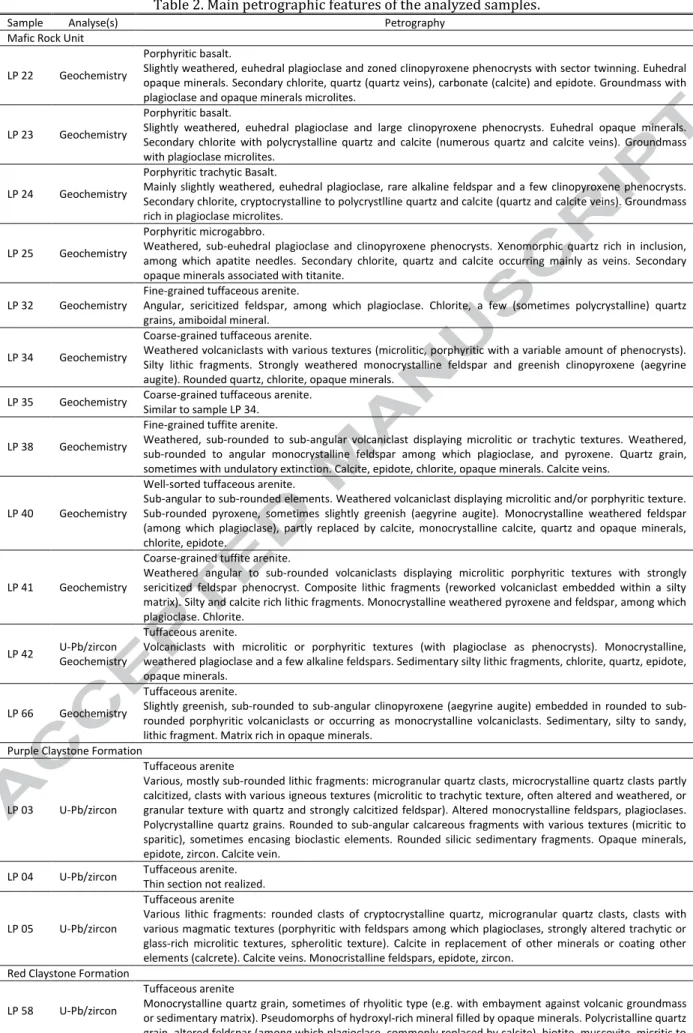
volcaniclastic rocks of the PCS, the RCS and the LPT fms. have already been described in Bercovici et al. (2012) and Blanchard et al. (2013). This work mostly adds geochemical information for the samples from these formations. Petrographic descriptions of all the samples used in this work are provided in Table 2.
The terminology that is used in this work for volcaniclastic rocks partly follows the recommendations of Le Maitre et al. (2002, after Schmid, 1981) for pyroclastic and mixed pyroclastic-epiclastic deposits. However, we choose to use the term “volcaniclast” defined as any rock fragment or individual crystal of volcanic origin independently from any genetic consideration. Indeed, according to Le Maitre et al. (2002), a “pyroclast” is a particle that has not been reworked but, as it is often difficult to distinguish unreworked from reworked volcaniclasts, the strict application of Le Maitre et al. (2002)’s nomenclature is difficult.
4.1. Mafic Rock Unit (MRU)
From south to north, the MRU is composed of basaltic flows showing internal pillow-lavas (Fig. 3A) implying a subaqueous emplacement, massive lava flows (or intrusions) with no internal structure, and volcaniclastic accumulations, the layers of which are rich in mafic volcaniclasts.
4.1.1. Volcanic rocks
The southern basalts (samples LP 22 to LP 24) are porphyritic. They are characterized by plagioclase and zoned clinopyroxene (augite displaying sometimes typical sector twinning; Fig. 3B, C) phenocrysts embedded in a destabilized glassy to microcrolitic groundmass containing plagioclase microcrysts (Fig. 3B) or microlites (Fig. 3C), opaque
mineral and clinopyroxene microcrysts. The samples display secondary cryptocrystaline to polycrystalline quartz veins and scattered xenomorphic spots, up to a millimeter in size, that also include chlorite and carbonate (calcite).
Collected immediately to the north of the basaltic outcrops, sample LP 25 is a porphyritic microgabbro, also mostly constituted by plagioclase, augite and subhedral opaque minerals (Fig. 3D). One difference with the basalts concerns the quartz that is more abundant, and which mostly occurs as monocrystalline xenomorphic crystals containing apatite needle inclusions. This suggests that part of the quartz in this rock is primary. Cross-cutting veins filled up by polycrystalline secondary quartz are also present (Fig. 3D).
The 4 volcanic samples from the MRU (LP 22 to LP 25) have been analyzed for major and trace elements (Appendix 3). These rocks plot as basalt and basaltic andesite in the total alkali versus silica diagram (TAS; Le Maitre et al., 2002), except sample LP 25 that plots as a trachyandesite (Fig. 4A). The basaltic rocks are sub-alkaline (0.08 < Nb/Y < 0.16). The LOI for all samples but for sample LP 25 are however higher than the maximal value recommended for the use of the TAS diagram (i.e., above 2.5 wt.%). Using the classification diagram of Winchester and Floyd (1977), based on the relatively immobile trace elements Nb, Y and TiO2, we obtain consistent results for all the samples that plot as basalt or andesite (Fig. 4B). This suggests that sample LP 25, although slightly more differentiated than the basalts (i.e., richer in silica and primary quartz), has a particular location in the TAS diagram and could have been enriched in alkaline elements during fluid circulation.
The chondrite normalized patterns of Rare Earth Elements (REE) and Y (Fig. 5A) show a moderate REE enrichment with a slight light REE (LREE) fractionation relative to heavy REE (HREE): (La/Yb)N ranges between 1.7 and 2.7 and (Gd/Yb)N ranges between
1.2 and 1.4. The absence of Eu anomaly (Eu/Eu* comprised between 0.96 and 1.03) suggests either that plagioclase was not extracted from the primary magma during differentiation or that the primary magma was oxidizing (Drake and Weill, 1975). Multi-element patterns normalized to primitive mantle show significant negative anomalies for Nb and Ta with respect to neighboring U and La elements (Fig. 5B). These negative anomalies in mafic rocks may result from the partial melting of a mantle peridotite enriched in incompatible elements but depleted in Nb and Ta during selective mantle fertilization by aqueous fluid circulations. Indeed within the mantle, especially above subduction zones, aqueous fluids are likely depleted in Nb and Ta owing to the low solubility of these elements while they can be enriched in the other incompatible elements (e.g., Baier et al., 2008). With the exception of sample LP 25, the rocks also display significant positive Pb and small negative Ti anomalies (Fig. 5B). The latter possibly results from low-pressure fractional crystallization of opaque minerals (e.g., Briqueu et al., 1984), which is consistent with the presence of sub-euhedral opaque minerals in these basalts (Fig. 3D). The origin of the positive Pb anomaly in mafic rocks is more ambiguous because it can be generated either by crustal contamination, or by a secondary fluid circulation (e.g., Le Roex et al., 2003). Other anomalies, notably negative for K and Sr (except for sample LP 25) that are elements known to be highly mobile during alteration processes, will not be discussed any further.
Overall, the geochemical characteristics displayed by the mafic volcanic rocks of the MRU (including the possible intrusive LP 25 sample) are consistent with an arc setting tectonic affinity (Fig. 6) as deduced from discrimination diagrams of Verma and Verma (2013). Indeed, this set of samples presents a relatively high probability (61.3%) to belong to an island arc setting. More classical tectonic discrimination diagrams yield similar and consistent results (Appendix 4).
4.1.2. Volcaniclastic rocks
The volcanoclastic rocks of the MRU are tuffaceous arenites. They display various textures, with grain size ranging from fine- to coarse-grained sand (Fig. 3E, F) and a relatively good sorting. These tuffites are composed of volcaniclastic material, comprising both monocrystalline and rock fragments of volcanic origin, and epiclasts in variable proportion. The volcaniclasts are rounded and weathered basaltic rocks fragments, displaying microlithic to trachytic textures (Fig. 3E) that are sometimes porphyritic with greenish clinopyroxene (aegyrine augite?) and/or plagioclase phenocrysts. Isolated individual greenish clinopyroxene or plagioclase crystals or fragments are also common. Additional particles, of epiclastic origin, include rounded siltstone fragments, rounded quartz grains displaying undulatory extinctions and rare carbonate (calcite) grains. Epidote and opaque minerals are also present as individual grains or within the clasts. The matrix, which represents only a small proportion, is mainly constituted by chlorite and calcite.
Eight tuffaceous arenites have been analyzed for major and trace elements (Appendix 3). The REE and Y chondrite normalized patterns of these volcaniclastic rocks (Fig. 5A) show an overall similarity with those of the basaltic rocks of the MRU, but are slightly more enriched in REE and more fractionated with (La/Yb)N ranging between 2.4 and 5.2. Selected bivariate diagrams using chemical elements that are known to be immobile (Fig. 7) show that the volcaniclastic rocks define trends from a pole constituted by the volcanic rocks of the MRU. These trends reflect the mixing of volcaniclasts with epiclastic particles. They indicate that the tuffaceous arenites of the
MRU partly result from the dismantlement of the basaltic rocks similar to those of the MRU and/or are partly formed by pyroclasts made from similar magma compositions.
Consistently with the derivation of the tuffaceous arenites from the basaltic rocks of the MRU type, for which an island arc tectonic setting was inferred (Fig. 6), a very high probability (98.1%, Fig. 8A) for an arc setting tectonic environment is also obtained for the tuffites when plotted in the tectonic discrimination diagram of Verma and Armstrong-Altrin (2013). The diagram proposed by Roser and Korsch (1986) gives similar results (Appendix 4). Indeed, even if the reliability of this diagram is questionable (e.g., Armstrong-Altrin and Verma, 2005; Ryan and Williams, 2007), the tuffaceous arenites of the MRU all plot, consistently, in the field of the “oceanic island arc margin”.
4.2. Red Claystone (RCS) and the Luang Prabang Tuffite (LPT) formations
4.2.1. Volcanic rocks
The RCS and LPT fms., partly composed of conglomeratic layers, contain rounded felsic volcanic pebbles to boulders, mostly about 10 cm in size but sometimes up to 30 to 50 cm. The sediments embedded within the Luang Prabang nappe are also conglomeratic and include felsic volcanic boulders. As the overall characteristics of the pebbles and boulders from the RCS and LPT fms. and from the Luang Prabang nappe were found to be similar, they are described together in this section. In doing so, we assume that the conglomerates of the Luang Prabang nappe either include boulders from the RCS and/or the LPT fms. or are lateral equivalents of these formations. Note also that, up to now, felsic volcanic rocks are only known as boulders in the Luang Prabang Basin and nappe.
The volcanic pebbles and boulders are mainly andesitic, dacitic to rhyolitic when looking at their mineralogical assemblages (Fig. 3G). The boulders display trachytic to microcrystalline and porphyritic textures. They are made up of plagioclase phenocrysts and contain aggregates, which are rich in opaque mineral and pyroxene (?), forming pseudomorphs after hydroxyl-bearing mafic phenocrysts, such as amphibole (hornblende?) and/or biotite (Fig. 3G). Classical in volcanic rocks, such pseudomorphs result from the destabilization of former phases due to pressure drop that enhances the exolution of the volatile elements during magma ascent and subsequent eruption. The dacitic rocks also contain a few corroded quartz crystals (Fig. 3H), which is another classical feature of felsic volcanic rocks that results from changes of the quartz-feldspar thermodynamic stability fields as the pressure drops during magma ascent. Usually the groundmass contains microlites of plagioclase and sanidine that often underline a fluidal texture. Apatite, opaque minerals, allanite and zircon are the classical accessory phases. Silica-rich cryptocrystalline to amorphous cross-cutting veins are rare. The rocks are slightly to significantly weathered, mostly showing sericite that develops from the feldspars, and chlorite and titanite that develop within the opaque mineral-rich pseudomorphs or within the groundmass. Sample LP 70 is more weathered than sample LP 68.
Only two samples, LP 68 (RCS Fm.) and LP 70 (LPT Fm.), were analyzed for geochemistry. In the TAS diagram they plot as trachydacite and rhyolite (Fig. 4A) respectively. Rather consistently, they are classified as andesite and dacite-rhyodacite in the Winchester and Floyd (1977) diagram (Fig. 4B), respectively. They are characterized by a strong enrichment in LREE (Fig. 5A) and to a lesser extent in HREE with respect to the chondrite, with a (La/Yb)N of 16.6 for sample LP 68 and 37.1 for sample LP 70. Such a high degree of REE fractionation is compatible with the occurrence of amphibole
pseudomorphs (Fig. 3G). Sample LP 70 is also marked by a significant negative Ce anomaly (Ce/Ce* = 0.48) that may result from various mechanisms including partial melting of a protolith with a negative Ce anomaly, assimilation of marine sediments, post-eruptive contamination by sea water (Bohrson and Reid, 1997), soil formation (Braun et al., 1990, Ndjigui et al., 2009) or post-eruptive meteoric fluid-rock interaction, (Marsh, 1991; Cotten et al., 1995). Because a Y anomaly is lacking in sample LP 70, the negative Ce anomaly is interpreted as the result of alteration due to a post-eruptive hydrothermal or meteoric fluid circulations (e.g., Marsh, 1991; Cotten et al., 1995; Bau, 1996). Multi-elements primitive mantle normalized spectra of these two samples (Fig. 5B) show significant negative anomalies for Nb, Ta and Ti and a positive anomaly for Pb, only in the less altered sample LP 68.
The overall geochemical characteristics displayed by the andesitic to dacitic boulders from the RCS and LPT fms. are consistent with an arc setting tectonic affinity. In the tectonic discrimination diagrams of Verma et al. (2013), the probability that these two samples belong to a continental arc setting is 65.1% (Fig. 9). Consistently, more familiar tectonic discrimination diagrams yield similar results (Appendix 4).
4.2.2. Volcaniclastic rocks
The samples of volcaniclastic rocks from the RCS and the LPT fms., tuffaceous arenites to tuffs according to their volcaniclast contents, have already been described in detail by Blanchard et al. (2013). Thus, only short petrographic descriptions of the samples used in this work for chemistry and geochronology are provided in Table 2.
Four tuffaceous arenites have been analyzed for major and trace elements (Appendix 3). The REE and Y chondrite normalized patterns of these rocks (Fig. 5A)
show an overall similarity with those of the andesitic to dacitic boulders from the conglomeratic layers of the RCS and the LPT fms. They are however slightly less enriched in REE with a (La/Yb)N ranging between 10.6 and 17.4. Bivariate diagrams, using immobile elements as variables (Fig. 7), show that these volcaniclastic rocks define trends with a pole constituted by the andesitic to dacitic boulders from the RCS and LPT fms. These trends reflect the mixing of a volcanic source similar to that of the andesitic and dacitic boulders with some epiclastic material. Additionally, both bivariate diagrams and REE spectra show that the volcaniclastic rocks from the MRU and those from the volcaniclastic rocks of the RCS and LPT fms. were fed by distinct volcanic and epiclastic sources.
Consistently with the derivation of these rocks from felsic rocks similar to those represented by the andesitic and dacitic boulders for which a continental arc setting was deduced (Fig. 9), a high probability (73.2%, Fig. 8B) for an arc setting is also obtained for the volcaniclastic rocks when plotted in the discrimination diagram of Verma and Armstrong-Altrin (2013). In the diagram proposed by Roser and Korsch (1986), the tuffaceous arenites also plot, consistently, in the fields of the “oceanic island arc margin” and “active continental margin” (Appendix 4).
5. Geochronology
Fourteen volcanic and volcaniclastic samples were analyzed in order to get new age constraints, complementary to those previously published by Blanchard et al. (2013). The new dating results are presented with emphasis on the Triassic detrital heritage. Older detrital zircon grains were found in most of the analyzed volcaniclastic rocks, but as the data that are older than the Triassic are essentially similar to the one discussed by
Blanchard et al. (2013), they are not presented here. Analytical results are provided in the supplementary material (Appendix 5).
5.1. Purple Claystone Formation
Three tuffaceous arenites (samples LP 03, LP 04 and LP 05) from this formation have been dated. As depicted in Fig. 2C, samples LP 04 and LP 05 are stratigraphically located 65 m and 130 m above sample LP 03, respectively. Samples LP 03 and LP 05 come from layers encasing a dicynodont and a chroniosuchian skulls, respectively (Battail, 2009; Bercovici et al., 2012). The taxonomy and phylogenetic analysis of these fossils is beyond the scope of this paper.
Sample LP 03 (Fig. 10B)
One hundred and two zircon grains (105 individual analyses) were analyzed for the tuffaceous arenite sample LP03. Twenty-five zircons grains yielded dates with a probability of concordance ≥ 10%, implying rather low detection limits, ranging between 2.7% for 1 grain at a probability level of 50% (noted DL1(pL=0.5)) and 23.2% for 3 grains at the probability level of 95% (noted DL3(pL=0.95)). These grains are characterized by variably pronounced pinkish colors and variable degrees of roundness. The Th/U ratio for the analyzed zircon grains ranges between 0.24 and 2.09 and most of the grains display well-defined magmatic zoning in cathodoluminescence (CL), suggesting a magmatic origin for all these grains (e.g., Rubatto, 2002).
Six zircon grains, defining the youngest concordant cluster and displaying sub-rounded to nearly euhedral shapes and a well-defined zoning in CL, give a concordia date of 252.0 ± 2.6 Ma with a MSWD of 0.89 and a probability of 0.55 (Fig. 10B). This
date is interpreted as the maximum depositional age for sample LP 03 (Fig. 10B, Table 3).
Sample LP 04 (Fig. 10C)
A limited number of zircon grains (36) have been extracted from this sample and 41 analyses have been performed. These grains display characteristics that are essentially identical to those observed in sample LP 03, except one grain with Th/U = 0.09, potentially of metamorphic origin (e.g., Rubatto, 2002). Only 7 zircons grains display a probability of concordance ≥ 10%, thus resulting in high detection limits: DL1(pL=0.5) is equal to 9.4% and the DL3(pL=0.95) is as high as 65.9% (Table 2). Given these high detection limits, only the detrital populations that are present in high relative proportions are likely to have been sampled. Conversely, there is a rather high chance that we missed detrital populations with only small relative proportions.
Only one cluster of 4 grains meeting the 3 grains criterion used in this work allows calculating a concordia date of 300.5 ± 3.7 Ma (MSWD = 0.73; probability = 0.65; Fig. 10C). However, the sample also contains 3 concordant individual grains that are younger, among which the youngest is 251.6 ± 6.4 Ma old (MSWD of concordance only = 1.1; probability of concordance only = 0.30). Given the high detection limits, it is likely that the youngest population of zircon grains was missed in this sample. As sample LP04 is located 65 m above sample LP 03, which gives a similar young date within uncertainties, the 251.6 ± 6.4 Ma date possibly corresponds to a real geological age rather than an analytical artifact, and is therefore interpreted as the maximum depositional age for sample LP 04 (Table 3).
Sample LP 05 is a tuffaceous arenite that yielded abundant, sometimes broken, zircon grains displaying rounded to euhedral shapes and variable pinkish colors. The detection limits are fairly low, with a DL1(pL=0.5) of 1.8% and a DL3(pL=0.95) of 15.3% (Table 3), ensuring that the main zircon populations have been analyzed. The Th/U of analyzed grains ranges between 0.28 and 1.04, suggesting a magmatic origin.
A cluster of 21 grains characterized by rounded to euhedral shapes and well-marked zoning (sometimes disturbed by local resorptions) gives a concordia date of 251.0 ± 1.4 Ma (MSWD = 0.55; probability = 0.99; Fig. 10D), interpreted as the maximum depositional age for this sample. However, 4 independent concordant grains yielded concordia dates of 232.3 ± 5.9, 225.6 ± 5.6, 213.1 ± 6.1 and 180.6 ± 5.0 Ma (dashed ellipses in Fig. 10D, the latter plotting out of the field shown in the diagram) that do not meet the 3 grains criterion of Dickinson and Gehrels (2009). Accordingly, these younger concordant dates are interpreted as analytical and/or geological artifacts linked to lead losses in the grains.
In summary, the dating of the 3 tuffaceous samples from the PCS Fm. indicates that the sedimentation of these volcaniclastic, braided-river to alluvial plain deposits is Early Triassic or younger. This result contradicts the late Permian age previously attributed to the PCS Fm. on the basis of Dicynodon biostratigraphy (Battail, 2009) and has potential implications on the stratigraphic range of these biostratigraphic markers of the Permian-Triassic boundary. Either the stratigraphic range of Dicynodon should be extended up to the Early Triassic, or the dicynodonts preserved within the PCS Fm. do not belong to the Dicynodon genus. Only a detailed taxonomic analysis of these fossils can provide a final answer between these two alternatives. Ongoing work on the taxonomy and phylogeny of these dicynodonts is nevertheless beyond the scope of this paper.
5.2. Mafic Rock Unit
Several attempts were carried out in order to date the rocks from the MRU. These efforts were unsuccessful for the basaltic rocks and only one tuffaceous arenite (sample LP 42, Fig. 10J) from that Unit yielded enough zircon grains to derive a maximum depositional age (Table 3). Nineteen angular to sub-angular zircon grains displaying various internal structures in CL (oscillatory or patchy zoning, or devoid of any zoning) were analyzed, among which only 3 are concordant. The detection limits are consequently very high, with a DL1(pL=0.5) of 15.9% and a DL3(pL=0.95) of 90.3% (Table 3) so that the probability that most of the grain populations have been sampled, is very low. Nevertheless, 3 concordant grains overlapping in age allow to calculate a maximum depositional age of 219.3 ± 2.9 Ma (concordia date, MSWD = 0.85; probability = 0.52; Fig. 10J). Because of the high detection limits, we infer that the population of grains with such a rather young age exhibits a high relative proportion in the sample.
5.3. Red Claystone and Luang Prabang Tuffite formations
5.3.1. Volcanic rocks
Five andesitic, dacitic to rhyolitic boulders sampled in conglomeratic layers in the RCS Fm. (sample LP 68, Fig. 11A), the LPT Fm. (samples LP 70, 71 and 72, Fig. 11B, 11C and 11D respectively) and in the conglomerates from the Luang Prabang nappe (Fig. 2, sample LP 10, Fig. 11E) have been dated. As for to the petro-chemical results, these samples display similar characteristics regarding their zircon contents, and are presented together.
Most of the zircon grains have a short prismatic shape and an internal structure typified by well-marked oscillatory zoning. All grains also have Th/U ratios higher than 0.1, evidencing their magmatic origin.
Plotted in Tera-Wasserburg diagrams, the grains spread along the concordia line (Fig. 11) following the lead loss trends. This spreading is thus interpreted as the consequence of a lead loss suffered by a significant number of grains. To minimize the effect of lead loss on the date calculation, the Tuff Zirc dates were calculated from
individual 206Pb/238U dates instead of using the weighted 206Pb/238U mean date. The
obtained Tuff Zirc dates are 217.5 +1.7/-2.4 for sample LP 68, 225.8 +1.4/-2.2 for sample LP 70, 230.4 +0.9/-1.8 for sample LP 71, 225.4 +1.5/-3.4 for sample LP 72 and 232.7 +2.8/-1.8 for sample LP 10. They are interpreted as the best estimates for the ages of emplacement for these volcanic rocks. Except in sample LP 10, a few zircon grains
yielded significantly older dates, ranging from 251.2 ± 6.4 (206Pb/238U date, sample LP
70) to 2047.6 ± 38.8 Ma (207Pb/206Pb date, sample LP 72). These dates are interpreted as
corresponding to the ages of zircon xenocrysts that were incorporated from wall rocks into the intrusive ascending magma feeding the volcanism. These zircon xenocrysts evidence the presence of a substratum made of continental crust by the time the volcanic rocks emplaced, between ca. 233 and ca. 218 Ma.
5.3.2. Volcaniclastic rocks
Four tuffaceous arenites and lappilistones (samples LP 06, LP 08, LP 58 and LP 100) from the RCS and LPT fms. have been analyzed in addition to samples LP 44, LP 45 and LP 57 previously dated by Blanchard et al. (2013). In addition, a tuffaceous arenite forming the matrix of the conglomerates from the Luang Prabang nappe (Fig. 2, sample
LP 11, Fig. 10I) and sharing similar characteristics with the samples from the RCS and LPT fms. regarding its zircon content have been analyzed. These samples are thus presented together.
The precise stratigraphic locations of samples LP 57, LP 58, LP 100, LP 44 and LP 45 are depicted in Fig. 2C, from the base to the top of the log. The exact stratigraphic position of the other samples is not precisely known. Sample LP 100 was encasing a dicynodont skull provisionally identified as a kannemeyeriiform (Blanchard et al., 2013).
Sample LP 58 (Fig. 10E)
Sample LP 58 comes from the upper part of a grey tuffaceous arenite layer that is interbedded within red silty claystones, where sample LP 57 from Blanchard et al. (2013) was taken. It yielded abundant, sometimes broken, zircon crystals displaying rounded to euhedral shapes, variable pinkish to reddish colors and variable internal structures in CL. The dominant population is composed of zircon grains displaying an elongated, euhedral shape with a slightly pinkish color and a well defined oscillatory zoning, suggesting a magmatic origin. Twenty-four grains out of the 71 analyzed grains are concordant, giving detection limits ranging from 2.8% for the DL1(pL=0.5) to 24.0% for the DL3(pL=0.95) (Table 3).
Among the analyses, the youngest cluster (4 grains) gives a concordia date of 224.1 ± 2.8 Ma (MSWD = 0.41; probability = 0.90; Fig. 10E), which is interpreted as the maximum depositional age for this sample. Within the uncertainties this age is identical with the age obtained from sample LP 57 (224.9 ± 1.0 Ma; Blanchard et al., 2013). Sample LP 58 also contains 6 concordant grains displaying almost identical shapes, colors and internal structures to those from the youngest cluster, with individual concordia dates ranging from 232.1 ± 5.7 Ma to 250.8 ± 6.7 Ma. These results are in
agreement with a hypothesis of continuous volcanic production lasting about 26 my (see discussion). Older dates from the sample are comparable with those obtained in sample LP 57 by Blanchard et al. (2013).
Samples LP 08, LP 06, LP 100 and LP 11 (Fig. 10F, 10G, 10H and 10I, respectively)
These samples correspond to tuffaceous arenites, except sample LP 06 which is a lapillistone. They belong to the RCS Fm. (LP 100), the LPT Fm. (LP 08 and LP 06) and a conglomerate from the Luang Prabang nappe (LP 11).
Numerous slightly pinkish, euhedral to sub-rounded zircon grains have been extracted from these volcaniclastic rocks. The grains exhibit well-marked oscillatory zoning with Th/U ratios higher than 0.1 (except one grain from sample LP 08), evidencing their magmatic origin. The detection limits for these samples are fairly low, with DL1(pL=0.5) and DL3(pL=0.95) bracketed between 1.7% and 2.6% and 15.0% and 22.3%, respectively (Table 3), ensuring that the main zircon populations have been analyzed.
Concordia dates calculated from the youngest clusters of these samples are 224.8 ± 2.9 (sample LP 08; n=4, MSWD=0.62, probability=0.74), 222.0 ± 1.5 (sample LP 06; n=15, MSWD=0.89, probability=0.55), 220.9 ± 1.1 (sample LP 100; n=27, MSWD=0.62, probability=0.99) and 220.3 ± 2.9 (sample LP 11; n=4, MSWD=1.01, probability=0.42). They are interpreted as the maximum depositional ages of the layers from which the samples were extracted. Two individual concordant analyses give younger concordia dates of 208.7 ± 5.9 Ma and 206.7 ± 5.5 Ma in sample LP 06 (dashed ellipses in Fig. 10G) that do not fit the Dickinson and Gehrels (2009) 3 grains’ criterion. These younger dates are thus interpreted as analytical and/or geological artifacts linked to a slight lead loss in the grains. In addition, a few grains in each sample give older, mainly Proterozoic dates. Nonetheless, most of the concordant analyzed grains have individual dates that
spread continuously, ranging from ca. 250 Ma down to the individual maximum depositional ages of the samples (Fig. 10F, 10G, 10H, 10I). Again, this suggests that the volcanic production was active over this period. These latter zircon populations were not sampled by Blanchard et al. (2013), who provided maximum depositional ages using far less analyses per sample than in the present work.
In summary, the sedimentation of the rocks from the RCS and LPT fms. occurred during the Norian from ca. 225 Ma to ca. 215 Ma, or after. Stratigraphically above these formations, the ML Fm. contains Norian conodonts and ammonites (e.g., Blanchard et al., 2013), which indicates that the RCS and LPT fms. were deposited before the Rhaetian (starting from ca. 208.5 Ma). In addition, no difference was found between the results from the RCS and LPT fms. and those from the conglomerates within the Luang Prabang nappe. This suggests that these conglomerates are possibly lateral equivalents of the RCS and LPT fms. rather than a younger formation.
6. Discussion
6.1. Tectonic setting for the Triassic volcanism
The prominent geochemical features of both mafic and felsic volcanic rocks documented in the Luang Prabang Basin point to magmas produced in subduction zones (e.g., negative anomalies in Nb, Ta, Ti and P, positive anomaly in Pb, Fig. 5). Various tectonic discrimination diagrams also suggest an arc setting (oceanic and continental for the mafic and felsic volcanism, respectively, Figs. 6 and 9). Additionally, and wholly consistent with their derivation from the dismantling of volcanic rocks and/or the direct incorporation of mafic or felsic pyroclasts and subsequent mixing with epiclastic
sources, both the mafic and felsic volcaniclastic rocks point to emplacements in an arc setting (Fig. 8). Magmatic rocks emplaced in late orogenic settings may, however, share very similar characteristics with those emplaced in arc settings (e.g., Hawkesworth et al., 1995; Morris et al., 2000; Srichan et al., 2009). These two contrasted tectonic environments are thus difficult to distinguish from the geochemistry alone. The same statement also holds for the volcaniclastic rocks.
To solve this problem, an argument may be provided considering the duration and the continuity of the volcanic activity. Indeed, a late orogenic setting is commonly characterized by pulsatile, short-lived (generally a few my within a single basin) and bimodal volcanism with gaps in intermediate compositions (e.g., Colgan et al., 2006; Ford et al., 2013) while subduction is usually typified by long-lived magmatic activity, forming a continuous series of mafic to felsic rocks. As already recognized by Blanchard et al. (2013), the maximum depositional ages in the RCS-LPT fms. are younger up the stratigraphic column (Figs. 2C, 10E and 10H), implying syn-sedimentary volcanic activity during the deposition of these formations (Fig. 12). Among all the available dates on these Norian formations, notice, however, that the Tuff Zirc date of sample LP 68 (an andesitic boulder from the RCS Fm.) is younger than the oldest sample from the overlying LPT Fm. Given the spreading of a significant number of analyses following the lead loss trend (Fig. 11A), the Tuff Zirc date of sample LP 68 may confidently be interpreted as the result of lead loss suffered by the zircon grains present in this boulder. The exact age of the solidification of the corresponding volcanic rock is thus unknown and the interpretation of coeval volcanic activity and sedimentation can be maintained.
Contrasting with the syn-sedimentary volcanism documented by the ages in the RCS and LPT fms., maximum depositional ages obtained from the samples of the PCS Fm.
(Fig. 10B, 10C and 10D) are identical within uncertainties, whatever their stratigraphic position (Fig. 2C). In that case, the uncertainties on the maximum depositional ages and the distance separating the most widely spaced samples (ca. 130 m between LP 03 and LP 05) do not prove a syn-sedimentary volcanic activity. Similarly, no statement regarding the contemporaneity of the volcanism with the sedimentation can be made for the volcaniclastic rocks of the MRU as only a single sample gave enough zircon grains to be dated.
The dating of volcanic boulders sampled in the conglomeratic layers of the RCS and LPT fms. adds complementary evidence to constrain the duration of the volcanism in the vicinity of the Luang Prabang Basin. The comparison between the oldest age from a reworked volcanic boulder (232.7 +2.8/-1.8 Ma, Fig. 11E) and the youngest maximum depositional age available (215.9 ± 1.3 Ma, sample LP 45, recalculated after Blanchard et al., 2013, following the procedure adopted in this study for the sake of consistency) shows that the volcanism lasted, at least, ca. 15 my (with a maximum of 20.9 my and a minimum of 13.7 my if we take into account the 2σ level uncertainties). Further evidence about the duration of volcanism is finally provided by the large amount of euhedral to angular zircon grains spanning from ca. 250 Ma to the maximum depositional ages of the volcaniclastic samples (Fig. 12C). Therefore, the duration of the volcanism documented in the vicinity of the Luang Prabang Basin is ca. 35 my. In addition, petrographic and field observations point toward a volcanism including intermediate rocks (andesite, dacite) rather than a bimodal volcanism where intermediate compositions are missing or poorly represented. The rather long duration, the continuousness in the production of zircon crystals as well as the overall petrographical and geochemical characteristics of the volcanism documented in the Luang Prabang Basin are therefore more easily explained by its emplacement in a
subduction setting rather than in a late-orogenic setting. In addition, large extensional structures (e.g. low angle normal fault) commonly observed in late-orogenic extensional settings (e.g., Malavieille, 1993) especially when significant amount of magmas are produced, have not been documented in the Luang Prabang Basin. Also, the marine sedimentation at the end of the Norian, evidenced by the ML Fm. is at odds with the expected continental environment for a late-orogenic setting. The volcanic and volcaniclastic rocks of the Luang Prabang Basin thus reveal the occurrence of an active magmatic arc from the Early to the Late Triassic (at least, from ca. 250 to ca. 215 Ma) in the vicinity of the basin.
Finally, the mafic volcanic rocks from the MRU display geochemical features that are markedly different from those shown by the late Carboniferous mafic rocks cropping out at ca. 35 km to the northeast of Luang Prabang (Qian X. et al., 2015a). For instance, the REE patterns displayed by the ca. 305 Ma basaltic pillow-lava are typical of N-MORB affinity, with a (La/Yb)N ranging between 0.45 and 0.87 while the (La/Yb)N for the basalts from the MRU ranges between 1.74 and 2.66. The REE patterns of the older dolerite (ca. 336 Ma) samples described by Qian X. et al. (2015a), with a (La/Yb)N ratio comprised between 1.55 and 1.77, are similar to those of the MRU (even though slightly lower), but numerous differences are evidenced when considering other major (e.g. SiO2, TiO2) and trace elements (e.g. Th, Co). These geochemical differences result in contrasting positions in discrimination diagrams, the late Carboniferous mafic rocks being N to E-MORB while the basalts of the MRU represent arc tholeiites. Therefore all the mafic rocks cropping out in the Luang Prabang area do not hold an unique geodynamic significance; some represent probable former oceanic crust (ophiolite) while others belong to a former volcanic arc.