HAL Id: hal-00831849
https://hal-polytechnique.archives-ouvertes.fr/hal-00831849
Submitted on 15 May 2014
HAL is a multi-disciplinary open access
archive for the deposit and dissemination of
sci-entific research documents, whether they are
pub-lished or not. The documents may come from
teaching and research institutions in France or
abroad, or from public or private research centers.
L’archive ouverte pluridisciplinaire HAL, est
destinée au dépôt et à la diffusion de documents
scientifiques de niveau recherche, publiés ou non,
émanant des établissements d’enseignement et de
recherche français ou étrangers, des laboratoires
publics ou privés.
Libration induced stretching mode excitation for
pump-probe spectroscopy in pure liquid water
Wafa Amir, Guilhem Gallot, François Hache
To cite this version:
Wafa Amir, Guilhem Gallot, François Hache. Libration induced stretching mode excitation for
pump-probe spectroscopy in pure liquid water. Journal of Chemical Physics, American Institute of Physics,
2004, 121 (16), pp.7908. �10.1063/1.1800952�. �hal-00831849�
water. © 2004 American Institute of Physics. 关DOI: 10.1063/1.1800952兴
I. INTRODUCTION
Liquid water plays a central role in chemistry and pro-foundly influences all molecular interactions in biological systems. The mechanisms of energy transfer in liquid water are essential for the understanding of a broad range of phe-nomena such as acid-base reaction, solvatation, ionic chan-nels, or protein folding. For a decade, H2O molecule has
been extensively studied by pump-probe techniques on a femtosecond time scale, often as an impurity in D2O
(HDO/D2O),1–7 or in CCl4.8 These experiments consist in
following in time a vibrationally excited wave packet. Evo-lution of the amplitude and frequency of this wave packet yields information on the energy relaxation as well as on the hydrogen bonding network. Even though the geometrical properties of water共translation, rotation兲 are similar in these various configurations, pure water is nevertheless different from these systems as it is expected to exhibit resonant in-termolecular energy transfer which precludes the local mode description utilized in previous works. These resonant effects are essential to fully understand water interaction with sol-ute, in particular, with biological molecules such as proteins. However, very few experimental data are available on pure H2O.
9,10
The main experimental drawback is its very high infrared absorption, necessitating thin samples and leading to heavy thermal effects that confuse the interpretation. Here, we propose a femtosecond pump-probe technique on thick samples allowing direct observation of resonant dipolar en-ergy transfer in pure water.
II. HOT-BAND ABSORPTION
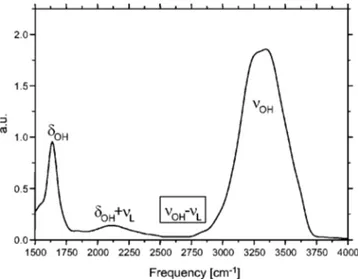
The infrared spectrum of H2O共see Fig. 1兲 is dominated
by a very strong absorption between 3000 and 3600 cm⫺1 due to symmetric and antisymmetric stretching modesOH.
A direct excitation in this region implies performing the ex-periments on very thin samples and induces problematic thermal effects. However, the spectrum also shows an inter-esting combination band around 2800 cm⫺1, involving tran-sitions from libration L to stretching modes OH.
11
Low frequency modes are dominated by translational modes 共hy-drogen bond stretching兲 below 200 cm⫺1 and libration modes共hindered rotations兲 around 700 cm⫺1. The transition
L→OH corresponds to a transition from a libration ‘‘hot
band’’ to the stretching band. Therefore it only involves wa-ter molecules which are in an excited libration mode. The probability to find a molecule in such an excited state de-creases with energy according to Boltzmann distribution p
⬀exp(⫺E/kT). At room temperature, this probability is a few
percent, implying that theL→OHtransition is allowed for
a restricted number of water molecules. The idea is to excite the stretching OH vibrators by a pump pulse tuned at the difference of frequencies between libration and stretching modes. As a result, the libration mode induced absorption ‘‘dilutes’’ the pump excitation like in HDO/D2O systems, but
conserves the geometrical and resonant characteristics of pure water. The evolution of the excited molecules is then monitored by probing the (OH⫽1→OH⫽2) transition
whose cross section is much stronger than the (L⫽1
→OH⫽1) transition.
A fundamental issue for studying pure water dynamics is the possibility to select a subset of water molecules as this is currently done in HDO/D2O systems. In order to achieve
such a selection, the hot-band transition frequency L
→OH must display a one to one correspondence with the
stretching frequency OH. No strong structure is observed near 2800 cm⫺1 in the linear spectrum of water because the band is wide and relatively close to the stretching modes. Then further modelization and analyzation are required to justify this statement. We want now to address this question by investigating more carefully the libration modes of water molecules. Let us first consider the libration modes and their interaction with the environment. This coupling has been a兲Present address: Colorado School of Mines, 1500 Illinois St., Golden,
CO 80401.
b兲Author to whom correspondence should be addressed. Electronic mail: Guilhem.Gallot@polytechnique.fr
7908
0021-9606/2004/121(16)/7908/6/$22.00 © 2004 American Institute of Physics
studied in detail by Gaiduk and Gaiduk.12 The model is the following. The libration bands are due to reorientation of the dipole moment of the water molecule as a whole in the hy-drogen bonding network 关Fig. 2共a兲兴. The water molecule moves in a rectangular potential profile with the depth U0
and angular width 2 关Fig. 2共b兲兴. The reorientation is de-scribed by the hindered rotation angle, which accounts for the interaction with the surrounding molecules and then de-pends on the hydrogen bonding density that hinders the mo-lecular rotation. Molecules with energy H⬍U0 perform
li-bration, and molecules with H⬎U0 perform free rotation. The libration frequencyLis related to by12
L⫽
1 4c
冑
3kBT
I , 共1兲
where c is the light velocity, kB the Boltzmann constant, T
the temperature, and I⫽1.483⫻10⫺40g cm2 the inertial mo-ment of the molecule. The angle  relies on the molecular density by,13 ⫽ 8
冑
mHM I冋冉
M NA共T兲冊
1/3 ⫺册
,where mHis the proton mass, M the molecular weight, NA
the Avogadro’s number, the density, and⫽2.9 A the ef-fective diameter of the molecule. The libration frequencyL
is therefore directly correlated to the average nearby hydro-gen bonding length RO¯O: a dense 共loose兲 hydrogen bond-ing network is then responsible for high 共low兲 frequency li-bration modes. The density is related to the average hydrogen bonding distance RO¯O by ⫽ C/ROO
3
. At ther-modynamical equilibrium, C⫽2.035⫻10⫺23g. Equation共1兲 then becomes
L关cm⫺1兴⫽
136.3 1.135 ROO关A兴⫺2.9
.
Furthermore, it is well known that the average stretching vibration frequencyOHis also correlated to RO¯O.
14
Even though a dispersion exists in the relationship between OH
and RO¯O,
15,16
the pump induced wave packet can be de-scribed by the average value of this dispersive relationship. Therefore, to a given hydrogen bonding network corresponds an average libration and stretching frequency. In order to address this point more quantitatively, we have carried out quantum mechanical calculation of the first and second stretching mode frequencies by solving a one-dimensional Schro¨dinger equation for the O-H coordinate ROH using an anharmonic Lippincott-Schro¨der potential.17This calculation shows that both (OH⫽0→OH⫽1) and (OH⫽1→OH
⫽2) transition frequencies increase when RO¯O increases.
The structure of the librational and vibrational levels, as de-picted in Fig. 3, allows one to understand that Pum p⫽OH
⫺L displays a one to one correspondence with OH and
FIG. 1. The linear absorption spectrum of H2O in the midinfrared is
domi-nated by three peaks: the symmetric and antisymmetric stretching modes
OHaround 3300 cm⫺1, the bending mode␦OHat 1640 cm⫺1and a
com-bination band between the bending and libration modes (␦OH⫹L) around
2200 cm⫺1. Furthermore on the red side ofOH, a combination band
be-tweenOHand libration modes extend from 2300 to 2900 cm⫺1.
FIG. 2. Libration model for liquid water共from 共Ref. 12兲. 共a兲 A water mol-ecule is linked to four neighbors by hydrogen bonding 共doted lines兲 and oscillates in the hydrogen bonding network with an angular amplitude 2. 共b兲 The molecule evolves in a rectangular potential profile, with an angular width 2and depth U0.
FIG. 3. Mode levels involved in the pump-probe scheme. The pump popu-lates the first stretching mode from the first exited libration mode (L⫽1
→OH⫽1). A pump at 2800 cm⫺1共respectively, 2600 cm⫺1) excites the
first stretching mode at an energy of about 3550 cm⫺1 共respectively, 3380 cm⫺1). Due to cross section consideration, the probe reads the second transition (OH⫽1→OH⫽2) starting at 3260 cm⫺1 共respectively,
3060 cm⫺1). After excitation, the wave packets evolve in both cases back to thermodynamical equilibrium at 3250 cm⫺1 which the probe reads at 2960 cm⫺1.
7909 J. Chem. Phys., Vol. 121, No. 16, 22 October 2004 Stretching mode excitation in water
transitions are available: to the ground state (OH⫽1
→OH⫽0, bleaching兲, to the second excited state (OH⫽1
→OH⫽2, induced absorption兲 or back to the libration state
(OH⫽1→L). The resonance ofOH mode is 3250 cm⫺1,
with an anharmonicity of 300 cm⫺1 toward the lower fre-quencies. Thus, the effect of bleaching of the transition is totally negligible compared to induced absorption in the 2600– 3000 cm⫺1range which is covered by our probe. The contribution of transition back to the libration state may be estimated from the OH⫽1→L transition cross section.
From the linear absorption spectrum and taking into account the reduced population of the libration modes, this latter is found to be at least four times weaker than the induced ab-sorption one in the 2600– 3000 cm⫺1 range. The OH⫽1
→L transition should therefore scarcely contribute to the
probe signal. In conclusion, one expects the pump-probe differential signal to be strongly dominated by the
OH⫽1→OH⫽2 transition, implying an increase of the
ab-sorption of the probe induced by the pump. III. EXPERIMENTAL SETUP
To perform pump-probe hole burning experiments in the midinfrared range, energetic laser pulses are required. The central element of the infrared laser source18 is a titanium-sapphire amplifier, delivering 130 fs pulses at 800 nm with a repetition rate of 1 kHz. It drives two lines of pulses inde-pendently tunable in the midinfrared. The principle of the generation is the parametric amplification of a quasicon-tinuum in the near infrared, followed by a frequency mixing in the midinfrared. The features of the sources are as follows. The more energetic line 共the pump兲 has a duration of 150 fs and a spectral width of 65 cm⫺1. It delivers more than 10J between 2800 and 3800 cm⫺1. The independently tunable weaker line共the probe兲 has similar characteristics but with a maximum energy ten times less. The delay between the pump and the probe is precisely controlled by a computer. The sample cell is 40 m thick and contains pure water at room temperature. The sample is circulated to avoid heating problems. The pump and the probe beams are focused in the sample by two 25 mm-focal length calcium fluoride lenses. The angle between the pump and the probe beams is 15°. In order to reduce the noise perturbation, the probe signal is normalized by the signal issued from a small part of the probe beam reflected before the cell. Furthermore, the pump beam is chopped at half the repetition rate of the
laser 共i.e. 500 Hz兲, in order to obtain successively a probe signal with and without the pump. With this procedure, we achieve signal to noise ratio of 104. For a given pump fre-quency, differential spectra are recorded by tuning the probe frequency for several pump-probe delays.
IV. EXPERIMENTAL DATA
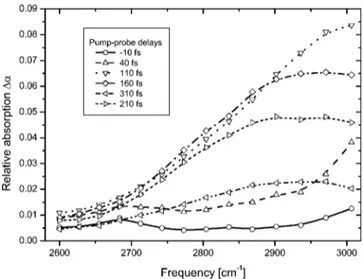
We now present differential spectra, that is, probe ab-sorption with the pump minus probe abab-sorption without the pump. The pump frequency is tuned at 2800 cm⫺1 and the probe frequencies cover the range 2600– 3000 cm⫺1. The frequencies above 3000 cm⫺1 are experimentally unobserv-able because of high absorption of water. The differential spectra are presented in Fig. 4. First, one notices an overall increase of absorption in presence of the pump, showing that induced absorption from first to second stretching excited state (OH⫽1→2) is the dominant contribution for the
dif-ferential spectra. Second, short delay spectra (⫺10 and 40 fs delays兲 show no evidence for spectral substructure around 2800 cm⫺1, indicating thatOH⫽1→Ltransition is totally
negligible. As expected, these differential spectra are the sig-nature of the wave packet evolution of the OH⫽1 state,
probed through OH⫽1→2 transition, because other
transi-tions (OH⫽1→L and OH⫽1→2) are negligible. The
time evolution of the spectrum shape is related to energetic reorganization of the wave packet under the influence of other water molecules and hydrogen bonding network. More precisely, in Fig. 4, for short delays, the spectra exhibit a maximum beyond 3000 cm⫺1which will be clarified further. This maximum clearly moves toward lower frequencies and stabilizes around 2900 cm⫺1 after a delay of 200 fs. Simul-taneously, the energy integral of the spectra decreases very rapidly with a dynamics of less than 200 fs. The energy is maximum for a delay of about 100 fs, and has almost com-pletely relaxed 200 fs later. This shows a very fast dynamics of the energy stored in the excited wave packet, as well as the energetic reorganization of the wave packet. Both exhibit characteristic times less than 200 fs.
FIG. 4. Differential spectra in pure water with a pump tuned at 2800 cm⫺1 and six pump-probe delays. The sample cell is 40m thick.
More precise information may be extracted from the data. Due to incomplete knowledge of the differential spectra at short delays, Gaussian fit is not directly applicable. In-deed, a far and energetic wave packet will have roughly the same truncated spectral shape as a less energetic but closer wave packet. However, at longer delays, the shape of the wave packet allows us to extract energy and position with precision. From the knowledge of energetic evolution at de-lays longer than 100 fs, deduction of short dede-lays dynamics is then possible. Evolution of the wave packet energy has been calculated19 and our data yields a dynamics of 110
⫾20 fs, from which short time dynamics is deduced 共see
Fig. 5兲. This dynamics is very fast, even shorter than the pulse width. However it is well established than sub-pulse-width temporal resolution can be achieved providing a very precise knowledge of the pump-probe delay and the study of the signal shape. The first point is made possible by precisely synchronizing the pump and the probe in a GaSe nonlinear crystal for each couple of pump and probe frequencies to avoid small fluctuation of delays during the probe tuning. From the pump-probe correlation measurement, one can es-timate the delay precision to be less than 20 fs. The second point is clearly demonstrated in Fig. 5 by fits of the energy dynamics with characteristic times shorter共40 fs兲 and longer
共200 fs兲, which can be discriminated from best fit, and
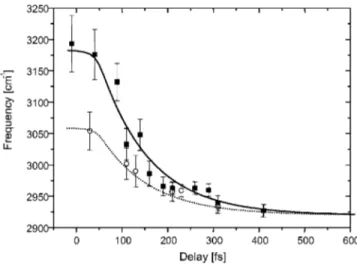
pro-vides the estimation for the fitting precision. The last point is the absence of optical coherent effects in the experiment, as pointed out by several other experiments on water.1–7With the calculated energy of the wave packet at short delays, Gaussian fit provides the position of the wave packet with good precision. The result is depicted in Fig. 6. As expected, the central position of the wave packet evolves from higher to lower frequencies. The amplitude of the displacement is important: about 220 cm⫺1. Indeed, the wave packet moves on more than half of the width of the OH vibrator. At short delays, the wave packet position moves slightly from the starting point around 3180 cm⫺1, because the pump is still generating the excited wave packet. Once the pump
disap-pears, the wave packet evolves surprisingly quickly, being back to an equilibrium position in less than 300 fs. The ori-gin around 3180 cm⫺1 is associated with the probing of the
OH⫽1→2 transition, corresponding to aOH⫽0→1
tran-sition of 3495 cm⫺1. It should be noted that error bars are relatively large at short delays. It comes from the uncertainty of the fitting procedure due to incomplete spectral bands. However, it does not question the observation of spectral diffusion in pure water because the fits are based on precise wing shapes and energy knowledge. An other set of experi-ments have been performed with the pump frequency tuned at 2600 cm⫺1, that is, to say closer from thermodynamical equilibrium position. As expected, one observes 共see Fig. 6兲 a spectral displacement similar to the one obtained with the pump at 2800 cm⫺1. The starting point of the wave packet is lower, around 3060 cm⫺1 and the amplitude is less impor-tant: 100 cm⫺1. The equilibrium position is once again at 2920 cm⫺1. Excitation at 2800 cm⫺1 共respectively 2600 cm⫺1) provides a wave packet centered around 3180 cm⫺1 共respectively 3060 cm⫺1), in good agreement with our model, and shows the nature of the libration-stretching coupling. A pump at higher frequency selects a subset of water molecules with larger average hydrogen bond length 共see Fig. 3兲 due to both the increase of the stretching frequency and decrease of hot libration frequency with re-spect to RO¯O. This also explains why moving the pump
frequency 200 cm⫺1only moves the wave packet 120 cm⫺1, in agreement with the model.
V. MODEL AND DISCUSSION
To extract quantitative information from the experimen-tal data, we computed the behavior of the wave packet in spectral diffusion regime19which requires the spectral diffu-sion characteristic time di f f as only dynamical parameter
besides the pump and probe pulse duration. The best agree-ment, shown in Fig. 6, has been obtained with a characteris-tic timedi f f equal to 110⫾15 fs. It should be noted that the
FIG. 5. Energy relaxation of the wave packet. The hollow squares are ex-perimental data and the lines stand for theoretical curves共Ref. 19兲 for three relaxation times: solid共110 fs兲, dashed 共200 fs兲, and dotted 共40 fs兲. The solid circles are extrapolated energy values for a relaxation time of 110 fs.
FIG. 6. Evolution of the central position of excited wave packets in pure water. The pump creates an excited wave packet, the position of which quickly evolves toward the equilibrium position, with a characteristic time of 110 fs. Solid squares共respectively, hollow circles兲 are experimental po-sitions corresponding to a pump frequency of 2800 共respectively, 2600兲 cm⫺1. Solid lines are theoretical curves from Ref. 19.
7911 J. Chem. Phys., Vol. 121, No. 16, 22 October 2004 Stretching mode excitation in water
1, 3兲 for hydrogen bonding network reorganization, and a short time of less than 100 fs related to the coherence loss of the vibrator through a single hydrogen bonding5 and which requires photon-echo type measurements.5,7,16The measured time scale of 110 fs is far too short to support this hypothesis as hydrogen bonding network reorganization in pure water is very similar to the one in HDO/D2O.21 Furthermore, our
experiment is very similar to previous ones on HDO/D2O,
except of course the excitation principle. If this hypothesis was valid, we should have obtained the long time component due to network reorganization which is not the case. Another possibility might be related to intermolecular dynamics be-tween OH and 2␦ modes. However Raman experiments
22
showed no evidence at all for such a transfer, and the spectral separation between the two modes seems too large to support a vibrational transfer of 110 fs.22Vibrational Stokes shift can neither explain our results. It has been found equal to 70 cm⫺1,3 but its amplitude is too small compared to 220 cm⫺1. Furthermore, it is independent on the excitation frequency, thus pumping at 2600 and 2800 cm⫺1would lead to redshifts of equal amplitude, in contradiction with experi-mental results. Actually, the main difference between pure water and HDO/D2O is that in pure water, a water molecule
is surrounded by about four other similar water molecules. Vibrational energy transfer 共VET兲 has therefore to be taken into consideration. Through VET, vibration from an excited water molecule diffuses to neighboring molecules, quickly altering the environment of the probed vibrator. Such VET has already been observed by Woutersen and Bakker.23 Poulsen et al.24 simulated VET in pure water, and found a time transfer from 80 to 250 fs, in very good agreement with our data. This allows us to depict the model of diffusion in pure water as follows: the pump pulse, via libration modes, excitesOHvibrator at a given frequency. Each excited
mol-ecule is linked to four other water molmol-ecules by hydrogen bonding, which is a very good vibrational energy transfer vector. Neighboring vibrators are then progressively per-turbed by successive hopping of energy. Their environment being different from the initial vibrator, their frequencies are changed accordingly. From vibrators excited above the equi-librium frequency as in our experiments, the wave packet frequency moves back to equilibrium position with very high speed, much more rapidly than the hydrogen bonding net-work reorganization. From this hopping diffusion process, one can attempt to access the energy diffusion coefficient in
This study shows that the response of pure water to an environmental change is strongly influenced by ultrafast en-ergy transfer, with a characteristic time of about 100 fs. Resonant intermolecular energy transfer between water mol-ecules seems to be the dominating process, even though in-tramolecular energy transfer between symmetric and asym-metric stretching modes could play a role. Resonant energy transfer in pure water needs to be taken into account in nu-merical simulations, such as proton transfer27,28 and water-protein interaction.29Further theoretical models and numeri-cal simulations of pure water are required to get a precise picture of the multiple modes found in pure water.
ACKNOWLEDGMENTS
The authors would like to thank S. Bratos, J.-C. Leick-nam, R. Vuilleumier and S. Pommeret for helpful discussion. 1G. M. Gale, G. Gallot, F. Hache, N. Lascoux, S. Bratos, and J.-C.
Leick-nam, Phys. Rev. Lett. 82, 1068共1999兲.
2R. Laenen, C. Rauscher, and A. Laubereau, Phys. Rev. Lett. 80, 2622
共1998兲.
3
S. Woutersen and H. J. Bakker, Phys. Rev. Lett. 83, 2077共1999兲. 4J. Stenger, D. Madsen, P. Hamm, E. T. J. Nibbering, and T. Elsaesser,
Phys. Rev. Lett. 87, 027401共2001兲.
5S. Yeremenko, M. S. Pshenichnikov, and D. A. Wiersma, Chem. Phys. Lett. 369, 107共2003兲.
6C. P. Lawrence and J. L. Skinner, Chem. Phys. Lett. 369, 472共2003兲. 7C. J. Fecko, J. D. Evaes, J. J. Loparo, A. Tokmakoff, and P. L. Geissler,
Science 301, 1698共2003兲.
8H. Graener and F. Seifert, J. Chem. Phys. 98, 36共1993兲. 9
A. Pakoulev, Z. Wang, and D. D. Dlott, Chem. Phys. Lett. 371, 594 共2003兲.
10A. J. Lock and H. J. Bakker, J. Chem. Phys. 117, 1708共2002兲. 11J.-J. Max and C. Chapados, J. Chem. Phys. 116, 4626共2002兲. 12
V. I. Gaiduk and V. V. Gaiduk, Mendeleev Commun. 2, 76共1997兲. 13
V. I. Gaiduk and B. M. Tseitlin, Adv. Chem. Phys. 87, 125共1994兲. 14W. Mikenda, J. Mol. Struct. 147, 1共1986兲.
15C. P. Lawrence and J. L. Skinner, J. Chem. Phys. 118, 264共2003兲. 16R. Rey, K. B. Møller, and J. T. Hynes, J. Phys. Chem. A 106, 11993
共2002兲.
17H. J. Bakker, H.-K. Nienhuys, G. Gallot, N. Lascoux, G. M. Gale, J.-C. Leicknam, and S. Bratos, J. Chem. Phys. 116, 2592共2002兲.
18G. M. Gale, G. Gallot, F. Hache, and R. Sander, Opt. Lett. 22, 1253
共1997兲.
19
S. Bratos and J.-C. Leicknam, J. Chem. Phys. 101, 4536共1994兲. 20M. Diraison, Y. Guissani, J.-C. Leicknam, and S. Bratos, Chem. Phys.
Lett. 258, 348共1996兲.
21F. W. Starr, J. K. Nielsen, and H. E. Stanley, Phys. Rev. Lett. 82, 2294
共1999兲.
22A. Pakoulev, A. Wang, Y. Pang, and D. D. Dlott, Chem. Phys. Lett. 380, 404共2003兲.
23S. Woutersen and H. J. Bakker, Nature共London兲 402, 507 共1999兲. 24J. A. Poulsen, G. Nyman, and S. Nordholm, J. Phys. Chem. A 107, 8420
共2003兲.
25
A. Soper and M. G. Phillips, Chem. Phys. 107, 47共1986兲. 26H. Weingartner, Z. Phys. Chem.共Leipzig兲 132, 129 共1982兲.
27J. T. Hynes, Nature共London兲 397, 565 共1999兲.
28D. Marx, M. E. Tuckerman, J. Hutter, and M. Parrinello, Nature共London兲
397, 601共1999兲.
29
S. K. Pal, L. Zhao, and A. H. Zewail, Proc. Natl. Acad. Sci. U.S.A. 100, 8113共2003兲.
7913 J. Chem. Phys., Vol. 121, No. 16, 22 October 2004 Stretching mode excitation in water