CHARGE STORAGE MECHANISM AND SIZE CONTROL OF GERMANIUM
NANOCRYSTALS IN A TRI-LAYER INSULATOR STRUCTURE OF A MIS MEMORY
DEVICE
L.W. Teo,1 V. Ho,2 M.S. Tay,2 Y. Lei,1 W.K. Choi,1,2 W.K. Chim,1,2 D.A. Antoniadis,1,3 E.A. Fitzgerald1,4
1 Singapore-MIT Alliance, Advanced Materials for Micro and Nano Systems Programme, National University of Singapore
2 Department of Electrical & Computer Engineering, National University of Singapore, 4 Engineering Drive 3, Singapore 117576
3 Department of Electrical and Computer Engineering, Massachusetts Institute of Technology, Cambridge, MA 02139-66307
4
Department of Material Science and Engineering, Massachusetts Institute of Technology, Cambridge, MA 02139-66307Abstract — A method of synthesizing and controlling the size
of germanium nanocrystals is developed. A tri-layer metal-insulator-semiconductor (MIS) memory device structure comprising of a thin (~5nm) silicon dioxide (SiO2) layer grown using rapid thermal oxidation (RTO), followed by a layer of Ge+SiO2 of varying thickness (3 - 6 nm) deposited using a radio frequency (rf) co-sputtering technique, and a capping SiO2 layer (50nm) deposited using rf sputtering is investigated. It was verified that the size of germanium (Ge) nanocrystals in the vertical z-direction in the trilayer memory device was controlled by varying the thickness of the middle (cosputtered Ge+SiO2) layer. From analyses using transmission electron microscopy and capacitance-voltage measurements, we deduced that both electrons and holes are most likely stored within the nanocrystals in the middle layer of the trilayer structure rather than at the interfaces of the nanocrystals with the oxide matrix.
Index Terms — Ge nanocrystal, Floating gate,
Metal-insulator-semiconductor
I. INTRODUCTION
Flash EEPROM (Electrically Erasable and Programmable Memory) are presently one of the most popular forms of non-volatile memories. Conventionally, nonvolatility in the form of 10-years data-retention time can be achieved by making the tunneling oxide thickness of these devices to be greater than 7nm. However, by incorporating a thick tunneling oxide greatly compromises the write and erase speeds of these devices [1]. In order to overcome the limitation imposed on the tunneling oxide thickness, some memory devices use the hot-electron injection mechanism to improve the write speed. However, the erase speed is still limited by the low tunneling current through the tunneling oxide [2]. It has been demonstrated that a memory-cell containing nanocrystals embedded within the gate dielectric exceeds the performance limitation of a conventional floating gate device [3]. The attractive characteristics of replacing the conventional floating gate with nanocrystals created a great interest in this area. The syntheses of nanocrystals within the gate dielectric have
been demonstrated in the form of silicon (Si), germanium (Ge) or tin nanocrystals formed via ion implantation [3,4,5]. However, there exists limitation in the ion implantation technique. These include the requirement for a minimal control oxide thickness and also the possibility of degrading the oxide during ion implantation. Another method of synthesizing Ge nanocrystals has been demonstrated through a sequence of thermal oxidation steps on Si1-xGex at various temperatures [6].
In this paper, a tri-layer structure, which mimics the conventional floating gate structure, is synthesized through co-sputtering and subsequent rapid thermal oxidation (RTO). Germanium nanocrystals of controllable sizes are successfully synthesized through annealing and the manipulation of the thickness of the tri-layer. The size of Ge nanocrystals in the trilayer metal-insulator-semiconductor (MIS) memory device was controlled by varying the thickness of the middle (cosputtered Ge+SiO2) layer. From analyses using transmission electron microscopy (TEM) and capacitance-voltage (C-V) measurements, we deduced that both electrons and holes are most likely stored within the nanocrystals in the middle layer of the trilayer structure rather than at the interfaces of the nanocrystals with the oxide matrix.
II. EXPERIMENT
The samples consist of a novel trilayer insulating configuration in a typical MIS structure. This trilayer insulating structure consists of a fixed oxide thickness of 50Å grown on (100) p-type Si substrate. This oxide was grown using RTO and was carried out using an AST SHS 10 rapid thermal processor. The RTO was performed at 1000oC for 40s in O
2 ambient to obtain the desired oxide thickness. A middle layer, of varying thickness, containing SiO2 and Ge were then rf-cosputtered using an Anelva sputtering system (SPH-210H) in argon ambient. The target for this process was prepared by attaching six
Manuscipt received 28 Oct 2002.
L.W. Teo is with the Singapore-MIT Alliance, 4 Engineering Drive 3, Singapore 117576 (e-mail:smap0020@nus.edu.sg).
pieces of Ge (10 × 10 × 0.3mm3 each) on a 4-inch SiO 2 target. The cosputtering was performed at 3 × 10⁻³ Torr with rf sputtering power set to 100W. Finally, a capping SiO2 layer of 500Å was sputtered using pure SiO2 (99.999% pure) target employing the same sputtering conditions as previously stated. The samples then underwent rapid thermal annealing (RTA) at 1000oC for 300s under an inert argon ambient. A layer of Al of 600nm was evaporated on top of the insulating structure to form the MIS structure. Circular capacitor structures of 180µm diameter were then defined using photolithography.
C-V measurement was carried out using a HP 4284 Impedance Analyzer and high resolution transmission electron microscopy (HRTEM) was used to obtained cross-sectional and planar images of the samples.
III. RESULTS AND DISCUSSIONS
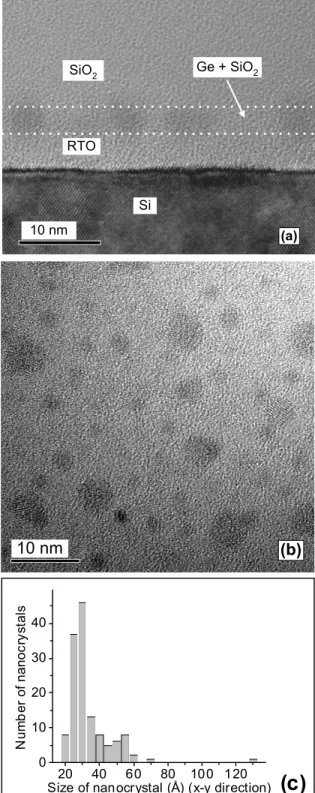
Figure 1(a) shows a HRTEM cross-sectional micrograph of a sample with a middle layer thickness of 6 nm (device A). The figure shows that most of the nanocrystals are confined within the middle layer. Note that 80% of the nanocrystals are ellipsoidal in shape and that the average diameter of the nanocrystals in the horizontal x-y plane is 8 nm with a standard deviation of 2.1 nm (see Fig. 1(c)). The diameter in the z-direction (i.e., direction perpendicular to the surface of the device) is ~6 nm. This is very different from our previous TEM results of a structure with a thicker middle layer (20 nm), which exhibited nanocrystals of varying sizes distributed in the middle layer. Figure 1(a) also suggests clustering of neighboring nanocrystals in device A. This is further verified from the planar (x-y plane) TEM picture shown in Fig. 1(b).
Figure 2(a) shows the TEM micrographs of a structure with a middle layer thickness of 3 nm (device B). The average size of the nanocrystals in the x-y plane is 3.3 nm with a standard deviation of 1.3 nm (see Fig. 2(c)). The maximum size of the nanocrystals here is ~3 nm in the z-direction. We found that 70% of the nanocrystals in device B were spherical and the rest were slightly ellipsoidal. The planar TEM micrograph of device B in Fig. 2(b) shows nanocrystals with diameter, δ, varying from 2 to 4 nm but are mostly well separated from one another. Note that there are a few bigger clusters in Fig. 2(b). The densities of the nanocrystals were estimated from Figs. 1(b) and 2(b) to be 5.7 x 1011 cm-2 and 1.6 x 1012 cm-2, for devices A and B, respectively.
Fig. 1(a) Cross-sectional, (b) planar transmission electron micrographs and (c) histogram of Ge nanocrystals size distribution of a trilayer structure consisting of 5 nm of rapid thermal oxide, 6 nm of co-sputtered Ge+SiO2 middle layer and 50 nm (capping oxide) of pure sputtered SiO2 (device A).
(b)
10nm
(c)
40 60 80 100 120 140 160 0 2 4 6 8 10 12 14 16 N umb er o f nan oc ry s tal sSize of nanocrystal (Å) (x-y direction) SiO2 RTO Si 10 nm (a) Ge + SiO2 10 nm
Figure 3 shows typical high-frequency C-V characteristics of devices A, B, C (middle layer thickness of 20 nm) and D (a MIS structure with 20 nm of pure SiO2 as the middle layer). Note that in all the devices, the RTO and the capping oxide layer thickness were fixed at 5 and 50 nm, respectively. It is clear from these four devices that with Ge nanocrystals in the structure, a significant counter-clockwise hysteresis and shift of the C-V curves are observed. There is also a pronounced change in the slope of the C-V curves of devices A, B and C from D. Note that the slope of the C-V curves of devices A, B and C is affected by the charge stored in the structure. This makes it difficult to differentiate the influence of the interface traps, normally found in a MIS structure, in a device exhibiting charge storage. The voltage shift appears to be rightwards (towards positive gate voltage) as the middle layer thickness increases. Ahn et al. [7] have suggested that in a system that contained Si-O-Si and Si-O-Ge bonds, the Ge-O bond is weaker and can be easily broken, leaving a Si-O- dangling bond structure. The dangling bond can capture an electron and become negatively charged. Our previous X-ray photoelectron spectroscopy results [8] on cosputtered Ge+SiO2 samples showed that there was a substantial reduction in the amount of GeOx bonds and a corresponding increase in the amount of elemental Ge after the samples were RTA at 1000oC. Therefore, it is possible that in the devices that have undergone RTA, the number of Si-O- dangling bonds increases and these dangling bonds subsequently capture electrons during the C-V measurements. The trapped electrons will then result
Ge + SiO2 RTO SiO2 Si (a) 10 nm
(b)
10 nm
(c)
20 40 60 80 100 120 0 10 20 30 40 N u m b e r of n ano cr ys ta lsSize of nanocrystal (Å) (x-y direction)
Fig. 3 Capacitance versus voltage characteristics of devices with 6 nm (device A), 3 nm (device B) and 20 nm (device C) middle layer thickness. The RTO and capping layers were fixed at 5 and 50 nm, respectively. Device D is a MIS structure with 20 nm of pure SiO2 as the middle layer. The inset shows the estimated densities of the stored charge for devices A, B and C. Note the quasi-neutral C-V curves for devices A and B (symbols ▲ and ■) were obtained by restricting the gate bias to a very narrow range to minimize charging up of the Ge nanocrystals.
Fig. 2 (a) Cross-sectional, (b) planar transmission electron micrographs and (c) histogram of Ge nanocrystals size distribution of a trilayer structure consisting of 5 nm of rapid thermal oxide, 3 nm of co-sputtered Ge+SiO2middle layer and 50 nm (capping oxide) of pure sputtered SiO2 (device B). -16 -12 -8 -4 0 4 8 12 16 20 24 0.0 0.2 0.4 0.6 0.8 1.0 C / C ox Applied Bias (V) 0 4 8 12 16 20 0 1 2 3 4 C ha rge s to ra ge (x10 12cm -2)
Middle layer thickness (nm) Device C (20 nm) Device B (3 nm) Device A (6 nm) Device D
in a rightwards shift in the measured C-V curves. It is possible that as the middle layer thickness decreases [9], the amount of Si-O- dangling bond reduces, resulting in less rightwards shift in the C-V curves. Thus, the number of trapped electrons (i.e., the rightwards shift of the C-V curve) would therefore be proportional to the middle layer thickness. This is in agreement with the results shown in Fig. 3.
The inset in Fig. 3 shows the estimated densities of the stored charge for devices A, B and C. The inset shows that the amount of charge stored in the device increases with a reduction in the middle layer thickness. The stored charge (which include both electrons and holes) for devices A and B were estimated from the area of hysteresis loop in Fig. 3 to be 1.3 × 1012 cm-2 and 3.6 × 1012 cm-2, respectively. Further C-V measurements were carried out on devices A and B to find their saturation charge storage capability. The bias range was increased gradually in order to see the saturation of the charge storage in individual devices. It was found that the charge storage of device A and B saturated at about 1.5 × 1012 cm-2 and 4.4×1012 cm-2, respectively.
Busseret et al. [10] have pointed out the difficulty in deciding whether the charge was stored in the nanocrystals or at the interfaces between the nanocrystals and the oxide matrix from C-V measurements. We will examine these two possibilities as follows.
We have estimated earlier the densities of the nanocrystals for devices A and B to be 5.7 × 1011 cm-2 and 1.6 × 1012 cm-2, respectively. A simple calculation using surface areas of the ellipsoidal and spherical nanocrystals (based on the nanocrystal size distributions shown in Figs. 1(c) and 2(c)) indicated that the total surface area of the nanocrystals in device A is about 1.6 times that of device B. As the saturated charge storage capability of device A is lower than device B by about 3 times (from results stated above), it suggests that the charge trapping at the interfaces of the nanocrystals with the oxide matrix is less likely to be the dominant charge storage mechanism.
The quasi-neutral C-V curves in Fig. 3 for devices A and B were obtained by restricting the gate bias to a very narrow range to minimize charging up of the Ge nanocrystals. Note that the quasi-neutral C-V curve is not exactly at the middle of the hysteresis loop for both devices. Also, the flat-band voltage obtained from the quasi-neutral C-V curve is close to zero for device A but is negative for device B. To explain this, it should be noted that the control structure that does not contain any Ge (i.e., device D) shows a negative flat-band voltage, indicating the presence of positive fixed charges. For the structures containing the Ge layer, there is an additional negative charge component due to the Si-O- dangling bonds trapping electrons, as mentioned above. The position of the quasi-neutral C-V curve is therefore dependent on the overall effect of the positive fixed charge and the negative charge component. For device A (6 nm thick Ge layer), there seems to be almost complete
compensation of these two charge components, resulting in a flat-band voltage close to zero. For device B (3 nm thick Ge layer), we expect the positive fixed charge component to be slightly more dominant than the negative charge component (proportional to the thickness of the Ge layer) because of the thinner Ge layer, thus resulting in a negative flat-band voltage. However, there seems to be a discrepancy when we compare the quasi-neutral C-V curve of device B and the C-V curve of the control device D in Fig. 3. We would expect the flat-band voltage of device B to be less negative than that of the control device D since there is some compensation of the positive fixed charge by negative charges in device B. However, this is not the case in Fig. 3. This discrepancy is explained possibly by the fact that a small non-negligible amount of hole trapping/storage still occurs when obtaining the quasi-neutral C-V curve of device B (for restricted negative gate voltage bias), since the charge storage capability of device B is higher than device A by about 3 times.
If the quasi-neutral C-V curve is assumed to be in the middle of the hysteresis loop for each device, then the amount of hole storage or electron storage in the saturated case will be half of the area of the hysteresis loop. This works out to 7.5×1011 cm-2 and 2.2 ×1012 cm-2 for device A and B, respectively, from the values stated above. As previously mentioned, the densities of the nanocrystals for devices A and B are 5.7 × 1011 cm-2 and 1.6 × 1012 cm-2, respectively. As such, there appears to be a close correlation of the amount of charge stored with the number of nanocrystals for both devices. For this reason, we propose that the charge storage in our samples is more likely to occur within the nanocrystals, rather than at the interfaces between the nanocrystals and the oxide matrix. Note that if charge storage were to occur at the interfaces of the nanocrystals, we would expect the charge storage to be much larger in device A than device B since the total surface area of the nanocrystals in device A is about 1.6 times that of device B. However, this is clearly not the case
IV. CONCLUSION
Different sizes of Ge nanocrystals were successfully fabricated using the tri-layer structure. It was shown that there is a good correlation between the middle layer thickness and the maximum size of the nanocrystals formation during the annealing process. We have also shown that both electrons and holes are most likely stored within the nanocrystals rather than at the interfaces of the nanocrystals with the oxide matrix.
ACKNOWLEDGEMENT
The authors would like to thank Mr. C.H. Tung of the Institute of Microelectronics for his help in the TEM work. The provision of research fellowships (Y. Lei), a research scholarship (L.W. Teo) and financial assistance to this project by the Singapore-MIT Alliance is gratefully acknowledged. Two of the authors (V. Ho and M.S. Tay) would also like to thank the National University of Singapore for provision of research scholarships.
REFERENCES
[1] P. Pavan, R. Bez, P. Olivo, E. Zanoni, “Flash memory cells-an overview.” Proceedings of the IEEE, vol. 85, no. 8, pp. 1248-71, 1997.
[2] L. Baldi, A. Cascella, B. Vajana, “A scalable single poly EEPROM cell for embedded memory applications”, Microelectronics Journal, vol. 28, no. 6-7, pp. 657-661, 1997.
[3] H. I. Hanafi, S. Tiwari, I. Khan, “Fast and long retention-time nano-srystal memory”, IEEE Trans. Electron Devices, vol. 43, no. 9, pp. 1553-58, 1996. [4] S. Tiwari, F. Rana, K. Chan, H. Hanafi, W. Chan, D. Buchanan, “Volatile and non-volatile memories in Silicon with nanocrystal storage”, International Electron Devices Meeting (IEDM) Technical Digest, 1995, p. 521.
[5] A. Nakajima, T. Futatsugi, N. Horiguchi, H. Nakao, “Single electron charging of Sn nanocrystals in thin SiO2 film formed by low energy ion implantation”, International Electron Devices Meeting (IEDM) Technical Digest, 1997, p. 159.
[6] Y. C. King, T. J. King, C. Hu, “Charge-trap memory deviced fabricated by oxidation of Si1-xGex”, IEEE Trans. Electron Devices, vol. 48, no. 4, pp. 696-700, 2001. [7] C.G. Ahn, H.S. Kang, Y.K. Kwon, S.M. Lee, B.R. Ryum and B.K. Kang, “Oxidation-induced traps near SiO2/SiGe interface”, J. Appl. Phys., vol. 86, pp. 1542-1547, 1999.
[8] W.K. Choi, Y.W. Ho, S.P. Ng and V. Ng, “Micro structural and photoluminescence of germanium nanocrystals in amphorous silicon oxide films”, J. Appl. Phys., vol. 89, pp. 2168-2172, 2001.
[9] L.W. Teo, C.L. Heng, V. Ho, M. Tay, W.K. Choi, W.K. Chim, D.A. Antoniadis and E.A. Fitzgerald, “Manipulation of germanium nanocrysals in a tri-layer insulator structure of a metal-insulator-semiconductor memory device”, Mater. Res. Soc. Symp. Proc., vol. 728, 2002, p. S5.7.1.
[10] C. Busseret, A. Souifi, T. Baron, G. Guillot, F. Martin, M.N. Semeria and J. Gautier, “Discharge mechanisms modeling in LPCVD silicon nanocrystals using C-V and capacitance transient techniques”, Superlattices and Microstructures, vol. 28, pp. 493-500, 2000.