Characterization of the Robustness of
Superhydrophobic Surfaces during Condensation
by
Emmanuel E. Simpri
Submitted to the
Department of Mechanical Engineering
In Partial Fulfillment of the Requirements for the Degree of
BACHELOR OF SCIENCE IN MECHANICAL ENGINEERING
at the
MASSACHUSETTS INSTITUTE OF TECHNOLOGY June 2016
0 2016 Emmanuel E. Simpri. All rights reserved. The author hereby grants to MIT permission to reproduce
and to distribute publicly paper and electronic copies of this thesis document in whole or in part
to any medium now known or hereafter created.
Signature of Author: Certified by: Accepted by: MASSACHUSETS INSTITUTE OF TECHNOLOGY
JUL
0 8
2016
LIBRARIES
MRCtiIVU
Signature redacted
'Department of Mechanical Engineering June 3, 2016
__Signature redacted___
Evelyn N. Wang Associate Professor of Mechanical Engineering Thesis Supervisor
____Signature redacted
Anette Hosoi Professor of Mechanical Engineering Undergraduate Officer
Characterization of the Robustness of
Superhydrophobic Surfaces during Condensation
by
Emmanuel E. Simpri
Submitted to the Department of Mechanical Engineering
on June 3, 2016 in Partial Fulfilment of the
Requirements for the Degree of Bachelor of Science in
Mechanical Engineering
ABSTRACT
Condensation is a process utilized by about 85% of power plants in their power generation cycles. Superhydrophobic surfaces can potentially improve the heat transfer due to condensation when compared to the untreated surfaces typically used in condensers. This can improve the efficiency of power plants by up to 3%. These surfaces are made by combining nanoscale roughness with chemical hydrophobicity, and can promote the mode of condensation that has the least resistance to heat transfer. However, it is unclear how long these surfaces will last under industrial conditions. This thesis is focused on testing the robustness of the surfaces in multiple experiments and analyzing the data gathered from these experiments, along with theorizing the mechanism behind any surface functionality deterioration that may be seen.
Hydrophobic and superhydrophobic surface samples that have been prepared previously were subjected to water immersion and continuous condensation tests. For the water immersion tests, samples were submerged in water under neutral (pH ~ 7) and basic (pH ~ 10) conditions at room
(-25'C) and elevated (~50'C) temperatures. The continuous condensations tests were run at a
steam temperature of 27*C as well as 1 000C. To understand the change in surface properties over the duration of the tests, the surface contact angle was chosen as the metric to be measured. The contact angles of water droplets on the samples were taken beforehand and throughout the tests using a micro-goniometer in order to quantify the change in surface functionality.
The data gathered from these experiments were processed in Matlab to produce plots of the change in contact angle over the duration of each test. These plots showed significant contact angle decreases for the hydrophobic surfaces but little change in the contact angle for the superhydrophobic surfaces. This suggests that the addition of nanostructures on the surface, and thus the promotion of superhydrophobicity, inhibits the surface functionality deterioration mechanism that is seen with the hydrophobic surfaces.
Thesis Supervisor: Evelyn N. Wang
Acknowledgements
I would like to thank Banafsheh Barabadi for bringing me on board this project, for her help with setting up the experiments and making sure everything ran smoothly, for keeping project expectations high, and for introducing me to superhydrophobic surfaces and how they can improve condensation heat transfer. This area has become my favorite interest over the past few months, and I hope to continue learning about it in the future.
I would also like to thank Dion Antao and Dan Preston for the knowledge they have shared with me about wetting and condensation, and for their advice in the writing of this thesis.
I would like to thank my thesis supervisor, Professor Evelyn Wang, for her advice and encouragement in this work.
I gratefully acknowledge the Electric Power Research Institute (EPRI) for funding this research, as well as the Device Research Lab nano subgroup for discussion on this research.
Finally, I would like to thank my family and friends for their never-ending support throughout all of my years at MIT.
CONTENTS
1. Introduction
8
1.1 Filmwise Condensation. ... 8 1.2 Dropwise Condensation... 9 1.3 Jumping Condensation. ... 9 1.4 W etting. ... 101.5 Contact Angle Hysteresis... 13
2. Experimental Setup 13 2.1 Surface Selection. ... 13
2.2 M icro-goniometer Setup... 15
2.3 Water Immersion Setup. ... 16
2.4 Continuous Condensation Setup. ... 17
3. Experimental Results 20 3.1 Contact Angle Data. ... 20
3.2 W ater Immersion Results... 21
3.3 1 000C Continuous Condensation Results. ... 24
3.4 27'C Continuous Condensation Results. ... 25
4. Conclusions and Future Work 29 4.1 Robustness Conclusions... 29
Figures
Figure 1-1: Schematic of filmwise (left) and dropwise (right) condensation. . . . 9
Figure 1-2: Images ofjumping condensation with (a) two water droplets which (b) coalesce before (c, d) jumping off the surface. Images courtesy of D. Preston [5]. . . . 10
Figure 1-3: Schematic of the relationship between the adhesive energy and the interfacial energies. An energy balance between the initial and final state yields equation 1.2. . . . 10
Figure 1-4: Schematic of the relationship between the cohesive energy and the interfacial energies. An energy balance between the initial and final state yields equation 1.3. . . . 11
Figure 1-5: Schematic of contact angle 0 of a liquid droplet on a solid surface [8]. . . . . 11
Figure 1-6: (a) Wenzel, (b) Cassie-Baxter, and (c) partially wetting modes on a nanostructured surface. Schematic courtesy of J. Sack [11]. . . . 12
Figure 2-1: SEM image of (a) zinc oxide (ZnO) nanostructures on a 410 stainless steel substrate and (b) copper oxide (CuO) nanostructures on a copper substrate, both with the P2i polym er coating. . . . 14
Figure 2-2: Micro-goniometer setup. . . . 15
Figure 2-3: Water immersion setup. . . . 16
Figure 2-4: Canister for continuous condensation setup . . . 17
Figure 2-5: Chamber for continuous condensation setup . . . 18
Figure 3-1: FAMAS image analysis software. . . . 20
Figure 3-2: Plot of contact angle evolution as a water drop grows and evaporates on a hydrophobic surface. . . . 21
Figure 3-3: Graph of advancing (A) and receding (R) contact angles over time during water immersion testing on galvanized steel with P2i coating. Microscope images of galvanized steel surface before (left) and after (right) testing under 10 pH conditions. . . . 22
Figure 3-4: Graph of advancing (A) and receding (R) contact angles over time during water immersion testing on 410 stainless steel with a woods nickel strike adhesion layer and a P2i coating. . . . 23
Figure 3-5: Graph of advancing (A) and receding (R) contact angles over time during water immersion testing on 410 stainless steel with a woods nickel strike adhesion layer, zinc oxide nanostructures, and a P2i coating. . . . 24
Figure 3-6: Graph of advancing and receding contact angles of 316 stainless steel with P2i, silicon with P2i, and copper with P2i during 100'C continuous condensation. . . . 25
Figure 3-7: Graph of advancing and receding contact angles for copper with a P2i coating and 316 stainless steel with a P2i coating. . . . 26
Figure 3-8: Graph of advancing and receding contact angles during continuous condensation at 25*C for 316 stainless steel with zinc oxide nanostructures and P2i coating, 316 stainless steel with a woods nickel strike adhesion layer, zinc oxide nanostructures, and P2i coating, and copper with copper oxide nanostructures and P2i coating. . . . 27
Figure 3-9: Graph of advancing and receding contact angles during continuous condensation at 25*C for copper with copper oxide nanostructures and a P2i coating. . . . 27
6
Tables
Table 1-1: Hydrophobic and superhydrophobic samples run under different testing
Chapter 1
Introduction
Condensation is a phase change phenomenon in which a fluid in its gaseous phase transitions into its liquid phase. About 85% of power plants worldwide use condensation as a part of their power generation cycle [1]. In this cycle, water is boiled into steam, which is run through a turbine in order to extract mechanical power from the high pressure steam, then the steam is condensed back into a liquid in order to be pumped to the boiler and boiled once again. Previous studies have indicated that the greatest net gain in efficiency lies in improving the condensation process [2]
In order to condense vapor, there must be a temperature difference between the vapor and the condenser surface. This temperature difference causes the vapor to cool down to the temperature at which the phase change to a liquid occurs, referred to as the saturation temperature. The phase change from vapor to liquid occurs on the surface of the condenser, and depending on the type of surface, different modes of condensation can be promoted which results in different thermal resistance networks.
The heat transfer due to condensation can be thought of in terms of an electrical circuit, with a potential to transfer heat that is the temperature difference, and a resistance to heat transfer caused by the interaction between the substances transferring heat. The mode of condensation promoted by the surface determines how much thermal resistance there is to the heat transfer between the vapor and the surface. A certain heat transfer rate must be achieved in order to maintain the performance of the power plant's cycle, and so decreasing the thermal resistance of the condenser would allow the temperature difference between the steam and the surface to be lower. The steam condensation temperature would be able to be decreased due to this.
Water-cooled condensers are usually used in industrial applications due to their effectiveness, but they require large amounts of water, the use of which can have an impact on the environment. Air-cooled condensers are of interest as a replacement because they reduce the fresh water withdrawal and consumption significantly. However, due to the poor thermal conductivity and heat capacity of air, the performance of air-cooled condensers is much lower than water-cooled condensers. Therefore, modified condenser surfaces are necessary to lower the thermal resistance of the condensation process by an amount that would enable the use of air-cooled condensers in power generation applications [3].
1.1 Filmwise Condensation
Typically in industrial power generation applications, steam is condensed on an untreated metal surface. The metals used are cheap and transfer heat well, but they are also hydrophilic, or water-loving, because of their high surface energy, which causes filmwise condensation to occur. In filmwise condensation, the condensate wets the surface, forming a film of liquid that acts as an extra resistance to the heat transfer between the steam and the surface (Figure 1-1).
4
Filmwise Dropwise
Fitire 1-1: Schematic of filmwise (left) and dropwise (right) condensation
Due to the strong attraction between the liquid and the surface, the film grows to a substantial thickness before the effects of gravity remove the liquid from the surface. The increased film thickness requires a larger temperature difference to maintain the same heat transfer rate, which decreases the efficiency of the heat removal process [4].
1.2 Dropwise Condensation
When condensation occurs on a hydrophobic, or water-fearing, surface, dropwise condensation is promoted. In dropwise condensation, individual droplets form instead of a film due to the decreased attraction between the liquid and the surface (Figure 1-1). These droplets roll off the surface due to gravity once they reach the size at which gravity effects dominate surface tension effects (i.e. the capillary length scale). This action exposes the surface to the vapor again, allowing heat to be transferred with much lower resistance. Dropwise condensation can result in about a five times improvement in heat transfer when compared to filmwise condensation [4].
1.3 Jumping Condensation
The attraction between the condensate and the surface can be lowered even further than in dropwise condensation to promote a mode known as
jumping
condensation. This can be achieved by combining nanoscale roughness with chemical hydrophobicity to create a surface referred to as a superhydrophobic surface. This type of surface enables the droplets to depart from the surface at sizes between 10 and 100 pm, much smaller than those observed in dropwise condensation. The low adhesion between the surface and the droplets allows them to leave the surface without the influence of external forces such as gravity (Figure 1-2). This jumping phenomenon occurs due to the release of surface energy upon coalescence of two droplets [5].Figure L- 2: Images of jumping condensation with (a) two water droplets which (b) coalesce before (c, d)
jumping off the surface. Images courtesy of D. Preston [5].
Heat is transferred at a much faster rate through small droplets due to the high surface area to volume ratio. Because of the small droplet departure size, the steam can also be exposed to the surface much more frequently. Jumping condensation can improve heat transfer by about 30%
when compared to the dropwise mode [6].
1.4 Wetting
Wettability is the ability of a liquid to spread over a surface. A liquid that totally wets a surface spreads over the surface completely, while a liquid that partially wets a surface forms a droplet. This phenomenon is caused by the difference in the adhesive energy between the solid and the liquid, and cohesive energy of the liquid. If the adhesive energy is larger than the cohesive energy, the liquid will spread over the surface, and if the cohesive energy is greater than the adhesive energy, the liquid will form a droplet [7]. The difference between the adhesive energy and the cohesive energy is referred to as the spreading parameter S.
S = Eadhesive - Ecohesive (1.1)
Thus total wetting occurs when S is positive, and partial wetting occurs when S is negative. This parameter can be expressed in terms of the interfacial energy, which is the energy associated with the intermolecular forces at the interface of two phases, in this case. The adhesive energy can
be related to the interfacial energy of the different phases involved in this case by considering the
separation of a liquid bulk from a solid (Figure 1-3).
1.q
d
~
Vapor
I A: J
Ecdhesive0CFiguire 1-3: Schematic of the relationship between the adhesive energy and the interfacial energies. An energy balance between the initial and final state vields equation 1.2
Eadhesive Ysv + YLV -YsL (.2)
where YSL represents the solid-liquid interfacial energy per unit area, YLV represents the liquid-vapor interfacial energy per unit area, and Ysv represents the solid-liquid-vapor interfacial energy per
unit area.
In a similar manner, the cohesive energy can be related to the interfacial energy by considering the separation of a liquid bulk into two (Figure 1-4)
Y LV
idcohesive
Figure 1-4: Schematic of the relationship between the cohesive energy and the interfacial energies. An energy balance between the initial and final state yields equation 1.3
Ecohesive = 2YLV (1.3)
After substituting equations 1.2 and 1.3, equation 1.1 becomes
S = Ysv - YLV - YSL (1.4) The partially wetting regime in which the spreading parameter is negative and droplets form is further divided into a hydrophilic and hydrophobic regime for water. These regimes can be classified in terms of a macroscopic property of the droplet known as the contact angle. The contact angle is the angle at which the liquid-vapor interface meets the solid surface, measured from within
the liquid (Figure 1-5).
11V
VAPOR
LIQUIlD
SOLID
Figure 1-5: Schematic of the contact angle 0 of a liquid droplet on a solid surface [8]
YSv YSL + YLVCOSOe (1.4) The equilibrium contact angle 0, describes the interaction of the energies at each interface according to Young's equation (eq. 1.1). Due to the interchangeability between the interfacial
energy per unit area and the interfacial tension, this equation can be derived by considering a force balance at the three-phase line [7].
Substituting Young's equation into the expression for the spreading parameter (eq. 1.4) yields a relationship between the spreading parameter and the contact angle.
S = YLV (COS e - 1) (1.5)
From this relationship it can be seen that the contact angle directly relates to the wettability of
a surface, as determined by the adhesive to cohesive energy difference. A liquid whose molecules are more attracted to the surface's molecules than to each other will totally wet the surface and show a contact angle around zero; a liquid whose molecules are attracted to each other a little more than to the surface's molecules will show low contact angles; a liquid whose molecules are attracted to each other a lot more than to the surface's molecules will show high contact angles
[7].
A surface is considered hydrophilic if the contact angle of a water droplet on the surface is less than 900 and is considered hydrophobic if the water droplet's contact angle is greater than 90'. The metals used in typical condensers in industry are hydrophilic due to their high surface energy: water molecules, which are polar, tend to be attracted to these metals because the metal molecules can have strong dipoles due to their large size. This leads to a large adhesive energy between the water and the metal surface which results in contact angles below 900. These metal surfaces can be made hydrophobic by applying a low surface energy coating, such as Teflon@ or silane, whose molecules are less polarizable than that of the metal and thus have weaker dipoles when interacting with water [9, 10]. This weak interaction results in a low adhesive energy between the water and the surface and causes contact angles between 90' and about 140' to be observed.
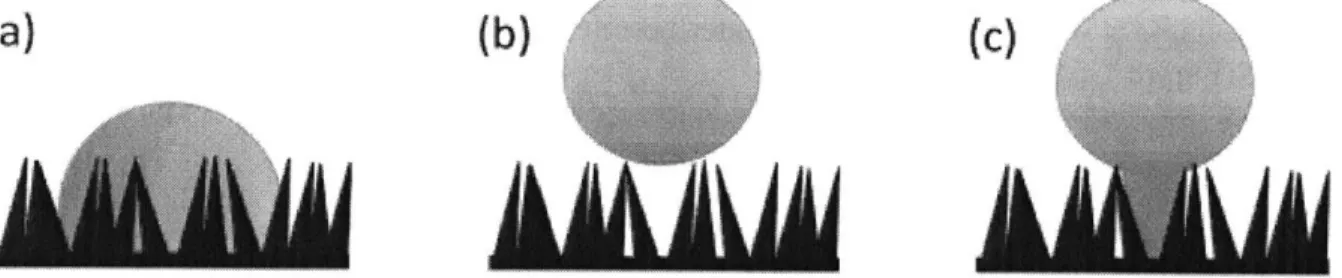
The surfaces that cause jumping condensation to occur typically have a contact angle greater than 1500, and these are referred to as superhydrophobic surfaces. These surfaces are made by applying a hydrophobic coating to a nanostructured surface. The three modes of wetting that can be seen on a nanostructured surface are shown below (Figure 1-6).
(a)
(b)
(c)
Figure 1-6: (a) Wenzel, (b) Cassie-Baxter, and (c) partially wetting modes on a nanostructured surface.
Schematic courtesy of J. Sack [11].
The nanostructures serve to amplify the natural tendency of the material. The nanostructures
used in this case are hydrophilic metal oxides and so the presence of the nanostructures causes the liquid to completely wet the surface. This wetting mode is referred to as Wenzel wetting (Figure 1-6 (a)). The relationship between the contact angle seen in this mode (0,,) and the equilibrium contact angle of the same surface without nanostructures (0 ) is given below.
cosQW = rcosOe (1.2) where r is the ratio of the total surface area to the projected area. This equation describes how increasing amount of nanostructures, which is represented by the value of r, decreases the contact angle of a hydrophilic surface and thus makes the surface more hydrophilic [9].
If the nanostructures are coated with a hydrophobic coating, the surface can be made superhydrophobic. There is a superhydrophobic regime in which it is energetically favorable for vapor to be trapped within the nanostructures as opposed to the liquid following the contour of the nanostructures. Because of the decreased area of contact between the liquid and the surface due to the trapped vapor between the nanostructures, as well as the low attractive force between the surface and the liquid due to the coating, there is very little adhesion between the liquid and the surface in this case [9]. This lack of adhesion is what causes the water droplets to leave the surface at such small sizes during jumping condensation.
This wetting mode is referred to as Cassie-Baxter wetting (Figure 1-6 (b)). The relationship between the contact angle seen in this mode (OCB) and the equilibrium contact angle of the same
surface without nanostructures (0e) is
COSOCB = -1 + fS(COS~e - 1) (1.3)
where fs is the fraction of the surface area occupied by the solid, and the rest of the surface area is occupied by the vapor [9].
The nanostructures of superhydrophobic surfaces can be grown to a size that causes only very small areas of the surface get wetted completely in a mode referred to as partial wetting (Figure 1-6 (c)). This is useful for the condensation application because it allows for easy droplet growth, and thus increased heat transfer, at the wetting site, as well as easy droplet removal due to the small contact area between the droplet and the surface [6].
1.5 Contact Angle Hysteresis
Young's equation (1.1) describes a relationship between the equilibrium contact angle and the interfacial energies of a drop of liquid on a solid surface, but in real situations in which the surface is rough and heterogeneous, there is a range of contact angles that can be observed, with the maximum being the advancing contact angle, and the minimum the receding contact angle. The difference between them is known as contact angle hysteresis. Due to this phenomenon, both the advancing and receding contact angles of the surfaces were measured after testing. Different factors affect the advancing and receding contact angles, and so observing the variations in these distinct contact angle modes under different conditions offers insight into the reason for any change in the wettability of the surface [12].
Chapter 2
Experimental Setups
The issue with attempting to promote dropwise condensation with the use of a hydrophobic
coating is the robustness of the coating. It has been seen that the surface functionality decreases over time when condensing on a hydrophobic surface due to physical or chemical destruction of the coating. This same issue is expected to be seen with the superhydrophobic surfaces. In order to confirm this as well as determine the mechanism behind any surface degradation, sample surfaces and several experimental setups were prepared. The temperature, pH, and shear force of water on the surtace were the factors investigated. In order to separate the effects of the water on the surface and the effects of the condensation process on the surface, both a water immersion and a continuous condensation setup were used. A separate flow setup was used to isolate the effect of shear on the surface functionality. To quantify the change in surface functionality as a function of the various operating conditions, the contact angle of the surface was measured for each of these tests using a micro-goniometer.
2.1 Surface Selection
Hydrophobic and superhydrophobic surfaces which had been prepared previously were selected for the tests in this experiment. Previous work by Sack [I 1] had shown that copper oxide (CuO) nanostructures (Figure 2-1) and zinc oxide (ZnO) nanostructures would be the most promising options for scaled-up manufacturing in terms of ease of fabrication and durability of the structures. A polymer coating commercially known as P2i [13] was shown to have the best adhesion [8].
4M
Figure 2-I: SEM image of(a) zinc oxide (ZnO) nanostructures on a 410 stainless steel substrate and (b) copper oxide (CLO) nanostructures on a copper substrate, both with the P2i polymer coating. Images courtesy of B. Barabadi.
The substrates used to create the test samples were metals that are commonly used in industrial condensers so that the superhydrophobic fabrication process could be replicated on those existing surfaces. These metals included copper (Cu) and different grades of stainless steel (SS). Additionally, silicon (Si) was also tested due to its availability in a highly polished surface finish. Surfaces with just the P2i coating were also tested in order to determine the influence of the
nanostructures on the surface robustness. A table of the surfaces tested can be found below (Table
2-1).
Table 2- 1: [ydrophobic and superhydrophobic samples run under different testing conditions
Samples Water Immcrsion 1 00C Condensation 270C Condensation
Galvanized Steel P2i X
410 SS P2i X 410 SS WNS ZnO P2i X 316 SS P2i X X 316 SS ZnO P2i X 316 SS WNS ZnO P2i X Cu P2i X X Cu CuO P2i X Si P2i X 2.2 Micro-goniometer Setup
The contact angles were measured before and after each test in order to quantify the change in surface functionality. This was done using a micro-goniometer setup (Figure 2-2).
Figure 2-2: Micro-gonioneter setup
In this setup, a stage that can be adjusted on all three axes sits in front of a microscope
objective lens. A piezoelectric head (Cluster Technology) was used to deposit water on a sample repeatedly so that the droplet could be observed as it grew to a final volume. Thus, the advancing
angle of the droplet was measured by analyzing the growing droplet, and the receding angle by
observing the droplet as it evaporated. In order to measure the advancing contact angle of a sample, a droplet was grown on the surface and images of the droplet as it grew were taken every 75 milliseconds for a total of 48 images. For the receding contact angle, images of the droplet as it shrunk were taken every 150 milliseconds, again for a total of 48 images.
Because different parts of the surface are affected differently by the testing, five measurements were taken at varying locations across the sample in order to get an average representation of the
sample's surface functionality.
2.3 Water Immersion Setup
A water immersion setup was used to test the effect of the water's composition on the surface
functionality over time. This setup consisted of three beakers of water with 400 mL of water in each. Sodium hydroxide was added to one beaker so that the solution had a pH of 10 in order to test the effect of a basic solution on the sample surface, as these conditions may be seen in an industrial setting. The second beaker was maintained at 50'C in order to test the effect of water at an elevated temperature on the sample surface. The third beaker was maintained at normal conditions. Each of the beakers was placed on a magnetic stir plate so that the water was well mixed with the magnetic stir bar to maintain a homogeneous mixture. A stainless steel frame was placed in each beaker, and the samples were placed on the frames for the duration of the test (Figure 2-3). The beakers were covered with aluminum foil to avoid loss of water.
FigLire 2-3: Water immersion setup
Only one sam ple was run in a beaker at a time in order to avoid contaminating the water with one sample and affecting the other samples because of it. Samples of the same kind were run in each bowl at a time so that the effects of the different conditions on that type of sample could be observed.
The temperature and pH of each bowl were measured daily and adjusted if necessary in order to ensure that the test conditions were stable.
The contact angles of the samples were measured before the tests began, and on the third, seventh, and tenth day of testing. which concluded the test. The samples were taken out of the bowls on each of these days and allowed to dry for 24 hours to prevent the adsorbed water on the sample from affecting the contact angle measurement.
2.4 Continuous Condensation Setup
A continuous condensation setup was used to detemine the effects of condensation on the
surface functionality. This setup is described in detail by Sack [11].
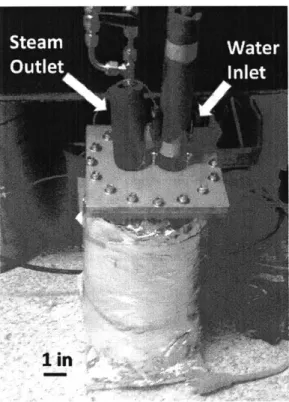
A cylindrical stainless steel canister in which water is boiled using heaters wrapped around
the outside was used as the steam generation source. The canister is covered in insulation so that the water temperature can be maintained at a constant I 000C with minimal energy consumption
(Figure 2-4).
if
1 in
Figure 2-4: Canister for continuous condensation setup
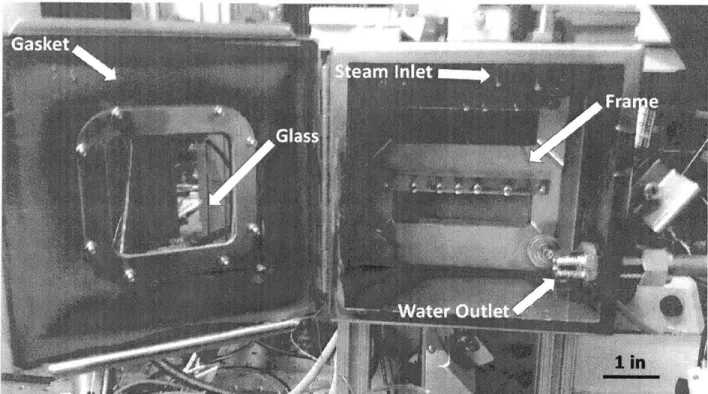
The steam in the canister flows into the condensation chamber, a stainless steel box with a frame to hold the samples. This frame is fixed to the rear wall of the chamber and has screws in it so that the samples can be secured to the rear wall. This frame also has sloped ridges so that after the water has condensed, it can flow down the side of the frames instead of staying trapped at the bottom of the sample. The steam enters the chamber from the top of the chamber and the water
that has condensed leaves the chamber from an outlet at the bottom, which connects to the canister. The chamber was tested to ensure that it is leak proof. It has a gasket on the backside of the door so that a seal is created when the door is closed. The door also has a piece of glass in the center that functions as a viewport for visual access while the test is running. This piece of glass has gaskets on either side of it, and a metal frame at its back such that when the frame is screwed into the door, a seal is created. The screws used are also fitted with rubber washers to ensure that there are no leaks (Figure 2-5).
_ 1 in
Figure 2-5: Chamber for continuous condensation setup
The chamber has a pressure relief valve that is rated for 1 psig (SS-CHS4-1, Swagelok), so that the pressure, and thus the temperature, of the steam within the chamber can be controlled. Thermocouple wires are fed through the gasket and secured to the back side of the frame so that an estimate of the sample surface temperature can be made. The water canister also has a pressure valve rated for 10 psig (SS-CHS4-10, Swagelok) so that the water temperature will not continue to rise if the controller malfunctions. To control the water heaters, a PID controller (CN7833, Omega) was used. In order to create a temperature difference between the samples and the steam, the back side of the chamber was cooled using a thermoelectric cold plate (CP-031, TE Technology). A controller (TC-48-20, TE Technology) was used to maintain the backside temperature of the chamber, and thus the sample surface temperature.
In typical industrial applications, the steam temperature is around 50'C. In order to determine the longevity of the surfaces, they were tested in more extreme conditions of 1000C steam
temperature. The backside temperature was kept at a temperature that would promote condensation, which was generally around 80'C.
Various samples were tested at a time in this case, and the samples were only measured at the
beginning and end of the test so that the continuous condensation condition would be satisfied. Thus, in order to get multiple data points, samples of the same kind were tested for different periods
18
of time, typically 3, 7, or 10 days. The contact angles of the samples were measured before and after testing.
A vacuum chamber setup was also utilized to investigate the surface degradation due to condensation at lower saturation temperatures. These tests were run at 27'C steam temperature and 25'C surface temperature. Various samples were tested for one time period of 10 days. The contact angles of the samples were measured before and after testing.
Chapter 3
Experimental Results
3.1 Contact Angle Data
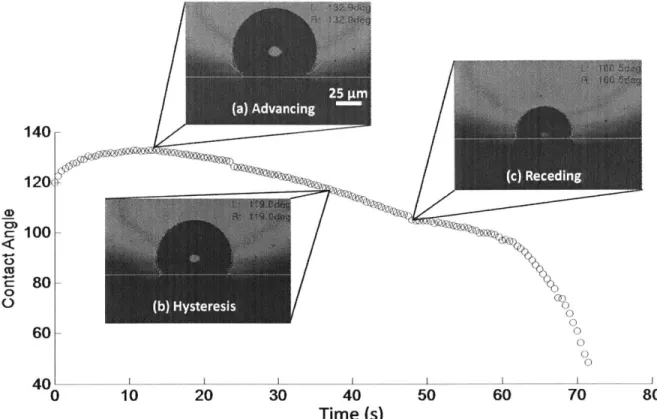
The images from the micro-goniometer of the advancing and receding droplets were analyzed using the FAMAS software (Figure 3-1 (a), (b), (c)). The software uses an ellipse fitting of the silhouette of the droplet in order to find the angle at which the droplet surface is tangent to the sample surface. To determine where the surface is, the user must draw a line on the image.
CU) 0 0 140 120, 100 80 60 X L p ,U~ 10 20 30 40 Time (s) 50 60 70 80
Figure 3-1: Plot of contact angle evolution as a water drop grows and evaporates on a hydrophobic surface. Images from FAMAS image analysis software for a droplet in the (a) advancing, (b) hysteresis, and (c) receding phase
This results in data for how the contact angle varies as the droplet grows and shrinks. To obtain the advancing and receding contact angles, the constant part of the data was extracted. This was done using Matlab. The data from FAMAS was exported as CSV files and processed using Python in order to remove non-numeric entries so that Matlab could read the files. The names of columns were converted into representative numbers so that the appropriate columns could be chosen in Matlab.
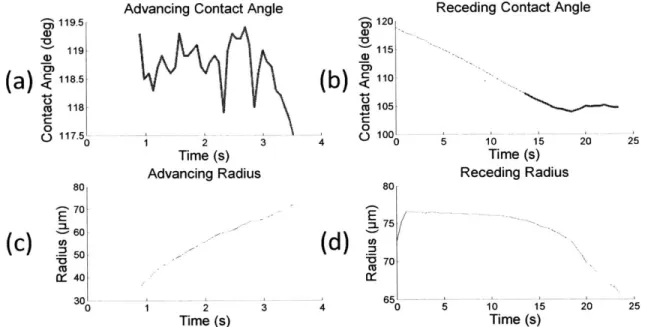
The radius as well as the contact angle data was input into Matlab from the CSV files. In theory, the contact angle should be constant when the radius is changing, but it was observed that this is not always the case. A study of advancing and receding contact angles also observed this in their
20 40'
measurements [12]. Because of this, instead of treating the contact angle data where the radius is changing as constant, the constant part of the data was obtained by finding small changes in consecutive measurements and using the longest string of data from these small changes that stayed within a certain range. This range was chosen to be 2 degrees, as this was seen to give consistent constant portions of the data (Figure 3-2).
3 119.5 119 () 118.5 (a)< c118 C 0 o117.5 80 04 070 E
(C)
Z) 060':
:5 W: 40 30' 0Advancing Contact Angle
2 Time (s) Advancing Radius 2 Time (s) 120 115 a,
(b)
<110 cu 105 0 (. 100,Receding Contact Angle
U 80 E :- 75 (d) - 70 3 4 65 0 55 5 10 15 Time (s) Receding Radius 10 15 Time (s)
Figure 3-2: (a) Advancing and (b) receding contact angle data for galvanized steel with the P2i coating, as
well as the (c) advancing and (d) receding radius of the circle that the droplet makes with the surface. The highlighted parts of (a) and (b) represent the portion of data that was taken as constant
These portions of the data were averaged to get the average contact angle for each of the sites measured. These averages were then averaged together to get the advancing and receding contact
angles for the sample. The total uncertainty (Utotal) was calculated taking into account the uncertainty of the individual measurements (Undividual) and the uncertainty of the measurements
across the sample (Uavg), as given in the equation below. For a set of N contact angle measurements
across a sample (x , x2-.xN) with uncertainties (u, u2... uN) due to variations caused by collecting
the data over time,
U.-.individual - N Uag tN-1(X1, X2 (1.4)
... XN)
N
where tN-1 is the t-factor for the degrees of freedom of N-I and G(x , x2.. xN) is the standard
deviation of the values of the measurements at different locations on the sample. The geometric sum of these two values is taken to get the total uncertainty [14].
Utotal = Uindividual2 + Uav2
20 25
20 25
(1.5)
1 3 4
I
3.2 Water Immersion Results
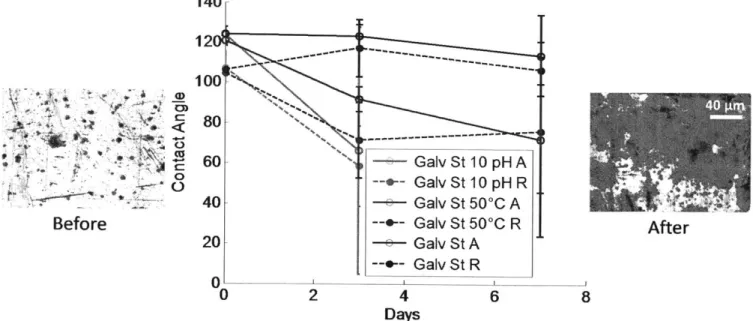
The first round of testing was done on galvanized steel samples with the P2i polymer coating (Figure 3-3). 140 12d 100 80 60 40 20 --0 2 ~~~~~~*1 --.4 1-... -- +-Galv Galv Galv Galv Galv Galv St St St St St St 4 Days 10 pHA 10 pH R 500C A 500C R A R 6
Figure 3-3: Graph of advancing (A) and receding (R) contact angles over time during water immersion testing on galvanized steel with P2i coating. Microscope images of galvanized steel surface before (left)
and after (right) testing under 10 pH conditions
As can be seen from the contact angle plots, the basic and elevated temperature conditions
resulted in degradation of the average surface functionality. The large error bars are not due to
error in the measurement of the contact angle, but rather represent the heterogeneity of the surface
after testing, as some sites measured had maintained their surface functionality while other had
completely lost it.
There were visible surface defects afterjust three days of testing. Images of the sample Linder
10 pH conditions after the last day of testing are shown above (Figure 3-3). Clear surface
heterogeneity can be seen, although it is uncertain what the black patches are. It has been proposed that a defect in the P2i coating may have started a surface oxidation process that spread throughout the sample. The sample in the images was so damaged that contact angles were unobtainable after the seventh day of testing.
Another round of water immersion testing was done on 410 stainless steel with a woods nickel strike adhesion layer and the P2i polymer coating (Figure 3-4).
22
I
9 CO) 0 Before After 8150 --- -- - - - - - -- - - - - - -0) (13w -o 41SSWNS 10pH A 0 50 --- 410 SS WNS 10 pH R 410 SS WNS 500C A -+- 410 SS WNS 500C R 410 SS WNS A S-+.- 410 SS WNS R 0 0 2 4 6 8 10 12 Days
Figure 3-4: Graph of advancing (A) and receding (R) contact angles over time during water immersion testing on 410 stainless steel with a woods nickel strike adhesion layer and the P2i coating
As can be seen from the plots, the normal conditions did not show much degradation in surface ftinctionality. This indicates that the water itself does not affect the coating. However, the 10 pH solution did show a decrease in the receding contact angle over the testing period. It has been proposed that there is a chemical reaction occurring between the basic solution and the coating. A specific mechanism behind this potential reaction is being investigated. The 50'C conditions also showed a decrease in the receding angle over the testing period. It has been proposed previously
by Sack that this decrease is caused by the mismatch of thermal expansion coefficients of the
materials on the surface [11]. This mismatch may cause stresses within the nanostructures, and thus the coating, which would initiate a defect in either the coating or the nanostructures, both of which would result in decreased surface functionality, as the hydrophilic metal substrate beneath would be exposed. This exposed metal would serve as a potential pinning site and prevent droplets from departing the surface at the size that they would on an undamaged surface.
Another round of testing was done on 410 stainless steel with a woods nickel strike adhesion layer, zinc oxide nanostructures, and the P2i coating, with the difference between this and the last test being the addition of the zinc oxide nanostructures (Figure 3-5)
180 160.--140 _ 120 < 100 80 - 410 SS WNS ZnO 10 pH A 0 -- 410 SS WNS ZnO 10 pH R 60 410 SS WNS ZnO 50'C A 40 --- 410 SS WNS ZnO 50'C R 041SS WNS ZnO A 20 ---410 SS WNS ZnO R 0 0 2 4 6 8 Days
Figure 3-5: Graph of advancing (A) and receding (R) contact angles over time during water immersion testing on 410 stainless steel with a woods nickel strike adhesion layer, zinc oxide nanostructures, and a P2i coating
As can be seen frorn the plots, the surface performance showed little degradation over the period of testing. Even though this round of tests has only been completed up to the 7 th day, the
contact angles for the 7"' day for the previous round of tests should have a significant decrease
from the original values, whereas the contact angles for this test have no change within error. This seems to indicate that the decreased adhesion of water to the surface is causing the surface functionality to be maintained.
3.3 Elevated Temperature (1004C) Continuous Condensation Results
There was one round of 1 000C continuous condensation testing done on a 316 stainless steel sample with P2i, a silicon sample with P2i, and a copper sample with P2i (Figure 3-6).
150 100 c--4 0 C-) 50 316 SS A 316 SS R Si A Si R CuA Cu R 0 0 2 4 6 8 10 12 Days
Figure 3-6: Graph of advancing and receding contact angles of 316 stainless steel with the P2i coating,
silicon with the PWi coating, and copper with the P2i coating during 100 C continuous condensation
These samples all showed a decrease in the contact angle over time. As can be seen from the plots, there was a similar decrease in contact angle between the three day test and the ten day test. This is proposed to be due to the unstable conditions of the chamber during the three day test. At times the backside temperature of the chamber would drop to a low temperature, with the lowest observed temperature around 25'C, which accelerated the condensation conditions even further than the high steam temperature alone.
If there had been stable conditions, the results shown above would indicate that the surface
functionality dropped substantially very early in the test period, but due to the variable chamber conditions it is unclear whether the results are caused by the large temperature differences that occurred or the condensation process itself. No further tests were run on this setup due to the heavy monitoring that was necessary to maintain stable conditions. The setup has been improved with a more reliable controller that should keep the chamber conditions stable and thus provide results that better represent the situation.
3.4 Ambient Temperature (27*C) Continuous Condensation Results
There was one round of testing done on a copper sample with P2i and a 316 stainless steel
140 120 100 0) < 80 60 C) 40 Cu A Cu R 20 316 SS A --- 316 SS R 0 0 2 4 6 8 Days
Figure 3-7: Graph of advancing and receding contact angles for copper with a P2i coating and 316 stainless steel with a P2i coating
As can be seen from the plots, the receding contact angle decreased substantially between the beginning and the end of the test. This is similar to what was seen in the previous test at a higher temperature, but the conditions were much more stable in this test chamber and so these results more accurately represent the situation. The decrease in contact angle indicates that the P2i coating degraded over the course of the test period. The water used in the boiling container is deionized water which is neutral and so wouldn't have any potential reaction with the coating due to pH levels. The temperature also shouldn't be causing any stresses within the coating because the temperature conditions in this chamber are similar to room temperature, the temperature at which the coating has no thermal stresses. Thus it is proposed that the surface functionality deterioration is due to mechanical stresses caused by the water droplets sliding down then surface. A flow setup will be utilized to investigate this mechanism of deterioration.
Testing under the 27'C steam temperature conditions was also done on a 316 stainless steel sample with zinc oxide nanostructures and the P2i coating, a 3 16 stainless steel sample with a woods nickel strike adhesion layer, zinc oxide nanostructures, and the P2i coating, and a copper sample with copper oxide nanostructures and the P2i coating (Figure 3-8).
160 f'~ ~ 140 , 120 100 C) 80 60 40 20 0 0 -- 316 SS WNS ZnO A 316 SS WNS ZnO R 316 SS ZnO A --- 316 SS ZnO R Cu CuO A --- Cu CuO R 2 4 Days 6 8
Figure 3-8: Graph of advancing and receding contact angles during continuous condensation at 25'C for 316 stainless steel with zinc oxide nanostructures and P2i coating, 3 16 stainless steel with a woods nickel strike adhesion layer, zinc oxide nanostructures, and P2i coating, and copper with copper oxide
nanostructures and P2i coating.
As can be seen from the plots, there was very little change in the contact angle for these samples. The only sample with a receding angle that didn't change within the 95% confidence interval was the copper sample. A magnified plot of the results for copper is shown below (Figure
3-9) 174 172 170 168 0) 0 C) 166 164 162 160 Advan - Reced 0 cing ing 2 4 Days 6 8
Figure 3-9: Graph of advancing and receding contact angles during continuous condensation at 25'C for
copper with copper oxide nanostructures and a P2i coating.
27
The average receding contact angle measured across the sample changes by about 6', which is a minimal decrease when compared to the more than 60' decreases observed on the non-nanostructured copper sample in the same test. This indicates that the surface functionality is maintained after the surface undergoes condensation with these conditions and for this time period. However, longer time periods would need to be tested in order to determine whether this trend will continue.
Chapter 4
Conclusions and Future Work
4.1 Conclusions
Hydrophobic and superhydrophobic samples underwent water immersion testing for a span of 10 days. The hydrophobic samples showed significant decreases in the receding contact angle across the sample under basic solution (pH ~ 10) and elevated temperature conditions, while the superhydrophobic samples showed little change in surface functionality for all conditions. Hydrophobic and superhydrophobic samples also underwent continuous condensation testing at 25'C for a span of 10 days and 100'C for a span of 7 days. The hydrophobic samples showed significant decreases in the receding contact angle for both temperature conditions. The superhydrophobic samples, tested at 25'C, again showed little change in surface functionality.
Based on the water immersion testing, it is proposed that the decreased contact area between the water and the surface due to the nanostructures is inhibiting the mechanism behind the deterioration of the coating in the basic solution that is seen with the non-nanostructured samples. This would allow the superhydrophobic surfaces to maintain their surface functionality in the basic conditions where the hydrophobic surfaces didn't. As for the elevated temperature conditions, it is unclear why the superhydrophobic surfaces were able to maintain their surface functionality when the hydrophobic surface didn't. The thermal stresses due to mismatching thermal expansion coefficients of the materials on the sample would still be expected to occur with the nanostructures if they occurred without.
Based on the continuous condensation testing, it is proposed that the decreased droplet departure size, which is a result of the decreased contact area between the water and the surface due to the nanostructures, is decreasing the mechanical stresses caused by the droplet departure process. Because the droplets on the superhydrophobic surfaces have a smaller mass than the droplets on the hydrophobic surfaces due to their size, the maximum amount of friction force felt by the surface should be smaller. This would prevent the coating from separating from the surface if the friction force is less than the adhesive force between the coating and the nanostructures, and this appears to be the case based on the results of the testing.
4.2 Future Work
The conclusions drawn here were based on observations made after testing that was done over the course of a maximum of ten days. In order to further validate the trends seen in the results of this testing, the experiments will be carried out for longer periods of time.
Also, in order to investigate the role of shear on the deterioration of the surfaces, water should be run over the surfaces for extended periods of time, and the results from those tests should be compared with the results of the continuous condensation tests. If there is no surface functionality deterioration after the flow testing on the hydrophobic samples, it could be concluded that the shear has little effect on the surface during condensation. Otherwise, if there is surface functionality deterioration similar to what was observed in the continuous condensation tests, it is likely that the shear stress caused by the water running down the surface is removing the hydrophobic coating, thus causing the surface to lose its superhydrophobic properties.
References
[1] "ORGANIC RANKINE CYCLE." Turboden: Clean Energy Ahead. Turboden, n.d. Web. 22 Apr. 2016. http://www.turboden.eu/en/rankine/rankine-history.php
[2] Schilling, H.D., Prospects of power plant technology. VGB Kraftwerkstechnik, 1993. 73(8): p. 658-670
[3] J. L. Tsou, J. Maulbetsch, and J. Shi, "Power plant cooling system overview for researchers and technology developers," tech. rep., 2013.
[4] T.L Bergman, A. S. Lavine, F. P. Incropera, and D. P. Dewitt. Fundamentals of Heat and Mass Transfer, 7 th ed. 2011.
[5] D. J. Preston, Electrostatic Charging of Jumping Droplets on Superhydrophobic Nanostructured Surfaces: Fundamental Study and Applications. PhD thesis, 2014.
[6] N. Miljkovic, Development and Characterization of Micro / Nanostructured Surfaces for Enhanced Condensation. PhD thesis, 2013.
[7] 1. Tanasawa. "Advances in Condensation Heat Transfer,"
http://www.sciencedirect.com/science/article/pii/S0065271708703344
[8] "Information on Contact Angles," http://www.ramehart.com/contactangle.htm
[9] P.-G. de Gennes, F. Brochard-Wyart, and D. Quere, Capillarity and Wetting Phenomena Drops, Bubbles, Pearls, Waves. Springer, english tr ed., 2004.
[10] Jack D. Dunitz, Robin Taylor, "Organic Fluorine Hardly Ever Accepts Hydrogen Bonds," http://onlinelibrary.wiley.co/doi/10.1002/chem.19970030115/abstract
[11] J. Sack, Fabrication and Robustness Testing of Superhydrophobic Nanostructured Surfaces for Enhanced Jumping Condensation. Masters thesis, 2015.
[12] C. N. C. Lam, "Study of advancing and receding contact angles: liquid sorption as a cause of contact angle hysteresis,"
http://www.sciencedirect.com/science/article/pii/S000 18686010008OX
[13] S. Coulson, "Microfabricated devices with coated of modified surface and method of making same," 2012.
[14] B. Hughey, "Averaging Values with Uncertainty,"
https://wikis.mit.edu/confluence/display/2DOT67 1 /CASE+ 1 A+Averaging+Values+with+Uncert ainty

![Figure 1-5: Schematic of the contact angle 0 of a liquid droplet on a solid surface [8]](https://thumb-eu.123doks.com/thumbv2/123doknet/14250358.488113/11.918.220.628.774.930/figure-schematic-contact-angle-liquid-droplet-solid-surface.webp)