HAL Id: inria-00369376
https://hal.inria.fr/inria-00369376
Submitted on 19 Mar 2009
HAL is a multi-disciplinary open access
archive for the deposit and dissemination of
sci-entific research documents, whether they are
pub-lished or not. The documents may come from
teaching and research institutions in France or
abroad, or from public or private research centers.
L’archive ouverte pluridisciplinaire HAL, est
destinée au dépôt et à la diffusion de documents
scientifiques de niveau recherche, publiés ou non,
émanant des établissements d’enseignement et de
recherche français ou étrangers, des laboratoires
publics ou privés.
Automatic Relevance Determination in Nonnegative
Matrix Factorization
Vincent Y. F. Tan, Cédric Févotte
To cite this version:
Vincent Y. F. Tan, Cédric Févotte. Automatic Relevance Determination in Nonnegative Matrix
Factorization. SPARS’09 - Signal Processing with Adaptive Sparse Structured Representations, Inria
Rennes - Bretagne Atlantique, Apr 2009, Saint Malo, United Kingdom. �inria-00369376�
Automatic Relevance Determination in
Nonnegative Matrix Factorization
Vincent Y. F. Tan
Lab. for Info. and Decision Systems, Massachusetts Institute of Technology,
Cambridge, MA 02139 Email: [email protected]
C´edric F´evotte
CNRS LTCI; TELECOM ParisTech 37-39 rue Dareau
75014 Paris, France Email: [email protected]
Abstract—Nonnegative matrix factorization (NMF) has be-come a popular technique for data analysis and dimensionality reduction. However, it is often assumed that the number of latent dimensions (or components) is given. In practice, one must choose a suitable value depending on the data and/or setting. In this paper, we address this important issue by using a Bayesian approach to estimate the latent dimensionality, or equivalently, select the model order. This is achieved via automatic relevance determination (ARD), a technique that has been employed in Bayesian PCA and sparse Bayesian learning. We show via experiments on synthetic data that our technique is able to recover the correct number of components, while it is also able to recover an effective number of components from real datasets such as the MIT CBCL dataset.
Index Terms—Nonnegative matrix factorization, Bayesian model selection, Automatic relevance determination.
I. INTRODUCTION
Nonnegative matrix factorization (NMF) [7] is a widely used technique that is employed for non-subtractive, part-based representation of nonnegative data. There are numer-ous diverse applications of NMF including audio signal processing [5], image classification [6] and email surveil-lance [1]. Given a nonnegative data matrix V ∈ RF ×N+ ,
NMF essentially involves finding two nonnegative matri-ces, namely W = [w1, . . . , wK] ∈ RF ×K+ and H =
[hT
1, . . . hTK]T ∈ RK×N+ such that
V≈ ˆV= W H.∆ (1)
K is usually chosen such that F K + KN ≪ F N , hence reducing the data dimension. NMF is also usually performed by minimizing a pre-specified cost functionD(V|WH) over W and H.
In practice, however, it is often hard to “guess” the effec-tive dimension of the latent subspaceKeff i.e. the effective
number of columns of W (and the number of rows of H). To ameliorate this problem, in this paper, we formulate a Bayesian approach to find the effective dimensionality Keff via automatic relevance determination [8]. This model
selection technique was also used by Bishop to determine Keff in the context of Bayesian PCA [2] and by Tipping in
sparse Bayesian learning [10]. It is important to discover Keff because we would like a parsimonious (sparse) yet
accurate representation of the nonnegative data. Sparsity here refers to the total number of coefficientsK(F + N ) ≪ F N required to encode the data, and not only to H as in the standard sparse linear regression setting where the dictionary W is known and fixed.
A. Main contributions
To solve this important model selection problem, we place priors, dependent on precision-like parameters β = [β1, . . . , βK] ∈ RK+, on both the columns of W and the rows
of H. The values of these hyperparameters, together with the values of W and H are inferred iteratively by maximizing the posterior of the parameters given the data. As a result of this optimization, a subset of the βk’s will be driven to
a large upper bound [2], [8], corresponding to irrelevant components. More precisely, we seek to find W∗
, H∗
, β∗
by optimizing the maximum a-posteriori (MAP) criterion: min
W,H,βCMAP(W, H, β) ∆
= − log p(W, H, β|V), (2) where, by Bayes rule, the posterior can be written as
− log p(W, H, β|V)= − log p(V|W, H)c
− log p(W|β) − log p(H|β) − log p(β). (3) We use = to denote equality up to a constant. Forc some statistical models, maximizing the log-likelihood term log p(V|W, H) in (3) over (W, H) is equivalent to minimizing a specific cost function (or measure of fit) D(V|WH) over (W, H). For instance, maximum likeli-hood estimation of W and H in Poisson noise model cor-responds to minimizing the (generalized) Kullback-Leibler (KL) divergenceDKL(V|WH) = DKL(V| ˆV), where DKL(V| ˆV)=∆ X f n vf nlog µ vf n ˆ vf n ¶ − vf n+ ˆvf n. (4)
We focus on the KL-divergence as our cost function in this paper because it has been extensively used in NMF and is free of noise parameters. The model order selection technique we present in this paper naturally extends to other cost functions such as the Euclidean distance or Itakura-Saito divergence, that may also be mapped to log-likelihood functions [5]. The Euclidean or Itakura-Saito cost functions, however, require the specification or inference of noise parameters. We show in Section IV that our method is able to recover the correct number of components for synthetic datasets, including the Swimmer dataset [4], and an effective number of component for the MIT CBCL face dataset.
B. Related Work
There is generally little literature about model order selection in NMF. Variational Bayesian methods have been
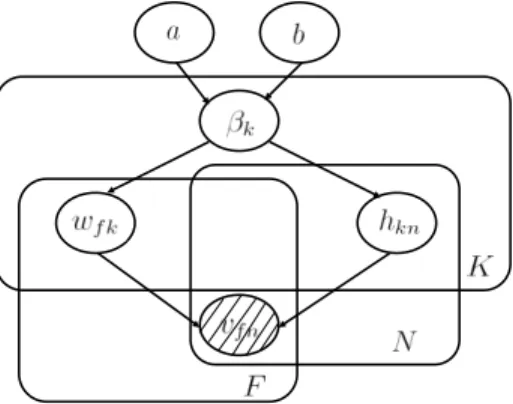
Figure 1: A directed graphical model that describes our NMF statistical model. The plate notation is used here. The plate (or rectangle) is used to group random variables that repeat. The number of replicates is shown on the bottom right corner. The shaded variables{vf n} are the observations.
considered for this task [3], [11] but this type of approach is fairly computationally demanding and require successive evaluation of the evidence (or marginal likelihood) for each considered value of K. Instead, our method automatically finds the optimal model orderKeff given a large initial value
of K and is computationally less involving.
The methodology presented in this work bears resem-blance with existing multiplicative NMF algorithms with a sparseness constraint on the whole matrix H (typically, adding a kHk1 or kHk0 regularization term to the cost
function D(VkWH)), with which is was noted that the sparseness constraint may turn off excess components [9]. Here, we do not impose sparseness per se on either W or H, but rather assign a relevance weightβk to each rank-1
matrix wkhk, which is learnt from the data.
II. BAYESIANNMFMODEL
In this section, we describe our statistical model. We will describe in detail each of the terms in (3), namely the log-likelihood termlog p(V|W, H) and the log-prior terms log p(W|β), log p(H|β) and log p(β).
A. Likelihood model
We assume that the log-likelihood of a single element of the matrix V, denotedp(vf n|ˆvf n), is given by P(vf n|ˆvf n),
whereP(x|λ) = e−λλx/Γ(x + 1) is the Poisson probability
density function with rateλ. Thus, E[vf n|ˆvf n] = ˆvf n. The
log-likelihood can then be written as: − logp(V|W, H) = DKL(V|WH)
+X
f n
vf n(1 − log vf n) + log Γ(vf n+ 1). (5)
Thus, maximizing the log-likelihood (based on the Poisson noise model) is equivalent to minimizing the KL-divergence since other terms in (5) are independent of W and H.
B. Prior model on W and H
In Bayesian PCA [2], each columnk of W (resp. row k of H) is given a normal prior with precision parameterβk
(resp. 1). Thanks to the simplicity of the statistical model (multivariate Gaussian observations with Gaussian parameter priors), H can be easily integrated out of the likelihood, and
optimization can be done over p(W, β|V). This marginal-ization step is not easily done in NMF. However, similar in spirit to Bayesian PCA, we define independent half-normal priors over each columnk of W and row k of H, and the priors are tied together through a single, common precision parameterβk.1 More precisely, we set
p(wf k|βk) = HN (wf k|0, βk−1), (6) p(hkn|βk) = HN (hkn|0, βk−1), (7) where HN (x|0, β−1) =r 2 πβ −1/2exp µ −1 2βx 2 ¶ (8) is the half-normal probability density function (defined for x ≥ 0) parameterized by the precision (inverse variance) β.2
From (6) and (7), we see that the minus log-priors can be written as: − log p(W|β) =c X k X f 1 2βkw 2 f k− F 2 log βk, (9) − log p(H|β) =c X k X n 1 2βkh 2 kn− N 2 log βk.(10) As a result of inference, a subset of theβk’s will be driven to
a large upper bound, with the corresponding columns of W and rows of H driven to small values, by (8). The effective dimensionality can be deduced from the distribution of the βk’s, from which, we have found in practice, two clusters
clearly emerge : a group of values in same order of magni-tude corresponding to relevant components and a group of similar values of much higher magnitude corresponding to irrelevant components. We may then defineKef f as
Keff ∆
= |{βk : βk< Lk− ǫ}|, (11)
where Lk is the upper bound dependent on the prior’s
parameters and ǫ > 0 is a user-defined small constant. We will specify a precise value forLk in termsF , N and the
parameters of the prior onβk in Section III.
This Bayesian approach based on ARD automatically determines the number of components in V, thus elegantly finding a solution for the odd dichotomy between finding the best model for the training data to the model and avoiding overfitting. Furthermore, the size of βk provides
an approximate measure of its relevance. If βk is large
(variance 1/βk is small), then this component is not very
relevant for the modeling of the data. Conversely, if βk is
small (variance1/βkis large), the corresponding component
contains a significant amount of energy. We term βk the
relevance weight associated to componentk.
We remark that it is also possible to let W be dependent of β and let H be independent of β. In this setup, we place a prior on the columns of W only. Doing this is akin to Bayesian PCA [2]. However, in our experiments, we found convincing evidence that tying wk andhk together with the
same prior structure and precision parameter is better for recovery of the number of components. It is also possible 1Note that this prior is not overconstraining the scales, because of the
scale indeterminacy between wkand hk.
2If X is a zero mean normal random variable with variance β−1, then
|X| is a half-normal random variable with precision β.
to put exponential distributions, (dependent on the precision parameters β1, . . . , βK) instead half-normals, on either W
or H (or both). Indeed, the inference method described next would only need minor changes to accomodate other priors.
C. Prior model on β
Finally, each precision parameter βk is given a Gamma
distribution, which is conjugate to the half-normal density function (8). Thus, p(βk|ak, bk) = bak k Γ(ak) βak−1 k exp(−βkbk), βk ≥ 0, (12)
and the (minus) log-prior of β is given as − log p(β)=c X
k
bkβk− (ak− 1) log βk. (13)
In our experiments, the hyperparameters ak and bk (also
known as shape and scale parameters) are fixed to a pre-specified common value, say a and b. Thus, all the upper boundsLk= L, some constant dependent on a, b.
D. Overall Model and Cost Function
All the terms in in the MAP criterion (3) have been defined. The dependences between the variables can be rep-resented by a directed graphical model (Bayesian network) as shown in Fig. 1. The observations{vf n} are contained in
the matrix V and we would like to infer W, H and β. The number of βk’s that is less than the upper boundLk− ǫ is
the effective dimensionality of the data.
By combining equations (5), (9), (10) and (12), the overall MAP objective to be minimized can be written as
− log p(W, H, β|V)= Dc KL(V|W, H) +1 2 X k "Ã X f w2f k+ X n h2kn+ 2bk ! βk − (F + N − 2(ak− 1)) log βk # . (14)
From this expression, we see a tradeoff involving the size of the βk’s. Since F + N is typically larger than 2(ak− 1), a
largerβk’s will result in a smaller (more negative) last term.
However, the second to last term in the sum forces some of the βk’s to remain small since it is a linear function ofβk.
III. INFERENCE
In [7], the authors proposed efficient coordinate descent algorithms with suitable step sizes which are then turned into multiplicative update rules. This simple yet effective procedure has the advantage of maintaining nonnegativity of the inferred matrices W and H. The same procedure can be applied to our model to infer W, H as well as β. We first find the gradient of the MAP criterion CMAP with respect
to W, H andβk. ∇WCMAP(W, H, β) = µ WH− V WH ¶ HT + Wdiag (β) , (15) ∇HCMAP(W, H, β) = WT µ WH− V WH ¶ + diag (β) H, (16)
Algorithm 1 Automatic relevance determination for NMF with the KL-divergence cost
Input : Nonnegative data (observation) matrix V, fixed hyperparametersak,bk.
Output : Nonnegative matrices W and H such that V≈ ˆ
V= W H, a nonnegative vector β and Keff. Initialize W and H to nonnegative values. fori = 1 : niter do H← H WT1 F ×N+diag(β)H· £WT¡ V WH ¢¤ W← W 1F ×NHT +Wdiag(β)· £¡ V WH¢ H T¤ β← 1 F +N +2(a−1) 1×F(W·W)+(H·H)1N ×1+2b end for ComputeKeff as in (11). ∇βkCMAP(W, H,β) = 1 2 X f w2f k+ 1 2 X n h2kn+ bk −µ 1 2(N + F ) + ak− 1 ¶ 1 βk . (17)
where we use the notation AB to denote entry-wise division
of A by B. The multiplicative coordinate descent algorithm is simple; we simply update each parameterθ of W and H by multiplying its current value with the ratio of the positive [·]+ to negative[·]− part of the derivative ofCMAP (in (15)
and (16)) with respect toθ i.e.,
θ ← θ[∇θCMAP(θ)]+ [∇θCMAP(θ)]−
. (18)
The precision parameters βk are updated by zeroing (17)
i.e., βk ← 1 2(F + N ) + ak− 1 1 2( P fw2f k+ P nh2kn) + bk . (19)
The overall algorithm is summarized in Algorithm 1. We observed in practice the monotonicity of the MAP criterion in (2) under this algorithm.
We now address the issue of choosing Lk = L in (11).
From (19), we can easily derive an upper bound on βk,
which is dependent only on a and b, since we set ak = a
andbk = b:
βk≤ F + N + 2(a − 1)
2b . (20)
The bound is attained whenwf k = hkn = 0 for all f, n, k
i.e., the columns and rows of W and H are exactly zero. Thus, a good choice of L is precisely the right-hand-side of (20). Hence, we define
L∆=F + N + 2(a − 1)
b , (21)
and the constant L will enable us to determine Keff from
the set ofβk’s from (11).
It is worth noting that other inference algorithms (on graphs) such as variational Bayes or Gibbs sampling may be employed to find the posterior distributions of the parameters of interest. In this paper, we are only interested in point estimates of W, H and β, hence the efficient multiplicative update rules suffice.
Figure 2: The W and H matrices showing that Keff= 5columns are retained. The other columns of W and rows of H are set to 0.
0 1000 2000 3000 4000 5000 0 2 4 6 8 10 Iteration Number β k
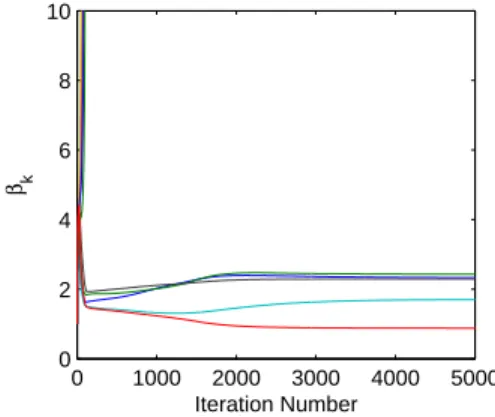
Figure 3: Convergence of β. Note that K− Keff= 5components diverge to a large value.
IV. NUMERICALRESULTS
In this section, we describe some experiments on synthetic and real data that demonstrate the efficacy of our algorithm for model order selection in NMF.
A. Synthetic Data
Our synthetic data was generated in the following fashion: W and H are100 × 10 and 10 × 1000 matrices respectively. Each element in the first 5 columns of W (and the first 5 rows of H) are drawn uniformly from a half normal distribu-tion HN (0, 10) while the remaining 5 columns (remaining 5 rows of H) are drawn fromHN (0, 1). Thus the effective dimensionality isKeff = 5. The 100 × 1000 data matrix V
was formed by multiplying W and H. The hyperparameters were set to a = b = 1, though in practice we found that the algorithm is not very sensitive to the choice of hyperparameters for the synthetic data. In Figs 2, we see that the algorithm correctly recovers the correct dimensionality of the data even though Rank(V) = K = 10 with probability 1. In Fig 3, we observe that K − Keff = 5 βk’s diverge to
a large value, which means that 5 columns of W (and 5 rows of H) are irrelevant for the purpose of modeling the N = 1000 data samples. We repeated the same procedure by fixingK = 10 and varied Keff from 1 to 5. The algorithm
correctly recoversKeff in each case.
B. Swimmer Dataset
We also performed some experiments on another synthetic dataset, namely the well-known swimmer dataset [4], which depicts a figure with four moving parts (limbs), each able to exhibit four articulations (different positions). Thus, there are a total ofN = 44= 256 images each of size F = 32 × 32.
Sample images are shown in Fig. 4. The objective here
Figure 4: Sample images from the Swimmer dataset.
0 10 20 30 40 0 5 10 15 20 b Keff
Figure 5: Regularization Path for Swimmer Dataset. The effective number of components Keffis plotted against b, a parameter of the Gamma prior distribution in (12).
is to discover that the dataset contains 16 basis elements, corresponding to the 16 limb positions. Thus, Keff = 16.
We setK = 50. In this experiment, we also found that we could retrieve the correct number of components, ifb in the Gamma prior in (12) is larger than some threshold value. Keeping a fixed at 2, we plotted the regularization path in Fig. 5. The regularization path shows howKeff changes asb
in the Gamma prior in (12) changes, while being insensitive to the precise value of a. The components, which are the limbs, are plotted in Fig. 6 for b = 18. We see that each of the 16 limb positions is correctly recovered, together with the torso. All the relevance weights corresponding to the relevant components are equal, by equivalence of all the “parts” represented in the dataset (βk = 2.57 for all
k = 1, . . . , Keff). This experiment further validates our
technique of automatically discovering the number of latent components in the nonnegative data.
Figure 6: Basis images obtained by performing NMF on the Swimmer dataset. The 16 limb positions of the swimmer dataset are correctly recovered if b≥ 18. All the relevance weights {βk} are equal by symmetry.
0 10 20 30 40 0 5 10 15 b Keff
Figure 7: Regularization Path for MIT CBCL Dataset.
C. MIT CBCL Faces Dataset
Finally, we applied our model order selection procedure to the CBCL face dataset, containing F = 19 × 19 images, preprocessed as in [7], i.e., the greyscale intensities of each image were linearly scaled so that the pixel mean and standard deviation were equal to 0.25, and then clipped to the range [0,1]. The training set containsN = 2429 images. Keeping a (the shape parameter in the Gamma prior in (12)) fixed at 2, we plot the regularization path in Fig. 7, i.e., the effective number of components Keff against the
scale parameterb. This figure shows that if b is above some threshold value, the number of componentsKeff stabilizes at
a constant value (Keff = 12). K was set to 49 initially. For
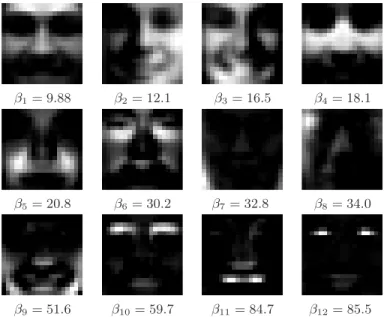
instance, if we setb = 25, we observe that 12 basis images (columns of W) are recovered. These are shown in Fig. 8, together with the corresponding the relevance weights βk’s.
They correspond to several parts of the faces : we roughly obtain left, right, top and bottom halves, background artifacts and eyes/eyebrows, mouth and nose parts.
Our adaptation of ARD to NMF allows us to automatically discover a latent dimensionality of this dataset and the recovered basis images make intuitive sense. However they are not as local as the one obtained with the standard NMF algorithm with K set to 49, as in the original experiment by Lee & Seung [7]. Other prior structures (such as the exponential distribution instead of the half-normal, or even sharper priors) may lead to more local features. However the results are subjective in every case and should instead be evaluated on well-defined tasks such as classification.
V. CONCLUSIONS
We have presented a Bayesian approach that performs model order selection for NMF by borrowing ideas from ARD. By placing appropriate prior distributions on the elements on W and H, we are able to identify those components that are ‘relevant’ for modeling the data. The efficacy of our method was adequately demonstrated in our experiments where we are able to recover the latent dimensionality of synthetic and real data.
Indeed, our method is not limited to the use of the generalized KL-divergence; we could, in fact, adapt the updates in a very straightforward manner for the Euclidean or Itakura-Saito costs and also use other types of priors. Furthermore, our method can be extended for the purpose of nonnegative tensor decomposition (NTD). Our preliminary results show that it is possible to recover the correct number of components from a synthetically generated 3-way tensor
β1= 9.88 β2= 12.1 β3= 16.5 β4 = 18.1
β5= 20.8 β6= 30.2 β7= 32.8 β8 = 34.0
β9= 51.6 β10= 59.7 β11= 84.7 β12= 85.5 Figure 8: Basis images (reordered) and their corresponding rele-vance weights{βk} obtained by performing Bayesian model order selection using ARD for NMF on the MIT CBCL dataset. The images correspond to the parts of the face including left, right, top and bottom halves, the eyes, the mouth, background and nose.
formed from the parallel factor analysis (PARAFAC), also named canonical decomposition (CANDECOMP), model. We hope to further extend the theory and experimentation for tensor decomposition in a longer paper.
Acknowledgements
The work of V. Y. F. Tan was supported by A*STAR, Singapore, and by a MURI funded through ARO Grant W911NF-06-1-0076. C. F´evotte acknowledges support from the ANR - SARAH project (Standardisation du Remastering Audio Haute-d´efinition).
REFERENCES
[1] M. W. Berry and M. Browne. Email Surveillance Using Non-negative Matrix Factorization. Computational and Mathematical Organization
Theory, 11(3):249–264, 2005.
[2] C. M. Bishop. Bayesian PCA. In Advances in Neural Information
Processing Systems, pages 382–388, 1999.
[3] A. T. Cemgil. Bayesian Inference for Nonnegative Matrix Factorisa-tion Models. Technical Report CUED/F-INFENG/TR.609, Cambridge University Engineering Department, Jul 2008.
[4] D. Donoho and V. Stodden. When does non-negative matrix factoriza-tion give a correct decomposifactoriza-tion into parts? In Advances in Neural
Information Processing Systems, 2003.
[5] C. F´evotte, N. Bertin, and J.-L. Durrieu. Nonnegative matrix factor-ization with the Itakura-Saito divergence with application to music analysis. Neural Computation, 21(3), 2009.
[6] D. Guillamet, B. Schiele, and J. Vitri. Analyzing non-negative matrix factorization for image classification. In Internat. Conf. Pattern
Recognition, 2002.
[7] D. D. Lee and H. S. Seung. Learning the parts of objects by non-negative matrix factorization. Nature, 1999.
[8] D. J. C. Mackay. Probable networks and plausible predictions – a review of practical Bayesian models for supervised neural networks.
Network: Computation in Neural Systems, 6(3):469–505, 1995.
[9] M. Mørup, K. H. Madsen, and L. K. Hansen. Approximate L0 con-strained non-negative matrix and tensor factorization. In Proc. IEEE
International Symposium on Circuits and Systems (ISCAS’08), 2008.
[10] M. E. Tipping. Sparse Bayesian Learning and the Relevance Vector Machine. Journal of Machine Learning Research, 1:211 – 244, Sep 2001.
[11] O. Winther and K. B. Petersen. Bayesian independent component analysis: Variational methods and non-negative decompositions.
Dig-ital Signal Processing, 17(5):858–872, Sep. 2007.