HAL Id: hal-01622341
https://hal.umontpellier.fr/hal-01622341
Submitted on 10 Nov 2017HAL is a multi-disciplinary open access archive for the deposit and dissemination of sci-entific research documents, whether they are pub-lished or not. The documents may come from teaching and research institutions in France or abroad, or from public or private research centers.
L’archive ouverte pluridisciplinaire HAL, est destinée au dépôt et à la diffusion de documents scientifiques de niveau recherche, publiés ou non, émanant des établissements d’enseignement et de recherche français ou étrangers, des laboratoires publics ou privés.
Cortical motor output decreases after neuromuscular
fatigue induced by electrical stimulation of the plantar
flexor muscles
Francois Alexandre, Gerard Derosiere, Maria Papaiordanidou, Maxime Billot,
Alain Varray
To cite this version:
Francois Alexandre, Gerard Derosiere, Maria Papaiordanidou, Maxime Billot, Alain Varray. Cortical motor output decreases after neuromuscular fatigue induced by electrical stimulation of the plantar flexor muscles. Acta Physiologica, Wiley, 2015, 214 (1), pp.124-134. �10.1111/apha.12478�. �hal-01622341�
Cortical motor output decreases after neuromuscular fatigue induced by electrical stimulation of the plantar flexor muscles
François Alexandre a,b, GerardDerosiere a,c,2, MariaPapaiordanidou a,d, Maxime Billot a,1,
AlainVarray a
Affiliations:
a, Movement To Health, Euromov, Montpellier University, Montpellier, France
b, Clinique du Souffle "la Vallonie", Fontalvie, Lodève, France
c, Biomedical Engineering Research Group, National University of Ireland, Maynooth, Co
Kildare, Ireland
d, Institut des Sciences du Mouvement, Aix-Marseille University, Marseille, France
Corresponding author
François Alexandre, Movement to Health, Faculty of Sports Sciences, Montpellier University,
Euromov, 700 Avenue du Pic Saint Loup, 34090, Montpellier, France.
Tel.: + 33. (0)434.432.632; Fax: + 33. (0)434.432.644
E-mail: francois.alexandre@fontalvie.fr
Present adress:
1, Faculté de médecine, Département de kinésiologie, Université Laval, Québec, Canada
2, Cognition and Actions Laboratory, Institute of Neuroscience, Université catholique de
Louvain, Brussels, Belgium
Abstract
Aim: Neuromuscular electrical stimulation (NMES) causes early onset of neuromuscular
fatigue. Peripheral electrophysiological explorations suggest that supra-spinal alterations are
involved through sensitive afferent pathways. As sensory input is projected over the primary
somatosensory cortex (S1), S1 area involvement in inhibiting the central motor drive can be
hypothesized. This study assessed cortical activity under a fatiguing NMES protocol at low
frequency.
Methods: Twenty healthy males performed five NMES sequences of 17 trains over the
plantar flexors (30 Hz, 4s on/6s off). Before and after each sequence, neuromuscular tests
composed of maximal voluntary contractions (MVCs) were carried out. Cortical activity was
assessed during MVCs with functional near-infrared spectroscopy over S1 and primary motor
(M1) areas, through oxy- [HbO] and deoxy-hemoglobin [HbR] variation. Electrophysiological
data (H-reflex during MVC, EMG activity and level of voluntary activation) were also
recorded.
Results: MVC torque significantly decreased after the first 17 NMES trains (p<0.001). The
electrophysiological data were consistent with supra-spinal alterations. In addition, [HbO]
declined significantly during the protocol over the S1 and M1 areas from the first 17 NMES
trains (p<0.01 and p<0.001, respectively), while [HbR] increased (p<0.05 and p<0.01,
respectively), indicating early decline in cortical activity over both primary cortical areas.
Conclusions: The declining cortical activity over the M1 area is highly consistent with the
electrophysiological findings and supports motor cortex involvement in the loss of force after
a fatiguing NMES protocol. In addition, the declining cortical activity over the S1 area
indicates that the decreased motor output from M1 is not due to increased S1 inhibitory
Key words: Neuromuscular electrical stimulation, supra-spinal fatigue, central motor drive,
1.Introduction
1
Neuromuscular electrical stimulation (NMES) is a peripheral type of solicitation that consists 2
of setting off a muscular contraction electrically by activating intramuscular nerve branches 3
(Hultman et al., 1983). Despite widespread clinical use, NMES presents a strong limitation: it 4
provokes rapid and excessive neuromuscular fatigue (Doucet et al., 2012, Downey et al., 5
2011). In rehabilitation, low stimulation frequencies are often preferred as they delay the 6
development of neuromuscular fatigue compared with high stimulation frequencies (Gorgey 7
et al., 2009). Therefore, previous investigations of NMES-induced neuromuscular fatigue 8
were conducted at low frequencies, notably over the plantar flexors (Papaiordanidou et al., 9
2010b) and the thumb abductor muscle (Papaiordanidou et al., 2010a). Opposite effects were 10
reported, depending on the nature of the stimulated muscle: whereas NMES applied over the 11
high fatigue-resistant plantar flexor muscles mainly induced supra-spinal alterations 12
(Papaiordanidou et al., 2010b), the authors failed to report the same effects over the low 13
fatigue-resistant thumb abductor muscle (Papaiordanidou et al., 2010a). In both studies, given 14
the preservation of spinal excitability, the presence or absence of supra-spinal alterations were 15
deduced at the peripheral level through (i) the level of voluntary activation (LOA) and (ii) the 16
root mean square (RMS) of the electromyographic (EMG) activity normalized by the 17
maximal M-wave (RMSEMG/M), two markers that may lead to misinterpretation. Indeed, LOA
18
sometimes overestimates the neural drive (Kooistra et al., 2007), while RMSEMG may
19
underestimate it because of the amplitude cancellation phenomenon (Keenan et al., 2005). 20
Therefore, if based only on the use of peripheral markers, the existence of supra-spinal 21
alterations in electrically induced fatigue remains mainly speculative. 22
The complementary use of neuroimaging techniques like functional near infrared 23
spectroscopy (fNIRS) or functional magnetic resonance imaging (fMRI) could resolve this 24
issue. Previous studies have reported a decline in cortical activity during volitional fatigue 25
using fNIRS (Shibuya & Tachi, 2006) and fMRI (Liu et al., 2002), suggesting the relevance 26
of such techniques to explore the neurophysiological mechanisms associated with the fatigue 27
phenomenon. 28
One might therefore wonder which brain areas would be of interest in a neuroimaging-based 29
investigation of electrically induced neuromuscular fatigue. The primary motor area (M1) is 30
incontestably of relevance in this context as it represents the main motor output from the 31
cortex to the spinal cord. Second, the primary somatosensory cortex (S1) is a candidate as it 32
houses projections from the group III and IV afferents (Almeida et al. 2004; Chen et al. 2009; 33
Kalliomaki et al. 1998; Schouenborg et al. 1986), which are strongly suspected of 34
involvement in the neuromuscular fatigue under NMES (Boerio et al. 2005; Papaiordanidou et 35
al. 2010b). The potential involvement of the S1 area in central motor drive inhibition is 36
supported by several studies reporting increased activity in this area during electrical nerve 37
stimulation (Forss et al., 1994, Hlushchuk & Hari, 2006). Also, the increase in S1 activity was 38
found to occur in parallel to a decrease in primary motor cortex (M1) activity (Chen et al., 39
1999, Hlushchuk & Hari, 2006) and excitability (Chen et al., 1999, Tokimura et al., 2000). 40
Accordingly, an inhibitory influence exerted by the S1 area toward the M1 area has been 41
hypothesized (Sutherland, 2006). 42
Besides the potential involvement of the S1 area in decreasing motor output, many studies 43
have reported prefrontal cortex (PFC) deactivation during volitional fatigue just before task 44
failure (Shibuya et al., 2004, Rupp & Perrey, 2008). As the PFC area is the main facilitation 45
structure of the brain (Tanaka & Watanabe, 2012), it seems likely that it would be implicated 46
in non-volitional fatigue, although this has not yet been investigated. 47
To contribute to a better understanding of the neural substrates of NMES-induced 48
neuromuscular fatigue, the present study aimed to (i) attest the supra-spinal alterations by 49
cortical measurements and (ii) test for S1 area involvement in the decrease in motor output 50
after a fatiguing NMES task at low frequencies over the plantar flexor muscles. We 51
hypothesized an increase in S1 area activity, a decrease in M1 activity and central motor drive 52
failure after electrically induced neuromuscular fatigue. 53
54
2. Materials and methods
55
56
2.1. Participants 57
Twenty healthy males (mean age 23.9 ± 2.4 years) participated in the study. They were all 58
physically active, with no history of lower limb surgery or recent injury and no neurological, 59
endocrine, respiratory, or cardiovascular disease or medication use that could affect brain 60
function or perfusion. After being informed about the objectives and potential risks of 61
participation in the study, they all gave written consent. They were asked to avoid any violent 62
effort during the two days before the experimental session. All procedures were approved by 63
the local Ethics Committee and complied with the principles of the Declaration of Helsinki 64
for human experimentation. 65
66
2.2. Pre-experiment 67
Nine participants were tested in a control session 7 to 10 days prior to the experiment. During 68
this control session, the settings and the protocol were strictly the same as for the 69
experimental session (as detailed below), except that the NMES sequences (fatigue protocol) 70
were replaced by resting periods that lasted 3 minutes. 71
72
2.3. Experimental design 73
The experimental session began with a standard warm-up consisting of 12 submaximal 74
plantar flexions for 2 s every 5 s, and then six maximal plantar flexions every 30 s. The 75
participants were also familiarized with superimposed evoked potentials at this time. 76
Familiarization to maximal plantar flexions was assumed to be sufficient when task criteria 77
were reached (quick rise in force, maintenance of a plateau, absence of compensatory 78
movements). The protocol began with a 3-min resting period to stabilize the participant's 79
physiological variables. The fatigue protocol consisted of five sequences of 17 stimulation 80
trains of the plantar flexor muscles, each lasting 3 min. Neuromuscular tests were performed 81
before and after each stimulation sequence in order to obtain a follow-up before (pre), during 82
(post17, post34, post51, post68), and after (post85) the protocol. The design is presented in 83 Fig. 1A. 84 85 2.4. Fatigue protocol 86
The plantar flexor muscles of the dominant leg, formed by the gastrocnemii medialis and 87
lateralis and the soleus muscles, were electrically stimulated by a constant-current stimulator 88
(Cefar Physio 4, Cefar Medical, Lund, Sweden) delivering rectangular symmetric, biphasic 89
pulses at maximal tolerated intensity. The two rectangular 50-cm² surface electrodes 90
(Medicompex, Ecublens, Switzerland) were respectively placed 5 cm under the popliteal fossa 91
and at the level of the insertion point of the two gastrocnemii muscles on the Achilles tendon. 92
Train characteristics were the following: frequency 30 Hz, pulse duration 450 µs, duty cycle 93
40% (4 s on, 6 s off), and intensity: maximal tolerated, readjusted at the beginning of each 94
sequence to reach the maximal tolerated threshold continuously (Maffiuletti, 2010). The mean 95
intensity was 33.83 ± 7.7 mA. The mean percentage of maximal voluntary torque evoked by 96
the stimulation trains was 44.06 ± 13.82%. 97
98
99
2.5. Measurements 101
102
2.5.1. Mechanical recording 103
Plantar flexion torque during voluntary and electrically induced contractions of the dominant 104
leg was recorded by a Biodex System 3 isokinetic dynamometer coupled with the Biodex 105
Advantage Software Package (Medical System Inc., Shirley, NY, USA). The dominant leg 106
was determined using the balance recovery test (Hoffman et al., 1998). The participant was 107
comfortably seated on the Biodex chair in a semi-lying position, with a 30° back inclination. 108
Chair adjustments were made to line up the foot, the patella and the coxofemoral articulation 109
in the same axis. The ankle and knee angles were respectively set to 90° and 110° (180° full 110
extension) and the dynamometer axis was aligned with the anatomical ankle plantar- and 111
dorsi-flexion axis. The pelvis and the proximal extremity of the patella were securely attached 112
to the chair to minimize the movements of adjacent muscles. 113
114
2.5.2. EMG recording 115
The surface EMG signals of the soleus and antagonist tibialis anterior muscles were recorded 116
using bipolar, silver chloride, square surface electrodes with a 9-mm diameter (Contrôle 117
Graphique Médical, Brie-Compte-Robert, France). In order to minimize impedance (<5 kΩ), 118
the skin was shaved, abraded, and cleaned with alcohol. After verification of an appropriate 119
M-wave acquisition (single response and highest amplitude), electrodes were placed over the 120
muscle belly with an interelectrode distance of 20 mm. The reference electrode was placed on 121
the opposite wrist. The EMG signal was amplified (gain × 1000), bandpass-filtered (10-500 122
Hz) and recorded at a sampling frequency of 4096 Hz (Biopac MP100, Biopac Systems, Santa 123
Barbara, CA, USA). 124
2.5.3. Electrically evoked potentials 126
Muscle excitability was evaluated by the superimposed M-wave (Msup), spinal excitability by 127
the superimposed H-reflex (Hsup), and spinal and supra-spinal adaptations by the volitional 128
wave (V-wave). These three evoked potentials were assessed during plantar flexor maximal 129
voluntary contraction (MVCs) by stimulation of the tibial nerve with a constant-current, high 130
voltage stimulator (DS7AH, Digitimer, Hertforshire, UK). Rectangular monophasic pulses of 131
200 µs were used (Papaiordanidou et al., 2010b). The cathode (a silver chloride square 132
surface electrode) was fixed on the popliteal fossa. A piece of foam, sustained by a strap, was 133
applied over the cathode to optimize contact with the tibial nerve, situated in depth. The anode 134
(a rectangular 50 cm² surface electrode) was placed beneath the patella. After localization of 135
the optimal site for tibial nerve stimulation, where no response could be observed on the 136
antagonist tibialis anterior, the M-wave and H-reflex recruitment curves were performed at 137
rest. One pulse was delivered on the tibial nerve every 10 s with the intensity increasing from 138
10 mA until no further increase in twitch mechanical response and M-wave amplitude 139
occurred. To ensure that M-wave was maximal during MVCs, the maximal intensity at which 140
maximal M-wave amplitude was reached was increased by 20% (supramaximal intensity, 141
IMmax) to account for activity-dependent changes in motor axonal excitability (Racinais et al.,
142
2013). This intensity was used during MVCs to obtain Msup and V-wave. Subsequently to 143
IMmax determination, the intensity where the maximum H-reflex was observed was carefully
144
sought (IHmax) using 2-mA increments. IHmax was used during MVCs to obtain Hsup.
145
146
2.5.4. Cortical activity recording 147
Cortical activity was assessed with a continuous wave multichannel functional near-infrared 148
spectroscopy (fNIRS) system (Oxymon Mark III, Artinis, the Netherlands) as described 149
elsewhere (Derosiere et al., 2014). Briefly, it is based on neurovascular coupling: when neural 150
activity increases, the increase in regional cerebral blood flow is ten times higher than the 151
increase in regional oxygen consumption, leading to local hyperoxygenation (Fox et al., 152
1988), and a subsequent increase in fNIRS-measured oxy-hemoglobin (HbO) with a decrease 153
in fNIRS-measured deoxy-hemoglobin (HbR) (Colier et al., 1999). The fNIRS optodes were 154
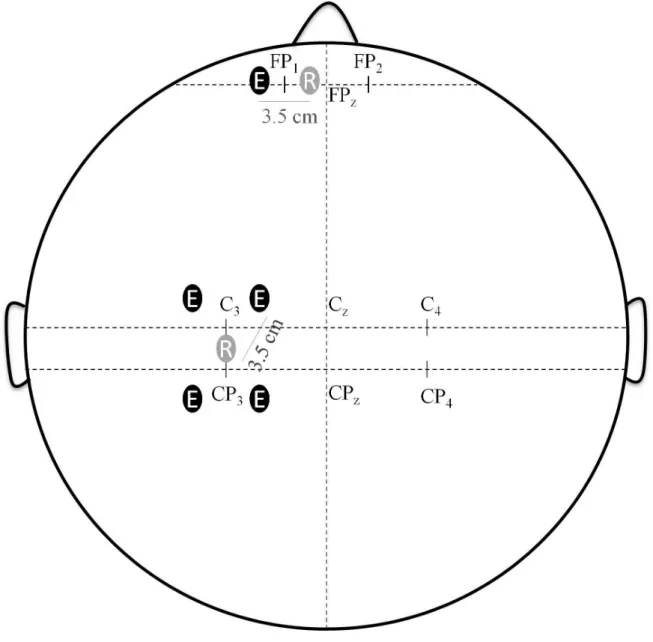
positioned over the scalp in accordance with the extended modified international EEG 10-10 155
systems (Fig. 2). One receptor and four emitters were placed around C3 and CP3 (left
156
hemisphere) for right leg stimulation or C4 and CP4 (right hemisphere) for left leg stimulation
157
at a 3.5-cm interoptode distance. This probe arrangement allowed us to target the contralateral 158
(to the stimulated dominant leg) primary motor cortex (M1) and the contralateral 159
somatosensory cortex (S1), through the rostral and caudal parts, respectively. Four recording 160
paths were obtained: two over M1 and two over S1. To target the contralateral PFC area, one 161
receptor and one emitter were also placed around Fp1 (left hemisphere) for stimulation of the 162
right leg or Fp2 (right hemisphere) for stimulation of the left leg. fNIRS data were corrected 163
by implementing a specific differential pathlength factor (4.99 + 0.067 × age0.814) (Duncan et 164
al., 1996), which yielded more accurate measurement of the concentration changes, 165
converting the concentration changes in [HbO] and [HbR] to µM units (Delpy et al., 1988). 166
The sampling frequency was set at 10 Hz. The NIRS signals were low-pass filtered (finite 167
impulse response) with a cut-off frequency of 0.7 Hz to remove heart rate signal (Huppert et 168
al., 2009). Specific events were set in the Oxysoft software (V6.0, Artinis, the Netherlands) to 169
distinguish the beginning and the end of each MVC. 170
171
2.6. Neuromuscular tests 172
The neuromuscular tests were conducted during two MVCs with electrically evoked 173
potentials, voluntary activation assessment, and measurement of cerebral oxygenation. Each 174
subject was verbally encouraged during each MVC, which lasted for 4 s. During the plateau 175
of the first MVC, a single stimulation at IMmax was first delivered. Immediately after, a
176
superimposed doublet (100Hz) at IMmax followed, as well as a control doublet 2 s after the
177
relaxation, according to the twitch interpolation technique (Allen et al., 1995). During the 178
plateau of the second MVC, a single stimulation at IHmax was delivered. The MVCs were
179
separated by a 1-min resting period, during which three resting stimulations at IMmax were
180
delivered to calculate the mechanical response (Pt). The design of the neuromuscular tests is 181 presented in Fig. 1B. 182 183 2.7. Data analysis 184
The peak of the mechanical response (Pt) during the three resting evoked potentials of the 185
neuromuscular tests was calculated and averaged. The torque evoked by the stimulation trains 186
was recorded and averaged for the first three trains of the first NMES sequence (trains 1-3) 187
and for the last three trains of each NMES sequence (trains 15-17, 32-34, 49-51, 66-68 and 188
83-85) in order to obtain muscle response to the stimulation trains. For each block of 189
neuromuscular tests, the highest torque plateau of the two MVCs that lasted 500 ms was 190
considered as the maximal voluntary torque. During the first of the two MVCs, the LOA was 191
calculated as follows (Allen et al., 1995): 192
𝐿𝑂𝐴 % = 1 − 𝑠𝑢𝑝𝑒𝑟𝑖𝑚𝑝𝑜𝑠𝑒𝑑 𝑑𝑜𝑢𝑏𝑙𝑒𝑡 𝑐𝑜𝑛𝑡𝑟𝑜𝑙 𝑑𝑜𝑢𝑏𝑙𝑒𝑡 ×100 193
The RMS of the soleus EMG activity (RMSEMG) was calculated during the maximal torque
194
plateau (as defined above) during each sequence of neuromuscular testing. The peak-to-peak 195
amplitudes of Msup, V-wave and Hsup were calculated. EMGRMS, V-wave and Hsup were
196
normalized with respect to Msup to avoid any influence of peripheral changes on the central 197
parameters: EMGRMS/Msup, Hsup/Msup, V/Msup.
198
The area under the curve (AUC) of [HbO] and [HbR] was calculated and used as an index of 199
cortical activity (Shimodera et al., 2012). AUC of [HbO] and [HbR] from each channel over 200
the M1, S1 and PFC areas was calculated and normalized over time from the beginning to the 201
end (labeled with the specific events set in the fNIRS software during recording) of the best of 202
the two MVCs performed during the neuromuscular tests. Data from the two channels over 203
M1 and from the two channels over S1 were then averaged, resulting respectively in an 204
overall response of the M1 and S1 areas. 205
206
2.8. Statistical analysis 207
All statistical analyses were performed using Statistica software (StatSoft, Inc., version 6.0, 208
Tulsa, OK, USA). All variables recorded before, during and after the NMES protocol (or 209
resting periods for pre-experiment check-up) were tested using a one-way repeated measure 210
ANOVA (time effect): before NMES (pre), after 17 trains (post17), after 34 trains (post34), 211
after 51 trains (post51), after 68 trains (post68) and after 85 trains (post85). The underlying 212
assumptions of ANOVA were checked using Skewness-Kurtosis coefficients (normality of 213
distribution) and the Mauchly test (sphericity of variance). When the ANOVA F ratio was 214
significant (p<0.05), means were compared by a LSD post-hoc test. Data are reported as 215
means and standard deviation (SD) unless specified. 216 217 3. Results 218 219 3.1. Pre-experiment check-up 220
The torque recorded during MVCs did not change significantly throughout the control 221
condition (F=0.62, p=0.68). Likewise, there was no significant changes nor in LOA neither in 222
evoked potential properties (all p>0.15). Furthermore, the cortical activity remained 223
unchanged during the control session over the M1 and S1 areas (all p>0.31). 224
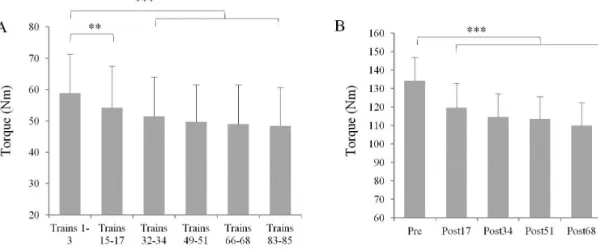
3.2. Stimulation trains and maximal voluntary contraction torques 226
The torque evoked during the stimulation trains decreased during the NMES protocol 227
(F=16.2, p<0.001). The decrease was significant from post17 (p<0.01) and remained 228
significant until the end of the fatigue protocol (-8.2 to -14.8% between trains 15-17 to trains 229
83-85; Fig. 3A). 230
The torque produced during MVCs decreased throughout the NMES protocol (F=21.5, 231
p<0.001). The decrease was significant from post17 (p<0.001) and remained significant until
232
the end of the protocol (-10.8 to -19.9% between post34 and post85; Fig. 3B). 233
234
3.3. LOA, mechanical response and evoked potentials 235
Detailed results of the LOA, mechanical response and evoked potentials are given in Table 1. 236
A significant decrease in LOA (F=9.06, p<0.001) was observed immediately after the first 17 237
NMES trains (p<0.01). The Pt values decreased significantly (F=16.28, p<0.001) from post34 238
(p<0.001). Msup amplitude decreased significantly during the NMES protocol (F=12.27, 239
p<0.001) from post17 (p<0.001). EMGRMS/Msup declined significantly during the 240
experimental session (F=3.4, p<0.01) from post34 (p<0.01). V/Msup exhibited a significant 241
decrease (F=2.78, p<0.05) immediately at post17 (p<0.05). Hsup/Msup was not significantly 242 modified (F=1.135, p=0.35). 243 244 3.4. Cortical activity 245
A significant decrease in [HbO] and increase in [HbR] were found over the M1 area during 246
the experimental session (F=8.49, p<0.001 and F=4.03, p<0.01, respectively). These 247
significant modifications of [HbO] and [HbR] occurred at post17 (p<0.001 and p<0.05) and 248
persisted until the end of the protocol (Fig. 4A).
A comparable result ([HbO] decrease and [HbR] increase) was found over the S1 area 250
(F=3.85, p<0.01 and F=2.63, p<0.05, respectively). The decrease in [HbO] was significant at 251
post 17 (p<0.05), while [HbR] increased significantly from post34 (p<0.01) (Fig. 4B). 252
Over the PFC area, [HbO] was 1.17±0.31, 1.3±0.32, 1.27±0.31, 0.8±0.22, 0.97±0.19 and 253
0.76±0.33 µM at pre, post17, post 34, post51, post68 and post85, respectively, and was not 254
significantly modified (F=1.43, p=0.24). [HbR] was 0.13±0.13, 0.06±0.07, 0.04±0.8, -255
0.03±0.07, -0.16±0.12 and -0.07±0.14 µM at pre, post17, post34, post51, post68 and post85, 256
respectively, and was not significantly modified throughout the experimental session (F=1.14, 257
p=0.35).
258
259
Figure 5 represents raw data of LOA, Msup, V-wave, Hsup and fNIRS signal from one 260
individual participant at pre and post85. 261
262
4. Discussion
263
264
The present study aimed to identify the supra-spinal factors involved in neuromuscular fatigue 265
induced by low frequency stimulation of the plantar flexors. The results showed the 266
development of neuromuscular fatigue, as evidenced by the significant MVC torque decrease, 267
which was accompanied by changes occurring at the supra-spinal level. The major finding of 268
the study was an early and progressive decline in cortical activity over the M1 and S1 areas 269
during MVCs following NMES trains. 270
271
Since the pre-experiment check-up did not reveal any parameters modifications (maximal 272
voluntary torque, superimposed evoked potential and cortical activity), it can be assert that the 273
NMES protocol caused all the identifying results in the experiment. 274
The neuromuscular fatigue induced by the NMES protocol was evidenced by the decrease in 275
maximal voluntary torque. This torque alteration may have originated at peripheral, spinal or 276
supra-spinal levels. Regarding the peripheral level, a decrease in Msup and peak twitch 277
amplitude was observed, consistent with neuromuscular excitability and muscle contractility 278
failure, respectively. These results support other studies investigating higher stimulation 279
frequencies (75 Hz) and/or other muscular groups (Boerio et al. 2005; Papaiordanidou et al. 280
2010a; Zory et al. 2005). 281
Confirming previous studies (Boerio et al., 2005, Papaiordanidou et al., 2010b), 282
neuromuscular fatigue could not be ascribed to spinal excitability alterations since the 283
Hsup/Msup ratio did not change. Conversely, LOA and EMGRMS/Msup decreased throughout
284
the protocol. The decrease in these peripheral indices of the descending neural drive is 285
consistent with a drop in the central motor drive. In accordance with earlier conclusions on 286
the nature of the CNS alterations under NMES (Boerio et al., 2005, Papaiordanidou et al., 287
2010b), and because in the present study no modification in spinal excitability was found, the 288
decrease in the central motor drive most probably was derived from the supra-spinal level. 289
As in a previous study conducted at higher frequencies (Laurin et al., 2012), we observed a 290
V/Msup decrease, a change in a variable that likely reflects both spinal excitability (Crone & 291
Nielsen, 1994) and descending neural drive (Aagaard et al., 2002). Because spinal excitability 292
was not modified, it is assumed that the reported V/Msup decline was instead caused by a 293
decrease in the descending neural drive upstream the spinal level. Thus, the V/Msup kinetic is 294
in line with the involvement of supra-spinal impairments in decreasing the central motor drive 295
under NMES. 296
Taken individually, electrophysiological parameters like V/Msup, LOA and EMGRMS/Msup
297
cannot provide information on the supra-spinal mechanisms responsible for torque decline. 298
Furthermore, because they are recorded at the peripheral level, the decrease in central motor 299
drive reflected by these markers, even when normalized over spinal and muscle properties, is 300
based only on an extrapolation. In the current study, we used a new complementary approach 301
to assess supra-spinal alterations by combining the results derived from classical 302
electrophysiological data with neuroimaging. The fNIRS data exhibited a decrease in [HbO] 303
and an increase in [HbR] over the M1 and S1 areas as neuromuscular fatigue developed, a 304
typical sign of decreased neural activity (Wenzel et al., 2000). These results, which 305
corroborate the electrophysiological data, are consistent with an immediate decrease in neural 306
activity from the first NMES sequence. Furthermore, taken together, they provide the first 307
evidence that a cortical motor output decline is implicated in the loss in voluntary force 308
production after NMES. 309
The PFC area did not exhibit any changes in [HbO] or [HbR] throughout the fatiguing 310
protocol. This area is notably involved in motivation (Kouneiher et al., 2009) and is 311
considered as the main facilitation structure of the brain (Tanaka & Watanabe, 2012). Other 312
studies have reported a decrease in [HbO] within the PFC area during voluntary whole-body 313
exercise just before task failure, suggesting its possible involvement in decreasing neural 314
drive (Rupp & Perrey, 2008, Shibuya et al., 2004). The same pattern could not be found with 315
electrically induced fatigue, thus the decrease in cortical motor output cannot be ascribed to 316
alterations in motivation or facilitation processes from the PFC area during this specific task. 317
One of the objectives of the study was to better understand the supra-spinal mechanisms 318
responsible for voluntary muscle torque decline after NMES. Our initial hypothesis was that 319
an increase in inhibitory input from the S1 to the M1 area would explain the decrease in 320
cortical motor output. Because the activation of inhibitory interneurons increases local energy 321
consumption (Jueptner & Weiller, 1995), areas involved in the onset of motor output 322
inhibition should appear overactivated. In the current study, both the M1 and S1 areas were 323
deactivated, so it can be assumed that the onset of the inhibition process took place upstream 324
of these two primary cortical areas. It is thus possible to suggest the involvement of deeper 325
structures. The thalamus, the insular and the cingulate cortex should be considered, as their 326
implication in the inhibition of central motor drive has been clearly suggested during 327
volitional fatigue (Tanaka et al., 2013, Hilty et al., 2011a, Jouanin et al., 2009). 328
The decrease in cortical activation over the M1 and S1 areas was evident from the very first 329
NMES sequence. Previous studies dealing with voluntary fatigue contractions reported a 330
different activation pattern, showing an initial increase in cortical activity followed by a final 331
decrease in cortical activity near the exhaustion threshold (Liu et al., 2002, Shibuya & Tachi, 332
2006, Shibuya & Kuboyama, 2010). The early decrease in cortical activity after NMES is in 333
accordance with the characteristics of electrically induced contractions as opposed to 334
voluntary contractions. Here, we suggest that the higher metabolic stress induced by NMES 335
(Jubeau et al., 2012, Theurel et al., 2007) led to an early elevated firing rate of the group III 336
and IV afferents, which in turn caused the recruitment of inhibitory interneurons within the 337
brain to decrease the central motor drive. 338
339
Methodological consideration: 340
We did not assess the gastrocnemius EMG activity. At 110°-knee joint angle, the contribution 341
of the gastrocnemius muscles to plantar flexor torque should be between 30% and 40% 342
(Cresswell et al., 1995; Fukunaga et al., 1992). After the electrically-induced fatigue, we 343
observed a decline in the plantar flexor torque without the possibility to identify the 344
contribution of each muscle in the declining torque. Although we could only report a decline 345
of the soleus EMGRMS activity, a similar decline in the gastrocnemius musles is strongly
346
expected (Papaiordanidou et al. 2010b). 347
The superimposed evoked potentials during MVCs were elicited on the tibial nerve using 348
stimulation intensities determined at rest. By doing so, activity-dependent changes in motor
axonal excitability during MVCs may have led to unsuitable stimulation intensities. To
350
overcome this issue, the maximal intensity to elicit Msup was increased by 20%. Indeed, it
351
has been shown that the plateau of the maximal superimposed M-wave during MVC is
352
obtained by stimulation of at least 120% of the maximal M-wave determined at rest (Racinais
353
et al., 2013). Conversely, we did not increase the submaximal intensity to elicit superimposed
354
H-waves during MVCs. By using intensity determined at rest, the superimposed H-waves
355
obtained in the study were presumably not maximal but were rather on the ascending part of
356
the recruitment curve (Racinais et al., 2013). Yet, it has been shown that the reliability of the
357
superimposed H-reflex is higher when assessed in the ascending part of the recruitment curve
358
(Grospretre & Martin, 2012).
359
LOA and superimposed evoked potentials are subjects to variability and were recorded only 360
once during each neuromuscular tests session. However, no changes were found in the control 361
condition for any recorded parameter, supporting that NMES rather than variability was likely 362
responsible for LOA and superimposed evoked potentials changes. 363
364
5. Conclusion
365
In conclusion, the present study provides evidence that a cortical motor output decrease is 366
involved in the loss of force after NMES at low frequencies. The decrease in central motor 367
drive was demonstrated from the very first NMES sequence by the consistency between the 368
kinetics of the electrophysiological and the fNIRS-measured hemodynamics data over the M1 369
area. The fact that the S1 activity also decreased after NMES indicates that S1 is not involved 370
in the inhibition of the cortical motor output during this specific task. 371
372
Acknowledgements
The authors would like to thank Prof. Stephane PERREY for the use of NIRS equipment 374
funded by a grant in aid from the Languedoc-Roussillon Region council (AVENIR). 375
376
Conflict of interest
377
No conflict of interest, financial or otherwise, is declared by the authors. 378
REFERENCES
Aagaard, P., Simonsen, E. B., Andersen, J. L., Magnusson, P. & Dyhre-Poulsen, P. 2002. Neural adaptation to resistance training: changes in evoked V-wave and H-reflex responses. J Appl Physiol (1985), 92, 2309-18.
Allen, G. M., Gandevia, S. C. & McKenzie, D. K. 1995. Reliability of measurements of muscle strength and voluntary activation using twitch interpolation. Muscle Nerve, 18, 593-600.
Amann, M., Proctor, L. T., Sebranek, J. J., Pegelow, D. F. & Dempsey, J. A. 2009. Opioid-mediated muscle afferents inhibit central motor drive and limit peripheral muscle fatigue development in humans. J Physiol, 587, 271-83.
Boerio, D., Jubeau, M., Zory, R. & Maffiuletti, N. A. 2005. Central and peripheral fatigue after electrostimulation-induced resistance exercise. Med Sci Sports Exerc, 37, 973-8. Chen, R., Corwell, B. & Hallett, M. 1999. Modulation of motor cortex excitability by median
nerve and digit stimulation. Exp Brain Res, 129, 77-86.
Colier, W. N., Quaresima, V., Oeseburg, B. & Ferrari, M. 1999. Human motor-cortex oxygenation changes induced by cyclic coupled movements of hand and foot. Exp
Brain Res, 129, 457-61.
Cresswell, A. G., Loscher, W. N. & Thorstensson, A. 1995. Influence of gastrocnemius muscle length on triceps surae torque development and electromyographic activity in man. Exp Brain Res, 105, 283-90.
Crone, C. & Nielsen, J. 1994. Central control of disynaptic reciprocal inhibition in humans.
Acta Physiol Scand, 152, 351-63.
Delpy, D. T., Cope, M., van der Zee, P., Arridge, S., Wray, S. & Wyatt, J. 1988. Estimation of optical pathlength through tissue from direct time of flight measurement. Phys Med
Biol, 33, 1433-42.
Derosiere, G., Alexandre, F., Bourdillon, N., Mandrick, K., Ward, T. E. & Perrey, S. 2014. Similar scaling of contralateral and ipsilateral cortical responses during graded unimanual force generation. Neuroimage, 85 Pt 1, 471-7.
Doucet, B. M., Lam, A. & Griffin, L. 2012. Neuromuscular electrical stimulation for skeletal muscle function. Yale J Biol Med, 85, 201-15.
Downey, R. J., Bellman, M., Sharma, N., Wang, Q., Gregory, C. M. & Dixon, W. E. 2011. A novel modulation strategy to increase stimulation duration in neuromuscular electrical stimulation. Muscle Nerve, 44, 382-7.
Duncan, A., Meek, J. H., Clemence, M., Elwell, C. E., Fallon, P., Tyszczuk, L., Cope, M. & Delpy, D. T. 1996. Measurement of cranial optical path length as a function of age using phase resolved near infrared spectroscopy. Pediatr Res, 39, 889-94.
Forss, N., Hari, R., Salmelin, R., Ahonen, A., Hamalainen, M., Kajola, M., Knuutila, J. & Simola, J. 1994. Activation of the human posterior parietal cortex by median nerve stimulation. Exp Brain Res, 99, 309-15.
Fox, P. T., Raichle, M. E., Mintun, M. A. & Dence, C. 1988. Nonoxidative glucose consumption during focal physiologic neural activity. Science, 241, 462-4.
Fuglevand, A. J. & Keen, D. A. 2003. Re-evaluation of muscle wisdom in the human adductor pollicis using physiological rates of stimulation. J Physiol, 549, 865-75.
Fukunaga, T., Roy, R. R., Shellock, F. G., Hodgson, J. A., Day, M. K., Lee, P. L., Kwong-Fu, H. & Edgerton, V. R. 1992. Physiological cross-sectional area of human leg muscles based on magnetic resonance imaging. J Orthop Res, 10, 928-34.
Garland, S. J. & Gossen, E. R. 2002. The muscular wisdom hypothesis in human muscle fatigue. Exerc Sport Sci Rev, 30, 45-9.
Gorgey, A. S., Black, C. D., Elder, C. P. & Dudley, G. A. 2009. Effects of electrical stimulation parameters on fatigue in skeletal muscle. J Orthop Sports Phys Ther, 39, 684-92.
Grospretre, S. & Martin, A. 2012. H reflex and spinal excitability: methodological considerations. J Neurophysiol, 107, 1649-54.
Hilty, L., Jancke, L., Luechinger, R., Boutellier, U. & Lutz, K. 2011a. Limitation of physical performance in a muscle fatiguing handgrip exercise is mediated by thalamo-insular activity. Hum Brain Mapp, 32, 2151-60.
Hilty, L., Lutz, K., Maurer, K., Rodenkirch, T., Spengler, C. M., Boutellier, U., Jancke, L. & Amann, M. 2011b. Spinal opioid receptor-sensitive muscle afferents contribute to the fatigue-induced increase in intracortical inhibition in healthy humans. Exp Physiol, 96, 505-17.
Hlushchuk, Y. & Hari, R. 2006. Transient suppression of ipsilateral primary somatosensory cortex during tactile finger stimulation. J Neurosci, 26, 5819-24.
Hoffman, M., Schrader, J., Applegate, T. & Koceja, D. 1998. Unilateral postural control of the functionally dominant and nondominant extremities of healthy subjects. J Athl
Train, 33, 319-22.
Hultman, E., Sjoholm, H., Jaderholm-Ek, I. & Krynicki, J. 1983. Evaluation of methods for electrical stimulation of human skeletal muscle in situ. Pflugers Arch, 398, 139-41. Huppert, T. J., Diamond, S. G., Franceschini, M. A. & Boas, D. A. 2009. HomER: a review of
time-series analysis methods for near-infrared spectroscopy of the brain. Appl Opt, 48, D280-98.
Jouanin, J. C., Peres, M., Ducorps, A. & Renault, B. 2009. A dynamic network involving M1-S1, SII-insular, medial insular, and cingulate cortices controls muscular activity during an isometric contraction reaction time task. Hum Brain Mapp, 30, 675-88.
Jubeau, M., Muthalib, M., Millet, G. Y., Maffiuletti, N. A. & Nosaka, K. 2012. Comparison in muscle damage between maximal voluntary and electrically evoked isometric contractions of the elbow flexors. Eur J Appl Physiol, 112, 429-38.
Jueptner, M. & Weiller, C. 1995. Review: does measurement of regional cerebral blood flow reflect synaptic activity? Implications for PET and fMRI. Neuroimage, 2, 148-56. Keenan, K. G., Farina, D., Maluf, K. S., Merletti, R. & Enoka, R. M. 2005. Influence of
amplitude cancellation on the simulated surface electromyogram. J Appl Physiol
(1985), 98, 120-31.
Kooistra, R. D., de Ruiter, C. J. & de Haan, A. 2007. Conventionally assessed voluntary activation does not represent relative voluntary torque production. Eur J Appl Physiol,
100, 309-20.
Kouneiher, F., Charron, S. & Koechlin, E. 2009. Motivation and cognitive control in the human prefrontal cortex. Nat Neurosci, 12, 939-45.
Laurin, J., Dousset, E., Carrivale, R., Grelot, L. & Decherchi, P. 2012. Recovery pattern of motor reflex after a single bout of neuromuscular electrical stimulation session. Scand
J Med Sci Sports, 22, 534-44.
Liu, J. Z., Dai, T. H., Sahgal, V., Brown, R. W. & Yue, G. H. 2002. Nonlinear cortical modulation of muscle fatigue: a functional MRI study. Brain Res, 957, 320-9.
Maffiuletti, N. A. 2010. Physiological and methodological considerations for the use of neuromuscular electrical stimulation. Eur J Appl Physiol, 110, 223-34.
Papaiordanidou, M., Guiraud, D. & Varray, A. 2010a. Does central fatigue exist under low-frequency stimulation of a low fatigue-resistant muscle? Eur J Appl Physiol, 110, 815-23.
Papaiordanidou, M., Guiraud, D. & Varray, A. 2010b. Kinetics of neuromuscular changes during low-frequency electrical stimulation. Muscle Nerve, 41, 54-62.
Racinais, S., Maffiuletti, N. A. & Girard, O. 2013. M-wave, H- and V-reflex recruitment curves during maximal voluntary contraction. J Clin Neurophysiol, 30, 415-21.
Rupp, T. & Perrey, S. 2008. Prefrontal cortex oxygenation and neuromuscular responses to exhaustive exercise. Eur J Appl Physiol, 102, 153-63.
Shibuya, K. & Kuboyama, N. 2010. Decreased activation in the primary motor cortex area during middle-intensity hand grip exercise to exhaustion in athlete and nonathlete participants. Percept Mot Skills, 111, 19-30.
Shibuya, K. & Tachi, M. 2006. Oxygenation in the motor cortex during exhaustive pinching exercise. Respir Physiol Neurobiol, 153, 261-6.
Shibuya, K., Tanaka, J., Kuboyama, N., Murai, S. & Ogaki, T. 2004. Cerebral cortex activity during supramaximal exhaustive exercise. J Sports Med Phys Fitness, 44, 215-9. Shimodera, S., Imai, Y., Kamimura, N., Morokuma, I., Fujita, H., Inoue, S. & Furukawa, T.
A. 2012. Mapping hypofrontality during letter fluency task in schizophrenia: a multi-channel near-infrared spectroscopy study. Schizophr Res, 136, 63-9.
Sutherland, M. T. 2006. The hand and the ipsilateral primary somatosensory cortex. J
Neurosci, 26, 8217-8.
Tanaka, M., Ishii, A. & Watanabe, Y. 2013. Neural correlates of central inhibition during physical fatigue. PLoS One, 8, e70949.
Tanaka, M. & Watanabe, Y. 2012. Supraspinal regulation of physical fatigue. Neurosci
Biobehav Rev, 36, 727-34.
Theurel, J., Lepers, R., Pardon, L. & Maffiuletti, N. A. 2007. Differences in cardiorespiratory and neuromuscular responses between voluntary and stimulated contractions of the quadriceps femoris muscle. Respir Physiol Neurobiol, 157, 341-7.
Tokimura, H., Di Lazzaro, V., Tokimura, Y., Oliviero, A., Profice, P., Insola, A., Mazzone, P., Tonali, P. & Rothwell, J. C. 2000. Short latency inhibition of human hand motor cortex by somatosensory input from the hand. J Physiol, 523 Pt 2, 503-13.
Wenzel, R., Wobst, P., Heekeren, H. H., Kwong, K. K., Brandt, S. A., Kohl, M., Obrig, H., Dirnagl, U. & Villringer, A. 2000. Saccadic suppression induces focal hypooxygenation in the occipital cortex. Journal of cerebral blood flow and
metabolism : official journal of the International Society of Cerebral Blood Flow and Metabolism, 20, 1103-10.
Tables:
Table 1. EMG activity, voluntary activation level, superimposed evoked potentials and mechanical responses.
Pre Post 17 Post 34 Post 51 Post 68 Post 85 LOA (%) 93.33 (1.31) 87.96 (1.82)** 87.69 (1.97)*** 86.27 (2.03)*** 84.3 (2.81)*** 83.5 (2.59)*** Pt (Nm) 21.53 (1.1) 21.38 (1.08) 20.23 (0.96)*** 19.92 (0.95)*** 19.44 (0.88)*** 19.28 (0.81)*** Msup (mV) 10.9 (1) 9.13 (0.91)*** 9.13 (0.91)*** 8.63 (0.88)*** 8.82 (0.9)*** 8.27 (0.73)*** EMGRMS/Msup 0.0224 (0.002) 0.0223 (0.002) 0.0198 (0.001)* 0.0204 (0.001)** 0.0198 (0.001)* 0.0203 (0.001)* Hsup/Msup 0.398 (0.03) 0.455 (0.046) 0.414 (0.036) 0.396 (0.034) 0.355 (0.036) 0.413 (0.038) V/Msup 0.321 (0.025) 0.237 (0.031)* 0.252 (0.027)* 0.218 (0.038)** 0.227 (0.031)** 0.220 (0.035)**
Values are mean (SE). * p < 0.05, ** p < 0.01 and *** p < 0.001 significantly different from pre values.
Figure:
Fig. 1. Schematic representation of the experimental session. (A) Experimental design. (B)
Decomposition of a sequence of neuromuscular tests performed after each sequence of trains.
N.T: Neuromuscular Tests. Details on resting evoked potentials are given in electrically
Fig. 2. Schematic representations of the placement of the fNIRS optodes. The emitors (E)
were placed at 3.5 cm from the receptor (R). The optodes were positioned according to the
extended EEG 10-20 system: around C3 and CP3 (or C4 and CP4) to target the primary motor
and somatosenry cortex, around CP1 (or CP2) to target the prefrontal cortex. Cz is situated at
the middle of the distance between the nasion and the inion. CPz is situated at 10% of the
Fig. 3. (A) Torque evoked by the NMES trains. (B) Torque produced during maximal
Fig. 4. (A) Primary motor cortex oxygenation. (B) Primary somatosensory cortex
oxygenation. * p < 0.05, ** p < 0.01 and *** p < 0.001 significantly different from pre values.
Fig. 5. Typical response of one subject for superimposed evoked potentials during maximal
voluntary contractions (Msup, V-wave and Hsup), level of voluntary activation (twitch-like
increment in torque) and cortical activity changes over the M1 area (HbO and HbR), before