Publisher’s version / Version de l'éditeur:
Vous avez des questions? Nous pouvons vous aider. Pour communiquer directement avec un auteur, consultez la
première page de la revue dans laquelle son article a été publié afin de trouver ses coordonnées. Si vous n’arrivez pas à les repérer, communiquez avec nous à PublicationsArchive-ArchivesPublications@nrc-cnrc.gc.ca.
Questions? Contact the NRC Publications Archive team at
PublicationsArchive-ArchivesPublications@nrc-cnrc.gc.ca. If you wish to email the authors directly, please see the first page of the publication for their contact information.
https://publications-cnrc.canada.ca/fra/droits
L’accès à ce site Web et l’utilisation de son contenu sont assujettis aux conditions présentées dans le site LISEZ CES CONDITIONS ATTENTIVEMENT AVANT D’UTILISER CE SITE WEB.
Internal Report (National Research Council of Canada. Institute for Research in Construction), 2000-12-01
READ THESE TERMS AND CONDITIONS CAREFULLY BEFORE USING THIS WEBSITE.
https://nrc-publications.canada.ca/eng/copyright
NRC Publications Archive Record / Notice des Archives des publications du CNRC : https://nrc-publications.canada.ca/eng/view/object/?id=442333df-cdc3-4ec4-80ee-3c8ce154529c https://publications-cnrc.canada.ca/fra/voir/objet/?id=442333df-cdc3-4ec4-80ee-3c8ce154529c
NRC Publications Archive
Archives des publications du CNRC
For the publisher’s version, please access the DOI link below./ Pour consulter la version de l’éditeur, utilisez le lien DOI ci-dessous.
https://doi.org/10.4224/20378870
Access and use of this website and the material on it are subject to the Terms and Conditions set forth at
Long-term field monitoring of an EIFS clad wall: instrumentation
M.N.A. Said, A.H.P. Maurenbrecher, W.C. Brown and
I.S.
WalkerInternal Report No. IRC-IR-822 . . - a * . ~ ~ . * ? ~ ; ~ : C . v < ' ~ . ~ -
5
$
December 2000
v
DEC
P
8-.a a *Q 9 5: i'. *..'
*:
$*8
&e&
;a,~da
&ad@&@B
$."D@
ZWGC
..
Long-Term Field Monitoring of an ElFS Clad Wall
Building M-20, Montreal Road Campus, NRC, Ottawa, OntarioINSTRUMENTATION
M.N.A. Sa'id, A.H.P. Maurenbrecher, W.C. Brown', and I.S. Walket
Institute for Research in Construction National Research Council Canada
'
now at Morrison-Hershfield, Ottawa2
TABLE OF CONTENTS
Introduction
...
1Building Renovation
...
1Measurements
...
3Selection of Wall Test Sections
...
4West Side
...
4East Side
...
4Design and Installation of Sensors
...
5Indoor & Outdoor Environment
...
5Temperature Measurements
...
5Pressure Measurements
...
7Moisture Measurements
.
Exterior Surfaces...
7...
Rain Fall 7 Surface Wetting...
8Moisture Measurements
.
in the Wall Air Cavity...
8Relative Humidity
...
8Wetting of Cavity Surfaces
...
9Heat Flow Measurements
...
9Data Logging Equipment
...
10...
Unit 1 . Thermal and Moisture Monitoring 10...
Unit 2 . Pressure and Rain Gauge Monitoring 10. .
...
Ambient Weather Cond~t~ons 11 Summary of Instrumentation Details...
11Acknowledgements
...
12Bibliography
...
12 Appendix A.
Channel assignment of data-logging unitsAppendix B . Specifications for sensors and data-logging equipment Figures 1-1 5
INTRODUCTION
This report describes the instrumentation used to monitor the thermal and moisture performance of two wall sections of building M-20 at the Montreal Road campus of the National Research Council (Fig. 1 a shows the location of M-20 in relation to the other buildings on the NRC campus). In the summer of 1993, an additional vented wall assembly with an exterior insulation and finish system (EIFS) cladding was added to the exterior masonry walls of building M-20. The building retrofit also included new double- glazed windows and upgraded HVAC systems.
During the retrofit of the building, instrumentation to monitor temperature, moisture, heat flow, and air pressure was installed in the wall assembly. The instrumentation will be continuously monitored over an extended period to allow the effect of seasonal variation on wall performance to be evaluated.
This study is part of a program of field monitoring being carried out by the Institute for Research in Construction at the National Research Council of Canada (NRC) to develop design guidelines and methods of evaluating performance for retrofitted masonry walls. The objectives of the long-term field monitoring were:
1. Determine how the thermal and moisture conditions in the walls are changing after the retrofit,
2. Evaluate procedures for field monitoring and develop improved methods for use on other buildings,
3. Provide information for the development of guidelines for the retrofit of masonry walls, and
4. Provide field data to verify mathematical models of hygrothermal behaviour of the building envelope. These models can then be used to predict the hygrotherrnal behaviour of other building envelopes.
BUILDING RENOVATION
The building used for this study, M-20, is located on the Montreal Road campus of NRC in Ottawa, Ontario, Canada. The climate in Ottawa varies from warm, humid
summers to cold and damp winters. According to the National Building Code of Canada3, the design climatic parameters for Ottawa are 4600 heating degree-days (base 1B0C), a temperature range from 30°C in July to -25'C in January (2.5% level), and 900 mm average annual precipitation. The average annual wind speed is 14 kmlh (the extreme hourly wind speed is 89 krnlh); the most frequent wind direction is from the west4. During rain, the most frequent wind direction is from the Easts (this does not take into account the amount of rain).
The two to three storey flat roofed building was originally constructed in 1953 with later additions (Fig. I b shows the plan of the building). The basement storey is partly
3
National Building Code of Canada 1995, National Research Council of Canada, NRCC No. 38726
4
Ottawa Int'l Airport 1938-1990. Canadian Climate Normals 1961-1990. Environment Canada. 1998. Wind-driven rain and buildings. G Robinson & M C Baker. Technical Paper 445, DBFUNRC. 1975. NRCC 14792
above ground level. The total floor plan area of the building is about 2800 m2. The exterior wall was made out of a steel frame infilled with two wvthes of hollow clav tiles, with a total width of about 400 mm (the basement exterior walls are concrete).
he-outside
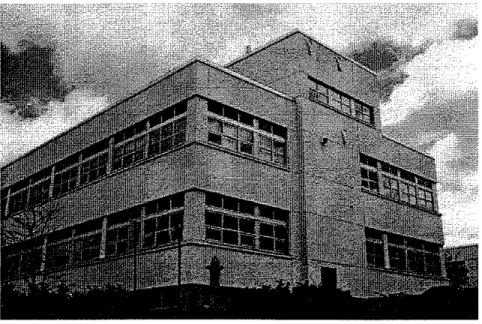
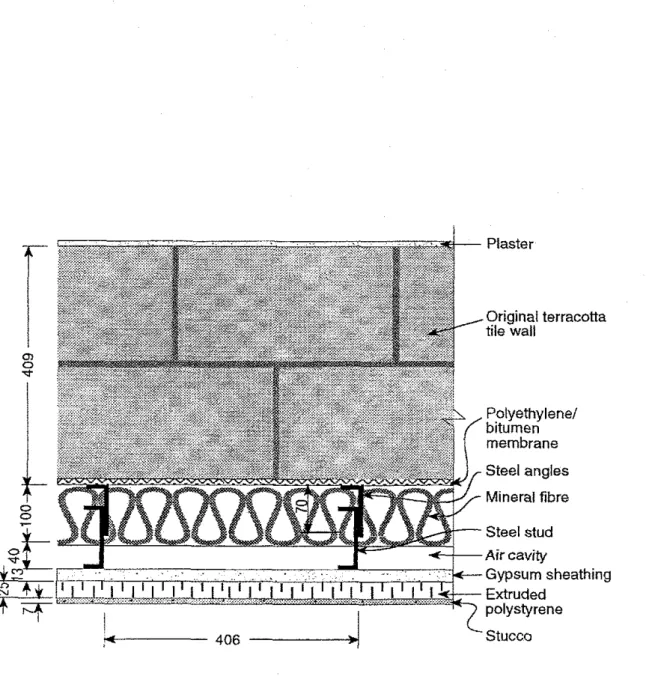
finish of the clay tile wall was a white painted stucco and the interior has a plaster finish. To reduce heating and cooling loads, and control air and moisture flow through the envelope an additional wall assembly with ElFS cladding was added to the exterior of the building in the summer of 1993. The new wall system also has a stucco finish so that the building retained its characteristic style (Fig l c shows the building after renovation). New double- glazed windows were also installed. The central air conditioning system (with distribution throughout the building) was also upgraded.Figure 2 shows a cross-section of the retrofitted wall. The retrofit was assembled from the original wall6 outward in a series of steps, as follows:
1. The exterior stucco of the building was cleaned with a pressurized water spray to remove loose paint and dirt.
2. A primer was painted onto the cleaned wall7. A polyethylenelmodified bitumen adhesive membrane8 was then attached. This membrane is intended to act as the air and vapour barrier for the building envelope.
3. Galvanized sheet steel angles [32 mm x 126 mm and 0.91 mm thick (20 gauge)] were attached vertically, 406 mm (16 in.) on centre. These angles allowed for the gap between the steel studs and the existing brick wall to vary. This was required to make the exterior finish even and true because the original wall surface was uneven (up to k75 mm out of plane). Standing the steel studs off the wall also provided an air cavity (about 38 mm average thickness) between the exterior gypsum sheathing and the mineral fibre insulation installed against the wall in the space between the angles and studs. The unevenness of the original wall caused the air cavity thickness to vary from 15 to 50 mm (Fig 3).
4. Galvanized steel studs [31 mm x 91 mm and 0.91 mm thick (20 gauge)] were attached to the angles. The studs had holes (approximately 28 cm2 in area) punched in the centre web every 710 mm. These holes were covered by the semi-rigid mineral fibre insulation batts in most places, except where the unevenness of the existing wall resulted in a large gap between the studs and the existing wall. The holes allowed for air to flow horizontally from one cavity compartment (stud-space) to another, which is an important aspect affecting the effectiveness of potential pressure equalized rainscreen wall systems.
5. Galvanized7 steel tracks [29 mm x 93 mm and 0.91 mm thick (20 gauge)] were installed at the top and bottom of the wall assembly and above and below each window. Circular vent holes for the cavity were punched out of the bottom track sections (Fig. 4a). The vent holes (weep holes) were the standard drain holes that are
The retrofit described was applied to the walls down to 250 m m above ground level. From there downwards, 50 mm extruded polystyrene insulation was fixed directly to the concrete of the basement wall onto which was attached the same finish coat as the rest of the wall but with a grey finish.
'
Blueskin primer Bakortypical of a cavity wall system. The holes were 13 mm (112 in.) diameter and about 150 mm (6 in.) on centre. For the purposes of this study, additional venting holes (Fig. 4b) were cut out of the bottom track on the west side of the building (at the test section only). These changes are discussed in the section on the experimental installation.
6. Semi-rigid mineral fibre insulation bansg were installed between the studs (100 mm thick, RSI 2.9 (R15.4)). This insulation was held in place by the friction fit between the studs and mounted flush to the polyethylene/ bitumen membrane covering the existing wall.
7. Exterior grade gypsum sheathing boards", nominally 13 mm thick, were screwed to the steel studs. This gypsum board has glass fibre reinforcement instead of paper backing. According to the manufacturer this fibreglass mat increases weather and sag resistance, the core material is treated with silicone and there is an alkali resistant surface coating.
8. Rigid extruded polystyrene boards" were secured to the steel studs by screws that passed through the gypsum sheathing (25 mm thick, RSI 0.87 (R4.6)).
9. A yellow glass fibre reinforcing mesh, =I0 mm grid, was fastened to the polystyrene boards as a base for the exterior finish.
10. The exterior finish was an acrylic based stu~co'~, a ready mixed emulsion plaster (about 7 mm thick). It was applied in two coats, with the second coat containing the finish colour. Vertical expansion joints for the exterior finish were cut into the
polystyrene insulation, but not as deep as the gypsum sheathing.
11. As part of the renovation project, all the windows were replaced with aluminum frame sealed insulating glass units (double glazing without argon or a low-E coating). The windows are not monitored in this study.
MEASUREMENTS
In addition to the general objectives stated earlier, the measurements are intended to examine the following areas of building envelope performance
1. Assess the effectiveness of pressure equalized rain-screen wall systems. Compare computer model predictions of pressure equalized rain-screen systems to measured degree of pressure equalization in the present system between the wall cavity and the exterior surface of the building.
2. Determine the thermal performance of the new wall system and the effectiveness of the additional insulation. Assess the effects of the vented wall cavity on the total
Roxul40,64 kg/m3 nominal density.
lo Dens-Glass Gold, 4 x 8 ft.
' I Styrofoam
by
Dow ChemicalIZ Base coat: Sto Toughwall, a polymer-modified, fiber reinforced ground coat for use specifically in the Sto
insulating value of the wall system. Quantify the thermal bridging effect of the steel studs.
3. Monitor moisture in the wall system, either from rain penetration, air exfiltration or condensation.
4. Measure the quantity of rain striking the wall, and monitor the external surface wetting patterns.
Selection of Wall Test Sections
Two wall sections were chosen for instrumentation, one on the west side and one on the east side of the building (Fig. lb). These locations were chosen based on the prevailing wind direction (W and E) during potential wall wetting periods and on the height of the cavity in the wall. The tallest available cavities were selected in order to find the extremes of pressure equalization potential of the wall. Because of the large number of windows in horizontal bands around the building, the criteria of having tall cavities limited the choice of monitoring locations to the two that were chosen. The parts of the walls where there are windows have short cavities (<2 m) that would not be an extreme test for pressure equalization. The tall cavities allow for pressure measurements to be made at several heights so that the variation of pressure equalization with distance from the vent holes can be determined.
West Side
On the west side of the building, the test section consisted of three stud spaces. The central stud space was instrumented and the remaining two stud spaces act as a guard stud space to each side. The three stud spaces formed a sealed compartment that was created by the following modifications. A seal of the same bitumenlpolyethylene material as applied to the original walls was applied to the full height of the studs at the edges of the guard stud spaces; a closed cell foam gasket was placed along the flange of the two guard studs (between the stud and the exterior gypsum sheathing). These seals prevented air movement between the test section and the rest of the wall system as is required for pressure equalization systems.
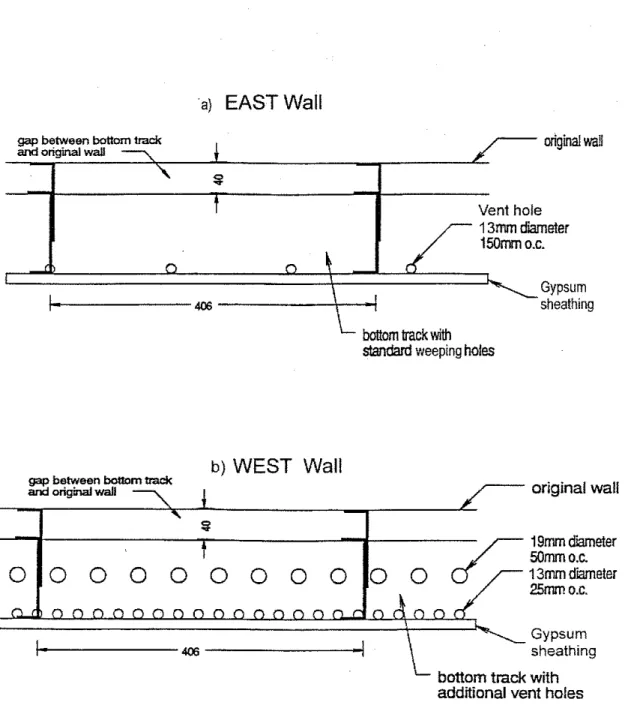
As noted earlier, the bottom track on the west side test section had additional vent holes that increased the effective vent area (Fig. 4b). The additional vents consisted of two rows of holes. The first row of holes were 13 mm diameter on 25 mm centres along the same line as the existing drainage holes (weeping holes) and the second row of holes were 19 mm diameter on 50 mm centres. These holes provided a total of 55 cm2 of leakage area per stud space. This was about an order of magnitude (1 3 times) more than with unaltered bottom track (4.3 cm2). However, the effective area of the extra venting area may be reduced by the partial blockage by the mineral fibre insulation and by the flashing installed below the bottom track.
East Side
On the east side of the building, there were no changes to the cavity. It was typical of construction in the rest of the building. There was no vertical compartmentalization; the track at the bottom of the cavity has 13 mm diameter vent holes (weeping holes) 150 mm on centre (Fig. 4 4 .
DESIGN AND INSTALLATION OF SENSORS
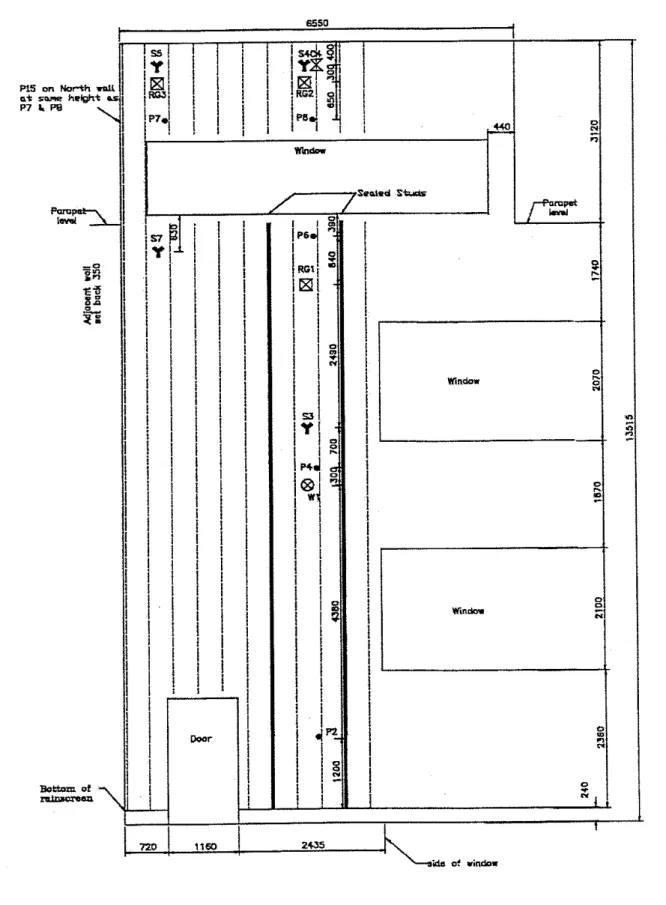
Figures 5 to 12 show the sensor locations on the two sides of the building. Figures 5, 6, 9 and 10 show overall views of the west and east test wall sections. The additional figures show details that would not be clearly represented in the overall views. In these figures, the sensor locations are labelled as follows:
Temperature (thermocouples): T I to T42. Solar radiation: W1 and W2
Pressure taps: P I to P I 5
Driving rain (rain gauges): RGI to RG6
Time of wetnessldrying: Sereda sensors: S I to S12 Ceramic sensors: C1 to C8
Nicked-insulation wire sensor: NWI Relative humidity: R1 to R10
Heat flow across wall (heat flux sensors): H I and H2
Appendix B lists the specifications for the sensors and data logging equipment.
Indoor & Outdoor Environment
Ambient conditions for the wall system are monitored in order to find the dominant parameters and provide input data to numerical models. The temperature and relative humidity of the interior and outdoor air are measured. Outdoor ambient conditions are monitored at a meteorological station about 380 m to the north-west of the building on the NRC campus (Fig. l a shows location of weather station, and building M-20). Measure- ments include the temperature and relative humidity of the outdoor air, wind speed, wind direction and rainfall.
Solar radiation meters were mounted half way up each wall to monitor solar radiation directly at the vertical exterior surface (Figs. 5 & 9). They do not separate the direct and diffuse components. This allows the solar radiation meter outputs to be used directly as inputs to heat transfer calculations of the wall system without the uncertainty (and complication) of converting diffuse and direct components to a vertical surface facing a given direction. The sensors were mounted on bolts that were connected through the stucco, extruded polystyrene insulation, and the gypsum to the steel studs (they are too heavy, 3.2 kg, to be supported by the stucco finish only). To prevent staining of the exterior finish, rubber grommets were installed as spacers to ensure a gap between the metal casing of the radiometer and the exterior finish.
Temperature Measurements
Temperatures are measured using type T thermocouples. Shielded thermocouple wire was used to reduce any electrical noise superimposed on the thermocouple signal. For surface temperatures, the thermocouples were bonded to the surface with epoxy resin and covered with construction tape. The thermocouple wires were installed in such a way that they would have a minimal effect on the measured temperatures, the wires were
located as far away as possible from other thermocouples, and the wires were run along isotherms near the measurement points.
For thermocouples installed at the gypsum sheathindair space and gypsum sheathing/insulation interfaces, shallow grooves were cut into the gypsum sheathing. The thermocouple wire was secured in these grooves with epoxy, and then covered with construction tape. This left a flat surface on the back of the gypsum so as not to affect surface boundary layer development, and in turn the surface heat transfer rate and temperature. For thermocouples placed between the gypsum and the exterior insulation the above method was also used so that the gypsum and insulation would lie flat together without an air gap between the two components.
For the interior and exterior air temperatures, radiation shields are used so that the thermocouple registered the true air temperature. This is particularly important for exterior measurements where solar radiation can significantly increase the indicated temperature. At each location where the relative humidity (RH) is measured, the air temperature is also measured so that the vapour pressure and dew-point could be calculated.
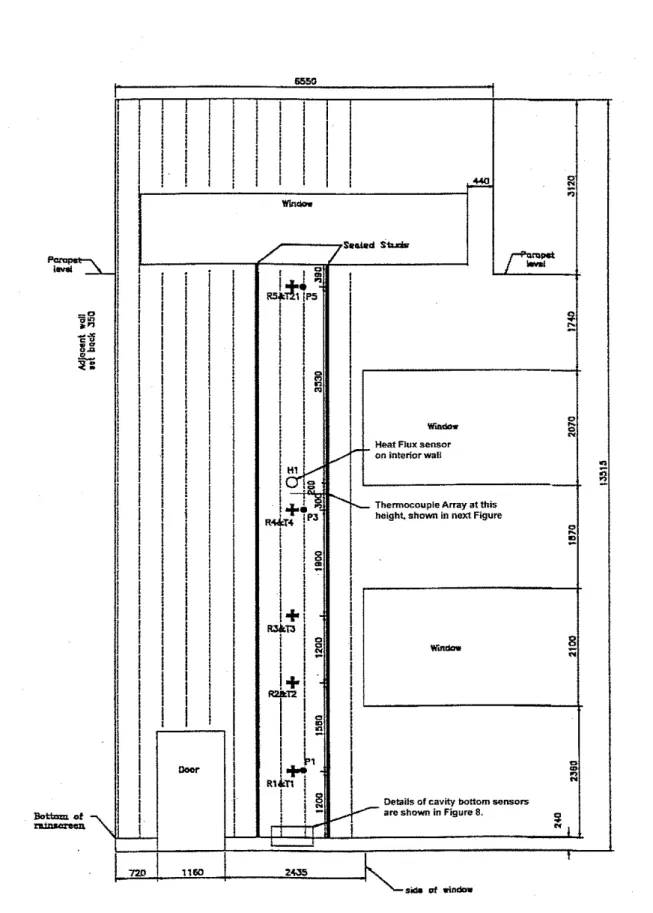
To obtain estimates of the thermal resistance of each layer of the wall section (including the original wall) an array of thermocouples was installed approximately half way up both the East and West wall cavities (Figs. 7 & 11). This arrangement consists of a set of thermocouples on the centreline (mid way between the studs) and a set of thermocouples along a stud line. Knowing the temperature at each material interface allows the thermal resistance of each wall component to be calculated. Differences between the two sets of thermocouples shows the magnitude of the thermal bridging effect of the steel studs. Additional thermocouples mounted on the existing wall and on the back of the exterior gypsum board next to the studs measure how far the thermal bridging effect penetrates laterally from the studs (T13, T14, T17, and T I 8 on west side and T34, T35, T38, and T39 on east side).
The data logging unit operates without using a separate reference temperature cell or ice bath, because it must be in continuous operation. Therefore, it is important to accurately measure the temperature of the thermocouple junction with the multiplexer board. Normally, a single thermistor is used to measure the temperature of the multiplexer board. However, this can be different from the temperature at the
thermocouple/multiplexer junction due to localized heating effects. These localized effects can be caused by other boards (particularly AID converters), LED indicators or external effects such as radiation (solar, wall or other objects in the room). To avoid these internal and external effects, an insulated box was used that contains all the thermocouple
multiplexer channels. All the LED indicators were removed from the three multiplexer boards within the box. Each board also has a copper plate thermally connecting the multiplexer screw terminals to reduce temperature differences between individual thermocouple terminations. The box is insuiated to reduce external heat source effects. The combination of these precautions reduces the uncertainty in thermocouple
Pressure Measurements
Air pressures are measured within the wall cavity and on the exterior surface of the building relative to the interior pressure. The pressure transducers were mounted on the interior wall for easy recalibration and removal. PVC tubing (10 mm (318 in.) I.D.)
extended through the wall from the pressure transducers to the measurement location as shown in Figs. 13 & 14. The tubing was sealed to the bitumenlpolyethylene using a flange covered by another piece of membrane, caulking and construction tape to prevent air leakage around the tubing. The tubing was also sealed to the exterior stucco to prevent air leakage into the cavity from outside. Simple tests were performed in NRC laboratory with a dynamic pressure generating apparatus to estimate the attenuation of higher frequency pressure fluctuations. The results of these tests showed that at frequencies below 5 Hz the tubing had little measurable effect on the frequency response of the pressure transducers. Above this frequency, the fluctuations in air pressure are not significantly active in movement of air and moisture through holes in the exterior building envelope.
The pressure differences are measured at three heights: near the top, middle and bottom of the cavity. These measurements will be used to determine any variation in pressure equalization as the measurement point is moved further from the vent holes at the bottom of the cavity. Exterior pressures are measured at three additional locations on the building: two points above the windows on the west side of the building (Fig. 5,
locations P7 and P8) and one location above the windows at the top of the north wall. These pressures are to be used to model the exterior pressures on buildings and to help determine wetting patterns due to air motion around the building.
Each pressure transducer had a solenoid that acts to short circuit the transducer so that zero pressure difference readings may be taken. These zero readings allowed for any zero offset and any zero drift to be subtracted from each pressure measurement. Moisture Measurements
-
Exterior SurfacesDifferent types of moisture sensors are used to compare their performance and as a safeguard against malfunction of a sensor.
Rain Fall
One external source of moisture for the building is rain. NRC constructed rain gauges specifically to monitor rain driven by wind onto vertical surfaces (see Appendix B for details).
Three rain gauges were mounted on each of the two test walls of the building in order to monitor the surface wetting patterns. On the east side of the building, the rain gauges were mounted near the top and at one-third and two-thirds of the wall height (Fig 9). On the west side of the building, two rain gauges were mounted near the top of the wall about 2.5 m apart (6 stud spaces; Figs. 1 c & 5). This horizontal spacing allows the examination of the horizontal variation of rain striking the building. The third rain gauge was mounted about two thirds the way up the wall.
The rain gauges, too heavy to be supported by the exterior finish, are bolted directly to the steel studs. To prevent staining of the exterior finish, the gauge was offset from the wall by rubber spacers placed between the aluminum backing plate and the exterior finish.
Surface Wetting
Two types of surface moisture sensors are used, a voltage output sensor type (electrochemical cell) and a resistance output sensor type (see Appendix
B
fordescription). Both types indicate the time of wetness and drying. 1. Electrochemical cell (Sereda moisture sensor)
Three Sereda sensors were mounted on the east face just above the rain gauges to examine the correlation between measured rain fall and surface wetting (Fig. 9). The west face has four Sereda sensors. Two sensors were mounted at the top of the wall above the rain gauges and the other two lower down on the wall (Fig. 5).
2. Ceramic (resistance)
The ceramic and Sereda sensors were placed side by side in some locations in order to compare their sensitivity and time response. One ceramic sensor was mounted on the east face test section, at the top of the wall beside a Sereda sensor (Fig. 9). On the west face test section, one ceramic sensor was mounted near the top of the wall beside a Sereda sensor too (Fig. 5).
Moisture Measurements
-
in the wall air cavity Relative HumidityThe relative humidity and surface temperature measurements can be used to predict the occurrence of condensation on the cavity surfaces. As noted earlier, the relative humidity of the outdoor and indoor air are also monitored so that rates of moisture exchange by diffusion or air flow into the cavity space could be estimated.
The relative humidity of the air in the cavity is measured at five locations in each test wall (Figs. 6 & 10). The sensors were placed at different heights to determine the variation of moisture in the cavity air. Because the gradient in relative humidity is expected to be greater near the openings at the bottom of the cavity, three sensors are mounted closer to the bottom of each cavity, approximately 1 .I m apart (Figs. 6 & 10). Their exact locations vary because the physical structure of the building (e.g. floor slabs and stairs) did not allow for exact placement of the mounting holes. Two sensors were mounted further up each cavity, one near the top and one half way up the wall (Figs 6 & 10).
Relative humidity sensors require removal for periodic recalibration, especially if they are exposed to saturated air for long periods of time. The sensors are also expensive and need to be retrieved when the monitoring is completed. Thus, a system was
wall system. The sensors were inserted into the cavity air space through holes from the interior of the building (Fig. 13). To keep the installation tidy and to prevent air and moisture entering the wall system around the sensors, PVC pipes were installed into the holes in the walls. The PVC pipes were sealed to the interior and exterior surfaces of the original wall to prevent air and moisture movement. The electronics for the sensor were mounted on the interior wall next to measurement location. This interior mounting of the electronics allowed for easier troubleshooting and testing because the output and power supply are easily accessible.
It was important to calibrate the relative humidity sensors mounted on the rods that they are installed on because the calibration depended on the wire length between the sensor and the electronics. The sensors use AC excitation and are therefore sensitive to the capacitance and impedance of the connecting wires (length and orientation). The sensors were calibrated using saturated salt solutions in a temperature controlled small environmental chamber.
Wetting of Cavity Surfaces
Sereda sensors were installed in the cavity to detect any surface condensation or liquid moisture running down the cavity. They were mounted in pairs 75 mm above the bottom track (Fig. 8, sensors S1 and S2; Figure 12, sensors 11 and 12). One sensor was on the back of the gypsum sheathing and the other was mounted on the steel stud.
Ceramic moisture sensors were installed in the bottom track of both the west and east cavities (Fig. 8, sensors C1, C2, C3; Fig 12, sensors C5, C6). The sensors were intended to detect condensation or water flow in the cavity. On the west side, three sensors were installed; one near each stud at the ends of the cavity and one on the
centreline of the cavity (Fig. 8). On the east side, only two were installed; one near the left stud (looking from outside) and one on the centreline (Fig. 12).
In the east cavity a different kind of moisture sensing device (a nicked-insulation wire) was installed. It consisted of a side by side wire pair whose insulation had been removed ("nicked") at regular intervals
-
approximately 0.5 mm every 5 mm. The wire covers almost the width of the stud space as shown in Figure 12 (sensor NWI). The resistance between the wires would fall when moisture is present between these exposed wires. A resistance drop therefore indicates the presence of moisture. For both the ceramic and nicked-wire sensors, the installation included putting a layer of insulation epoxy between the sensor and the steel bottom track to prevent short circuits.Heat Flow Measurements
A single heat flux sensor was installed on the inside surface of each test wall. The sensors were installed above the location of the thermocouple arrays (mid-way between the studs) for heat transfer and thermal bridging measurements (Fig. 6, sensor H I ; Fig.
10, sensor H2). The heat flux sensors were covered with two layers of thin (1 mm thick) cork and thin (3 mm thick) aluminum plates to hold them firmly against the wall. This allows for good thermal contact without damaging the interior finish of the building. The aluminum plates covering the heat flux sensors were painted to match the interior paint
scheme so that it would have the same surface texture regarding surface emissivity property.
The heat flux sensors were individually calibrated by the manufacturer, and were verified at NRC using IRC's guarded hot plate apparatus.
DATA LOGGING EQUIPMENT
Two data logging units were used because a high speed unit was required for monitoring the air pressure. Software programs for operating the dataloggers were written in-house. The program for unit 1 was written in Microsoft Basic (Professional version 7.0), and the program for unit 2 was written in C language. Output is in binary format. Appendix A lists the channel assignment for the data logging units.
Unit 1 -Thermal and Moisture Monitoring
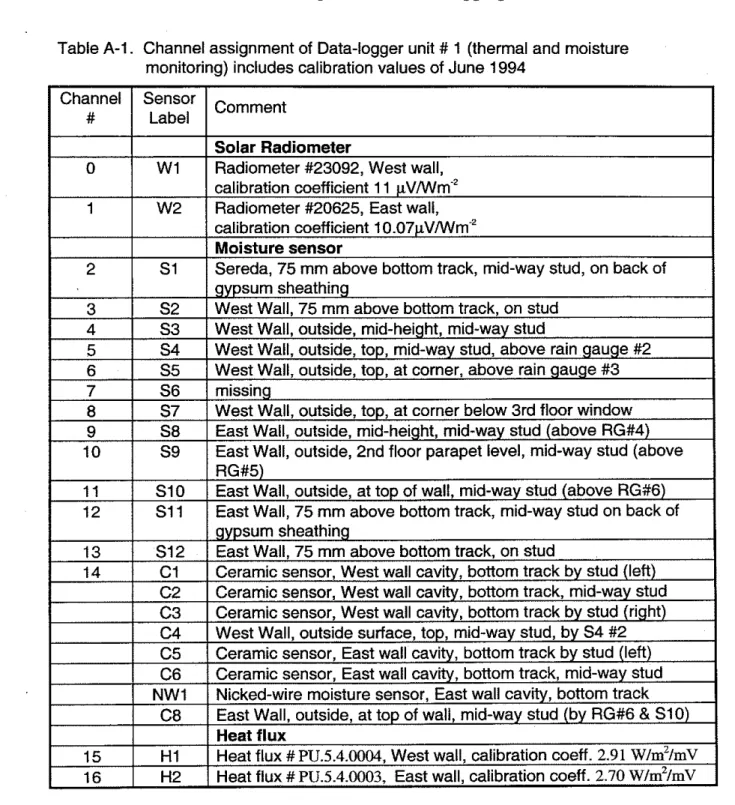
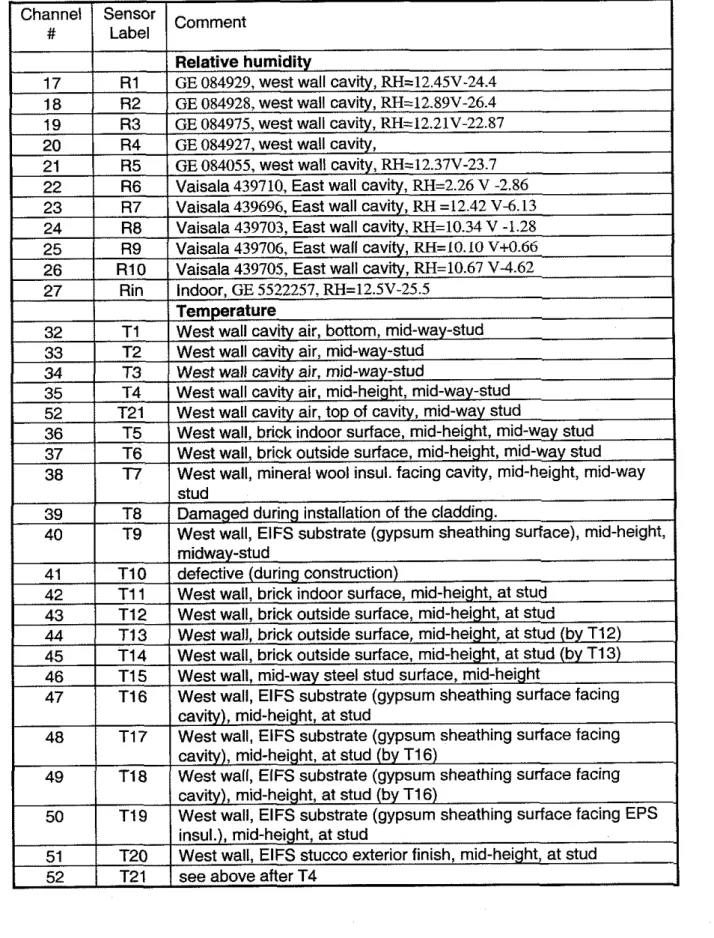
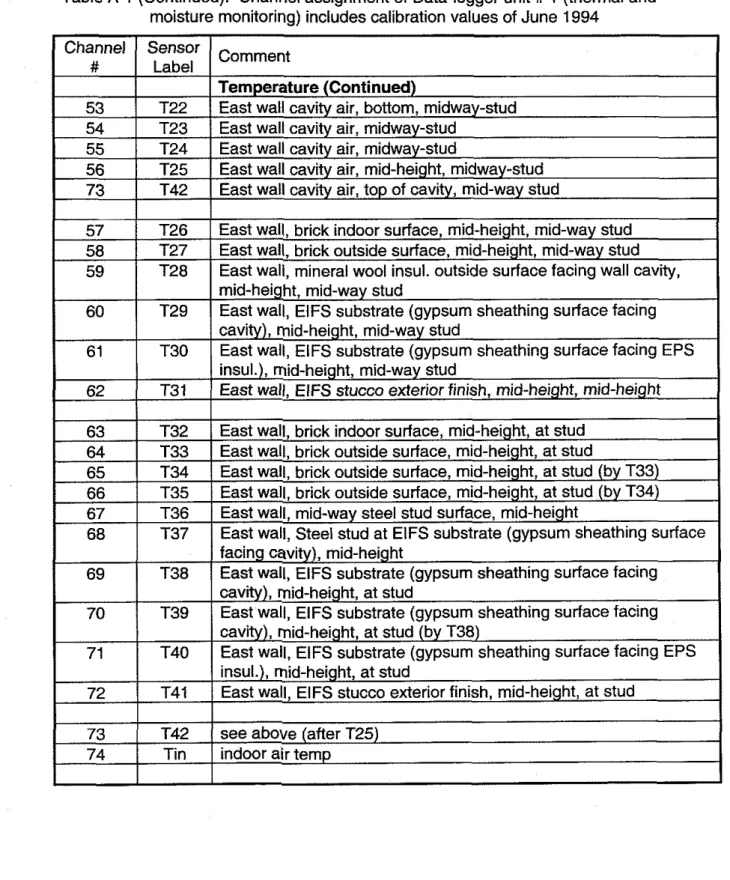
This data logging unit records the temperatures, relative humidity, solar radiation and moisture (except the pulse output of the rain gauges). Table A-1 of Appendix A lists the channel assignment of this data logging unit. All of the sensors, except the electrical resistance type, were connected to a single channel on a multiplexer system. The
electrical resistance sensors were connected to a relay board so that a single sensor at a time could be connected to an electrical circuit to convert resistance to voltage. All of the electrical resistance sensors were connected via this circuit to a sinale channel on the multiplexer system. The multiplexer system scans through all of the readings in a period of about 12 seconds. This includes a one second wait after each relay closes for the resistance measurements. This one second wait protects the data logging system from measuring the switching noise that can be present on the relays.
The conversion to digital information for transfer to the PC operating program is performed by a single 16 bit AJD unit. An hourly average (approximately 300 readings from each sensor) is calculated by the operating program in the PC. This operating program also converts the digital information into the final user units based on the calibrations of the instruments (Pa, Ohm, W/m2 etc.). This information is saved in a data file for later analysis.
Unit 2
-
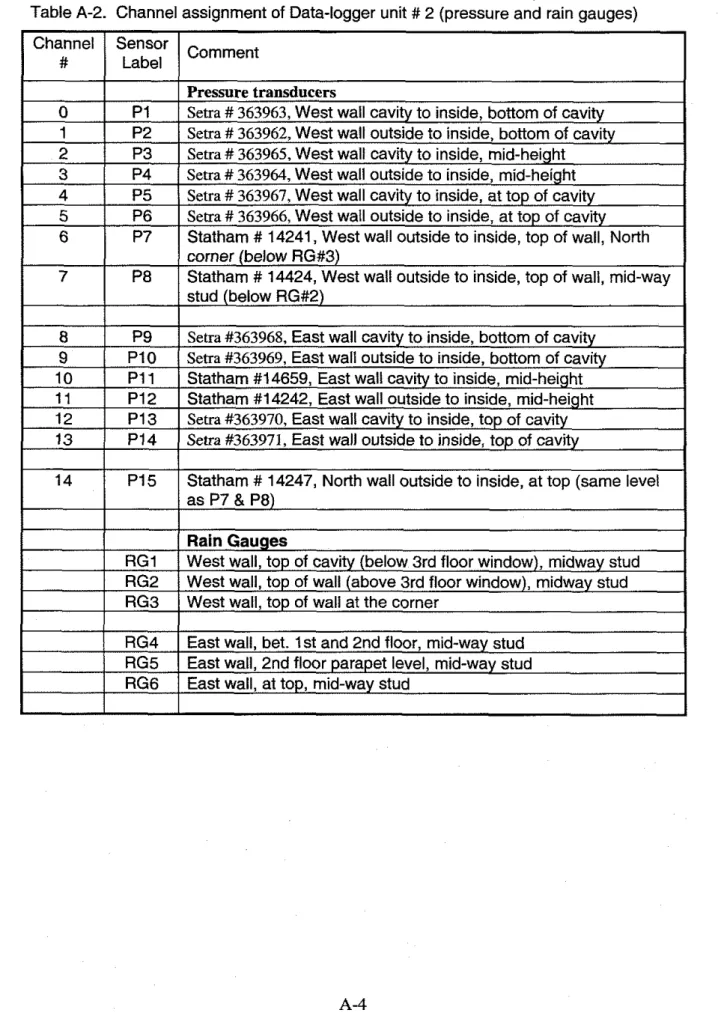
Pressure and Rain Gauge MonitoringThis data logging unit monitors the pressure differences and the pulse output of the rain gauges. Table A-2 of Appendix A lists the channel assignment of this data logging unit. The pressure sensors were each connected to a multiplexer channel of a single, 16 bit, AJD converter. The rain gauge pulses are monitored using a pulse/timer counter. Counting the number of pulses in a given time period allows the calculation of the rainfall rate.
The pressure difference data logging unit has two modes of operation, normal and a high speed wind mode. The high speed mode is triggered by high wind speed events so that the spectral component of pressure equalization can be observed. The two modes of operation differ in the amount of data saved. Most of the time the data logging unit operates in low-speed mode where data is taken at about 42 Hz and averaged over 10
minutes (approximately 25,000 pressure measurements). When a high speed wind event occurs the unit switches into high speed mode.
The high wind mode is triggered when any of the transducers shows a measured pressure difference in excess of 150 Pa (0.6 in. water). During a high wind event, the system records 15,000 individual pressure measurements which are all saved to disk (45 Hz). This procedure takes about 5 minutes and 30 seconds. Non-averaging also means that the extreme peak values can be observed. This data allows the dynamic response of the wall cavity to be examined and the extreme peak values to be observed.
Ambient Weather Conditions
An existing weather station on the NRC campus provides the ambient weather conditions. Hourly and ten minute averages of temperature, relative humidity, wind speed, wind direction, and rainfall are stored. The wind speed and direction are measured at 20, 30 and 70 feet above ground level. For this project only the hourly values are used. The ten minute average values of wind speed are also used when high wind events occur. SUMMARY OF INSTRUMENTATION DETAILS
In order to evaluate the walls over a wide range of ambient conditions, this long- term monitoring project is planned to run for at least two years (from April 1994). This time scale provides a better measure of the durability of the new wall system and any change in its performance with time.
Several aesthetic considerations were included in the installation of the instrumentation because this was an important factor in the acceptability of instrumentation for building managers.
The rain gauges were painted white to match the exterior finish of the building. The aluminum plates covering the heat flux sensors were painted to match the interior paint scheme so that it would have the same surface texture regarding surface emissivity property.
All of the wires were run inside the wall cavity so that no wires would be exposed on the outside of the building and kept to a minimum on interior walls.
Inside the building the wires were placed in electrical conduits or run through the false ceiling space. Unfortunately the wires then have to pass by many other electrical noise sources such as fluorescent light fixtures. For this reason, as well as the length of wires used (over 30 m), all of the wire used in this study was shielded to reduce electrical noise.
To be able to remove the sensors at the end of the project and for periodic recalibration, the following novel installation techniques were used.
The pressure transducers were mounted on the interior wall. 10 mm I.D. PVC tubing was run through the wall from the pressure transducers to the cavity and the exterior surface of the wall.
The relative humidity sensors are inserted into the cavity air space through holes from the interior of the building. To keep the installation tidy and to prevent air and moisture entering the wall system around the sensors, they are installed through PVC tubes inserted into the holes in the walls.
The following novel instrumentation techniques were used in this project.
.
Rain gauges were designed to measure wind driven rain on vertical surfaces. This is different from standard, commercially available, rain gauges that measure the rain falling on horizontal surfaces..
The nicked-insulation wire sensor is used to detect liquid moisture at the bottom of the wall cavity. Its ability to detect the presence of moisture will be compared to the other sensors..
Ceramic moisture sensors are used to monitor moisture in the cavity and on the outside surface.Because the instruments were installed during the renovation process it was possible to place thermocouples at the interface of each layer of the construction. This gllows the da~cu~ation of the kffective thermal resistance of-individual wall components. The thermocouple terminations at the data logging unit were in a thermally insulated enclosure for more stable cold junction compensation.
ACKNOWLEDGEMENTS
This report is based on a draft prepared by the fourth author, lain Walker, before leaving NRC. The authors acknowledge the contribution of Mr. C.J. Shirtliffe, Mr. W.A. Dalgliesh, Mr. G.F. Poirier, Mr. L. McSheffrey, and Mr. J. Marans with the selection and installation of the instrumentation.
BIBLIOGRAPHY
.
Specifications exterior cladding, building M20. Work Order 320001, Contract No 92- 1293. ASPM, NRC. Jan 1993..
Long-term field monitoring of an NFS clad wall. M. N. Said, W. C. Brown & I. S. Walker. Journal Thermal Insulation and Building Envelopes. Vol 20, April 1997. pp 320-338APPENDIX
A
Channel Assignment of Data-Logging Units
Table A-1
.
Channel assignment of Data-logger unit # 1 (thermal and moisture monitoring) includes calibration values of June 1994Table A-1 (continued). Channel assignment of Data-logger unit # 1 (thermal and moisture monitoring) includes calibration values of June 1994
Channel Sensor Comment
I
Label(
[
52 T21 see above after T4
39
40
T8 T9
stud
Damaged during installation of the cladding.
Table A-1 (Continued). Channel assignment of Data-logger unit # 1 (thermal and moisture monitoring) includes calibration values of June 1994
APPENDIX B
Specifications for Sensors and Data Logging Equipment
Temperature
The thermocouple cable used was type TT having one pair of twisted solid
thermocouple wires (30 awg) with extruded PVC insulation, a stranded tinned copper drain wire and an extruded PVC jacket.
Thermocouple wire tolerance +0.5"C or ? 0.4%
Shielded thermocouple wire is used in order to reduce any electrical noise superimposed on the thermocouple signal in the field
Output in microvolts
Relative humidity
Thin-polymer film capacitance relative humidity (RH) sensors are used because they provide a continuous electrical output that is suitable for remote, long-term monitoring.
Vaisala humidityltemperature transmitters model HMD 30YB, accuracy +2% RH (0 to 90% RH) and +3% RH (90 to 100% RH),
temperature Platinum RTD 100 ohm, accuracy k0.2"C
General Eastern humidity/temperature transmitters model RHT-2, RH accuracy &% RH (20 to 95% RH),
temperature Platinum RTD 100 ohm, accuracy +0.3"C
Output: 0 to 5 volts, linear signal proportional with 0 volts equivalent to 0% RH and 5 volts to 100% RH
High quality filters are used in order to reduce ingress of dust.
Pressure
Setra Model 239: range 21 kPa and accuracy 0.14% of full scale. Statham Model PM 197k0.02-350: range +I40 Pa (k0.02 psid)
Surface wettingldrying cycles
Two types of surface moisture sensors are used, a voltage output sensor and a resistance output sensor. They indicate the time of wetness and drying.
Electrochemical cell (Sereda' moisture sensor)
These sensors contain two different metals, copper and gold, in an interlaced pattern plated onto an insulating substrate. When moisture condenses on the sensor it activates the cell, producing a small voltage (0 to 100 mV) across a 10 MQresistor. The sensors are attached to the surface with epoxy resin. ASTM standard G84 gives further information. The Sereda moisture sensor model SMMS-01 was used. It has overall dimensions of 11 x 18 mm. The manufacturer is Compas Electronics Inc, Epitek Microelectronics Division, 100 Schneider Road, Kanata, K2K 1Y2.
Ceramic (resistance)
These sensors, made at NRC, measure the resistance across pieces of ceramic or stone material. When the ceramic or stone material becomes wet, its electrical resistance decreases and this drop in resistance is used to indicate the presence of moisture. The magnitude of the resistance can vary between several hundred kQ (wet condition) to over a 1 GQ (dry condition). An alternating voltage will be applied to the sensor to reduce the chance of polarity effects developing.
The sensors were fabricated by fastening two wires using conductive epoxy (Circuit Works, Chemtronics #2400) to opposite sides of a 5 mm thick block cut from a clay brick (size approximately 20 mm x 10 mm).
.
Nicked-insulation wire sensorAn insulated flat two cable wire was installed along the bottom track to monitor moisture. The insulation was cut and slid apart to expose the wire at regular intervals. Any moisture would then cause a short circuit at any of the exposed locations.
Heat flow through the wall
Heat flux meters have low voltage output in the millivolts range. See ASTM C1155, ASTM C1130, and ASTM C1046 regarding heat flux measurements procedure and calibration of sensor.
The heat flux sensors are commercial units made by lnstitute of Applied Physics, TNO, Netherlands, model PUS4.
The sensors consist of a thermopile encapsulated in plastic and surrounded by a guard area. The overall diameter of the sensor is about 200 mm with a sensing diameter of about 50 mm at the centre. The thermopile consisted of two arrays of thermocouple junctions separated by an insulating layer. The heat flow through the unit is proportional to the difference in voltage generated by the two thermocouple arrays.
Specified accuracy 25% at 20°C.
Rain Gauges
Rain gauges are commercially available for measuring vertical rainfall on horizontal surfaces. However, the vertical walls of a building are exposed to the horizontal component of wind blown rain. NRC constructed rain gauges specifically to monitor rain driven by wind onto vertical surfaces. The rain gauges are based on ones used at the Norwegian Building Research Institute in Trondheim, Norway, originally developed in Sweden in 1973.
The rain gauges have a rain collector consisting of an aluminum backing plate supporting an oval shaped plastic collector (obtained by a 25" diagonal cut, 50 mm wide, from a 340 mm internal diameter PVC pipe (wall thickness =I0 mm; see Fig. 15). The catchment area is 0.10 m2.
The collected rain exits at the bottom of the collector through a short section of copper tubing. The water from the tubing falls onto a tipping bucket. A magnetic switch emits an electrical pulse every time the bucket tips.
The rain gauges were calibrated by pouring measured amounts of water into the collector and counting the number of pulses emitted. The minimum amount of water required to tip the bucket is approximately 6 ml (6 cm3 or 6 g). This corresponds to 0.06 mm per mZ of driving rain for one tip of the bucket.
Solar radiation sensors
Solar radiation is measured by Eppley precision spectral pyranometers. The sensors were calibrated by Atmospheric Environment Services, a division of Environment Canada.
Data logging units
Two Sciemetric Instruments System 200 data acquisition units with high resolution 16 bit
AID converters are used. Each data logger has a personal computer attached to it to operate the data logger, convert the output to the appropriate units and store the data.
Adhesive materials
The following adhesives were used:
Industrial grade RTV silicone sealant (Bostik #9732) 1 or 5 minutes epoxy.
Conductive epoxy (Circuit Works, Chemtronics #2400). Used for attaching leads to the ceramic moisture sensors.
Figure 1 b. Plan of building M20 showing instrumented locations
Figure I c . Building M20 after renovation showing the instrumented west wall with three rain gauges
Plaster .Original terracotta tile wall Polyethylene1 bitumen membrane Steel angles Mineral fibre Steel stud Air cavity Gypsum sheathing Extruded polystyrene Stucco
Inner and outer faces of stud
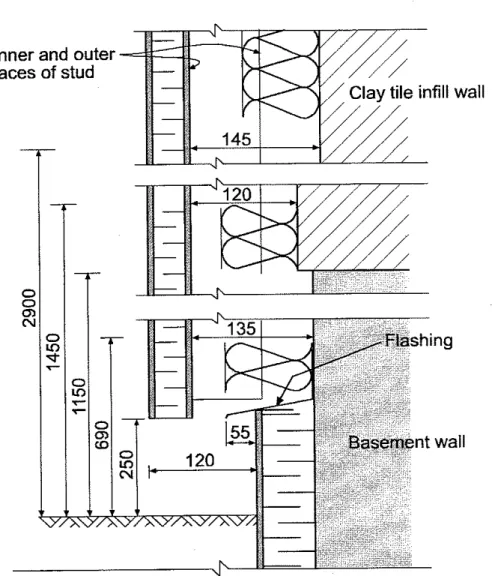
Figure 3 Lower section of west wall test section showing the effect of the unevenness of the original wall surface on the air cavity within the new cladding. Variation measured at three locations (the air cavity width = the measured value shown less the 100 mm thickness of the insulation).
a)
EAST Wall
gap between m o m rrack
and ongwl wall
7
t
,
bdtmtmckwith
standard weeping holes
II
b)WEST Wall
original wall 1 9 m diameter 50mm 0.c 13mm d i e t e r 25mm O.C. Gypsum sheathing"
bottom track with additional vent holes I\
Gypsum - 4 ~ i-I
sheathing'
z
t
0 04
Figure 4. Vent hole locations at bottom wall cavities (plan views) Additional holes shown for west wall are at test section only.
Vent hole 1 3 m diameter
I
Heat Flux sensor
OD interiorwall
oaaiis of cavity bonom B~WOII
are rho- in Figure 8.
t
0tiginal temcdb brici; wdi crratrybM
tit
umen membrane deal mdes m i n e e %re mscletion *Iaul
air cavity g y w m *dt% extruded pdyslymna msuraiion+
---.I
Wi6hFigure 7. Plan view of West wall cross-section, indicating thermocouple array and heat flux sensor
Plan View
Ceramic moisture sensor epoxied to bottom track Original wall Vent holes 19 mm diameter 50 mm O.C. 13 mm diameter 25 mm O.C. Gypsum sheathing Bottom track with additional vent holesElevation
Mineral fibre insulation Air cavity
Gypsum sheathing Sereda sensor on stud Sereda sensor on gypsum sheathing
Ceramic sensor
Figure 10. East Wall-cavity sensor locations
,
Stucco
Figure 11. Plan view of east wall cross-section, showing thermocouple array and heat flux sensor.
Plan
View
c 5 & ~ 6 : ceramic moisture sensorsGypsum sheathing
Sf1 & 512 sereda moisture sensors epoxied to gypsum sheathing
Elevation
Mineral fibre insulation Gypsum sheathing Sereda sensor on stud Sereda sensor on gypsum sheathing
Ceramic sensor
approx. 1.6 rnrn thick
rain collector PVC pipe section 10 rnrn wall extending out 50 rnrn
copper drain pipe 5 rnrn I.D.
. .