https://doi.org/10.4224/20378925
READ THESE TERMS AND CONDITIONS CAREFULLY BEFORE USING THIS WEBSITE. https://nrc-publications.canada.ca/eng/copyright
Vous avez des questions? Nous pouvons vous aider. Pour communiquer directement avec un auteur, consultez la
première page de la revue dans laquelle son article a été publié afin de trouver ses coordonnées. Si vous n’arrivez pas à les repérer, communiquez avec nous à [email protected].
Questions? Contact the NRC Publications Archive team at
[email protected]. If you wish to email the authors directly, please see the first page of the publication for their contact information.
NRC Publications Archive
Archives des publications du CNRC
This publication could be one of several versions: author’s original, accepted manuscript or the publisher’s version. / La version de cette publication peut être l’une des suivantes : la version prépublication de l’auteur, la version acceptée du manuscrit ou la version de l’éditeur.
For the publisher’s version, please access the DOI link below./ Pour consulter la version de l’éditeur, utilisez le lien DOI ci-dessous.
Access and use of this website and the material on it are subject to the Terms and Conditions set forth at
IBANA-Calc user's manual
Birta, J. A.; Bradley, J. S.; Estabrooks, T.
https://publications-cnrc.canada.ca/fra/droits
L’accès à ce site Web et l’utilisation de son contenu sont assujettis aux conditions présentées dans le site LISEZ CES CONDITIONS ATTENTIVEMENT AVANT D’UTILISER CE SITE WEB.
NRC Publications Record / Notice d'Archives des publications de CNRC:
https://nrc-publications.canada.ca/eng/view/object/?id=07b9451f-2e74-43c1-8433-2e09883c79ca https://publications-cnrc.canada.ca/fra/voir/objet/?id=07b9451f-2e74-43c1-8433-2e09883c79ca
IBANA-Calc User’s Manual
Birta, J.; Bradley, J.S.; Estabrooks, T.
NRCC-45330
IBANA-Calc User’s
Manual
J. Birta, J.S. Bradley and T. Estabrooks
Acknowledgements
Primary financial support for the IBANA project, that included producing the IBANA-Calc software, was provided by Transport Canada, the Department of National Defence and the National Research Council. Additional funding has been received from Vancouver International Airport Authority. The helpful cooperation of the staff at Ottawa, Toronto and Vancouver airports in making arrangements for the various field measurements was very much appreciated. The initial version of the software was created by S. Wrinch. Subsequent modifications have been made by E. Nichols, S. Norcross and T Estabrooks.
Disclaimer
The IBANA-Calc software was developed by the acoustics laboratory of the Institute for Research in Construction at the National Research Council of Canada. While every effort has been made to ensure that the software is error free, neither the National Research Council, Transport Canada, nor the
Table of Contents
1. Introduction ...1
1.1 What it Does...1
1.2 Where to Find Things in this Manual ...2
2. Quick Overview of Program ...3
2.1 What Will the Program Do?...3
2.2 Scenario Concept...3
2.3 Using the Quick Start Wizard ...4
2.4 Databases ...4
2.5 Program Outputs: scenario files, printed reports, and CSV files ...5
2.6 Audio Capabilities ...6
3. Installing the Program ...7
3.1 Equipment ...7
3.2 Installation and Un-installation of the Program...7
4. Using the Program...8
4.1 The Quick Start Wizard ...8
4.2 Help...8
4.3 Creating a New Scenario ...9
4.4 Source Spectrum and Level ...9
4.5 Possible Source and Transmission Loss Corrections ...10
4.6 Room Absorption ...11
4.7 Selecting Façade Elements...12
4.8 Scenario Definition ...12
4.9 Duplicating Scenarios ...12
4.10 Comparing Scenarios ...12
4.11 Saving and Recalling Scenarios ...12
4.12 Printing Reports...13
4.13 Auditioning Scenarios ...13
4.14 Database Editing ...13
4.15 Database Replacement ...13
5. Description of Each Program Window ...14
5.2 Standard Sources ...14
5.3 Mixable Sources...15
5.4 Scenario Window ...17
5.5 Façade Elements Window...18
5.6 Choosing Façade Elements ...20
5.7 Choosing Façade Sub-Elements...20
5.8 Define a Scenario Descriptor ...24
5.9 Change Source ...24
5.10 Save Scenario(s) ...27
5.11 Duplicate a Scenario...29
5.12 Print a Scenario on Paper...29
5.13 Print a Scenario to File ...29
5.14 Compare Scenarios ...29
5.15 Combine Scenarios ...32
5.16 Listen to Scenario ...33
5.17 Source and Transmission Loss Spectrum Corrections ...36
5.18 Load Scenario(s) ...36
5.19 Database Editor –Transmission Loss Window ...37
5.20 Database Editor – Source Data Window ...40
6. Main Menu and Menu Items Reference ...43
6.1 File ...43 6.2 Source...43 6.3 Scenario ...43 6.4 Reports...45 6.5 Database...46 6.6 Window ...47 6.7 Help...48
7. Sound Insulation Calculations...49
7.1 NEF, Leq24 and Ldn Relationships...49
7.2 Calculating Indoor Sound Levels...49
7.6 Corrections -Ground Reflection Correction ...51
8. Examples ...53
8.1 Example #1 – Wall with window and opening ...53
Appendix A - Construction Codes ...60
1. Introduction
1.1 What it Does
IBANA-Calc is software that was developed to calculate the effect of sound insulation against aircraft noise and to provide the user with indoor noise levels for different outdoor aircraft noises and building constructions. The software is intended to be both more accurate and more convenient than previous
approaches1 that have used look-up tables and single number ratings of sound insulation to provide this information.
The program was written as part of the IBANA (Insulation Buildings Against Noise from Aircraft) project and includes a large database of new sound transmission loss data of building façade elements as well as a database of aircraft noise spectra both collected as part of the project.
It is intended that the software be used as a convenient tool to aid in the
calculation of the effect of various sound insulation designs. The software is not an expert system and as such the user must have some expertise in the area of noise control engineering.
To use the program, the user first specifies the type of outdoor aircraft noise from the noise source database and then chooses constructions for each part of the building façade from the program's transmission loss database. The combined sound insulation of the selected components is calculated and used to determine the expected indoor sound levels from the aircraft noise. The program provides the user with both graphical and audible output of the indoor sound levels for combinations of noise sources and façade elements chosen by the user. The program includes extensive databases of aircraft noise source and sound transmission loss data but also provides the user with the option of adding new types of aircraft noise and/or new sound insulation data.
1.2 Where to Find Things in this Manual
The manual is separated into eight sections.
Section 1 - Provides some background on the Insulation of Buildings Against Noise from Aircraft (IBANA) project as well as an outline of what the program, IBANA-Calc can do.
Section 2 - Gives a quick overview of the program including the various inputs and outputs of the program.
Section 3 - Explains how to install the program and the equipment needed to run the program.
Section 4 – Provides details on what a user needs to know to run the program and explains each step.
Section 5 - Provides a description of each of the program’s windows. Section 6 – Describes each menu item.
Section 7 - Describes the calculations which are part of the program. Section 8 – Shows calculation examples and some example printouts.
2. Quick Overview of Program
2.1 What Will the Program Do?
There are three main steps to using the IBANA-Calc program.
STEP 1 - The program requires the user to select a source spectrum. This step defines both the type of outside noise as well as the level of noise. The user has the option of choosing a sound source defined within the program’s aircraft noise source database, creating a “mixed” source from the sources in the database or entering their own source data.
STEP 2 - The second step requires the user to define the amount of absorption in the target room and the construction and area of each façade element. This step describes the type of building façade construction, which will be installed between the outside noise and the indoor occupant.
STEP 3 - The third step requires no input from the user. In this step the
computer calculates and then displays the total sound reduction or the expected indoor sound levels based on the user’s input in steps 1 and 2. The user has the option of looking at the results graphically on the computer screen, printing them or listening to the results via loudspeakers or headphones.
The software is Windows-based, written in Visual Basic and is intended to run on a standard PC-type computer.
2.2 Scenario Concept
Each noise source-construction combination is defined by the program as a scenario. The program allows the user to calculate and display many scenarios at any one time as well as to save each one for future reference. The results of each scenario can be displayed as total transmission loss, indoor sound levels, A-weighted indoor sound levels or outdoor sound levels.
Scenarios can be compared graphically using the Scenario Comparison feature and can also be combined to consider more complex situations where sound enters a room by more than one façade of the building. As well as comparing numerical results, the user can compare scenarios by listening to the calculated indoor aircraft noise for several scenarios.
2.3 Using the Quick Start Wizard
New users can quickly learn how to use the main features of the IBANA-Calc software by following the 5 screens of the Quick Start Wizard. The five screens are titled as follows.
a) Selecting a Source Spectrum b) The Beginnings of a Scenario
c) Adding Façade Elements to a Scenario d) Now What?
e) Adding Your Own Data to the Database
2.4 Databases
The program contains two databases – one which contains aircraft noise level spectra and one which contains laboratory transmission loss measurements of various common building constructions.
2.4.1 Database #1 - Aircraft Noise Source Spectra
The program includes three standard source spectra and 4 mixable aircraft spectrum shapes. It is intended that the “Standard Aircraft” spectrum be the default choice for locations near typical commercial airports with significant numbers of jet aircraft operations. The “Standard Canada Mortgage and
Housing Corporation (CMHC) Source” is not representative of modern jet aircraft and is included only to allow comparisons with earlier methods. The “Standard Outdoor Indoor Transmission Class (OITC) Source” is the source spectrum in ASTM standard E13322.
The mixable source spectra include: Chapter 2 jets, Chapter 3 jets, Propeller aircraft and Helicopters. For special situations the user can create a new source spectrum from a mixture of these four source types. The Chapter 2 and
Chapter 3 commercial jet aircraft spectra are representative of mostly smaller (twin engine) aircraft types such as A320 and B737 aircraft.
2.4.2 Database #2 - Sound Transmission Loss Data of Building Façade Elements
IBANA-Calc also contains a database of laboratory transmission loss
measurements for various building façade elements. The majority of test results are recent and include 50 exterior walls, 50 roof-ceilings, 40 windows and glazing units as well as some doors. As is the case for the source spectrum database, the user has the ability to add their own transmission loss results to the database at any time.
The database is divided into several categories. The major groupings are by type of façade element: wall, roof-ceiling, doors, windows, glazing units. Wall and roof-ceiling assemblies are again subdivided into smaller categories by framing type. Walls are subdivided into 2x4, 2x6, 2x6 + resilient channels,
staggered stud, and staggered stud + resilient channels. Roof-ceilings are
subdivided into wood joist, wood truss, raised heel wood trusses and steel decks. A list-box in the Façade Element window displays all façade elements contained in the database in coded format. A complete listing of all codes that appear in the program can be found in Appendix A or in the programs Help feature. For example:
VIN1_GFR25_OSB11_WS89(406)_GFB89_RC13(406)_2G13 This code describes the construction of a 2” x 4” (38 mm x 89 mm) wood stud wall from one face to the other. The description of each component is as follows:
VIN1 1 mm thick vinyl siding
GFR25 25 mm thick rigid glass fibre insulation OSB11 11 mm thick oriented strand board
WS89(406) 38x89 mm wood studs spaced 406 mm on centre GFB89 89 mm thick glass fibre batts
RC13(406) 13 mm resilient channels spaced 406 mm on centre 2G13 2 layers of 13 mm thick gypsum board
The Façade Element window allows the user to view all constructions contained in the database in their coded form as well as a description for each in words. Also displayed in this window is a plot showing transmission loss vs. frequency, as measured in the laboratory, for each construction. Two single number ratings, Sound Transmission Class (STC), and Outdoor-Indoor Transmission Class (OITC), relating to each construction are also displayed at the bottom of the screen. Although the STC rating is widely used for indoor sounds, the OITC rating is more appropriate for outdoor sounds such as aircraft noise with significant low frequency sound energy.
2.5 Program Outputs: scenario files, printed reports, and CSV files
There are three types of outputs from IBANA-Calc. Electronic scenario files, which can contain a number of different scenarios, are saved as .scn files. A second type of output from IBANA-Calc is the information from the two
databases. The databases can be exported as comma separated files (.csv) or in MS Excel format. The user may also print reports showing the aircraft noise spectrum data, airborne sound transmission loss data and information about specific scenarios as well as comparisons and combinations of scenarios.
2.6 Audio Capabilities
IBANA-Calc has the option of outputting audible simulations of several scenarios. The sound of an aircraft fly-over is modified according to the calculated sound attenuations of each scenario and played back using a standard sound card. For each audible simulation, up to four scenarios can be compared. The quality of the playback is dependant on the quality of the amplifier and loudspeakers used and will require an amplifier and loudspeakers capable of reproducing the
3. Installing the Program
3.1 Equipment
The following equipment is needed to run IBANA-Calc: • Pentium computer
• Windows 95/98/2000 or NT • soundcard
• loudspeakers (it should be noted that the quality of the playback is dependant on the quality of the loudspeakers used)
3.2 Installation and Un-installation of the Program
To install the IBANA-Calc program, insert the CD-ROM into the CD drive and follow the instructions of the IBANA-InstallShield Wizard. The user is first asked to select either English or French versions of the program. This choice will determine the language on the various screens of the program and also the language used in the database information. (Of course this will not change the language of your Windows operating system). At the end of installation the user will have to re-boot their computer. After a successful installation, an IBANA window with an IBANA icon will appear on the desktop.
Figure 1: IBANA window with IBANA icon
To install the IBANA-Calc program the user should follow the standard un-installation procedure for their version of Windows.
4. Using the Program
4.1 The Quick Start Wizard
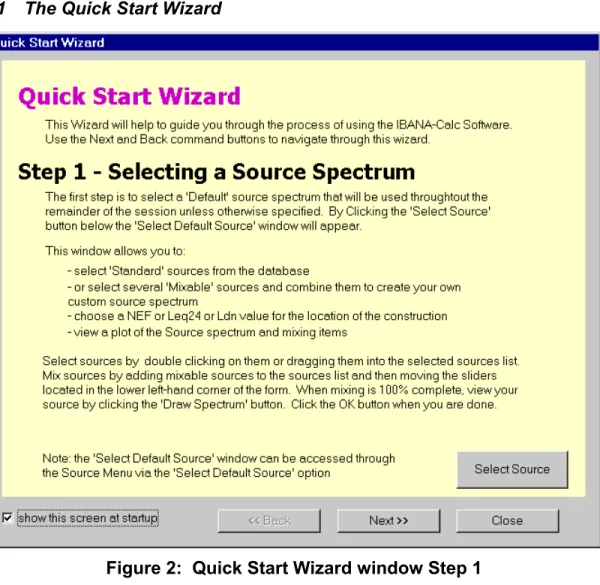
Figure 2: Quick Start Wizard window Step 1
When you startup the IBANA-Calc program the Quick Start Wizard will
automatically appear. This wizard helps to guide the user through the process of using the software. The user can access the Quick Start Wizard from the Help pulldown menu at any time. The Quick Start Wizard can be turned off so it does not display at startup by removing the checkmark from the “show this screen at startup” box on the initial screen.
4.2 Help
A help menu is available electronically under the Help pulldown menu. Help relating to each screen is available by right clicking the mouse and selecting Help
4.3 Creating a New Scenario
Each noise source-construction combination is defined by the program as a scenario. A scenario is one combination of source details, building façade elements and room details. When setting up a scenario the user must choose the source spectrum and level, possible source distance and direction
corrections, the room absorption and the façade elements. The user has the option of naming the scenario so that it can be saved and retrieved at a later date. The program has the ability to calculate and display multiple scenarios as well as to combine scenarios together.
New scenarios can be created at any time by choosing “New Scenario” under the
Scenario pulldown menu. The user also has the ability of loading previously
saved scenarios under this same pulldown menu.
4.4 Source Spectrum and Level
The first step in creating a scenario is to select a “default” source spectrum shape and an overall aircraft noise level. The default source spectrum will be used throughout the remainder of the session unless it is specifically changed by the user.
The user has the option of choosing one of the “standard sources” contained in the database or combining sources to create a custom “mixed” source spectrum. Unless there is a particular reason to do otherwise, the Standard Aircraft source spectrum should be used.
The program contains three standard sources: Standard Aircraft, Standard
CMHC Source and Standard OITC Source. The Standard Aircraft spectrum
represents an average of a mixture of modern aircraft types and sizes. It was derived from measurements taken during the course of this project at Ottawa, Vancouver and Toronto airports. The Standard CMHC Source was taken from the Canada Mortgage and Housing Publication (1981)1. The Standard CMHC
Source is not representative of modern aircraft types and is only included to
permit comparisons with this earlier method. The Standard OITC Source is taken from ASTM Standard E13322.
IBANA-Calc also allows the user to mix several source spectra together to create a “mixed” spectrum. The user might choose this option to accommodate
situations when a building is near an airfield where the aircraft source spectra are different from those experienced at a typical commercial airport. After the user chooses the mixable sources to be used, they must weight each source as a percentage of the total “mixed” source being created. The user must completely specify 100% of the source weighting before successfully creating a “mixed” spectrum. Once complete, the overall mixed spectrum and the component spectra are displayed in graphical form after pressing the Draw Spectrum button. The overall level of the aircraft noise is set by entering the appropriate Noise Exposure Forecast (NEF) value, or an Leq24 value, or an Ldn value. The NEF,
the building site over a 24 hour period. Specifying the NEF, Leq24 or Ldn for the building site adjusts the level at all frequencies up or down so that the source spectrum matches the specified NEF, Leq24 or Ldn value. The user only has to enter one of these numbers. Once one of these values has been entered, the program calculates the other values based the assumption that NEF values are those calculated by Transport Canada’s NEF_1.7 noise contour calculation program (see also Section 5). However, all calculations are in terms of Leq24 values.
4.5 Possible Source and Transmission Loss Corrections
The program includes several optional corrections to the spectrum of the incident outdoor aircraft noise and for variations of transmission loss with the relative orientation of the aircraft and the façade. These should only be used when the user is sure that these corrections are appropriate for their particular situation. Several of the corrections are based on limited measurement data and their validity cannot be guaranteed. The calculation details for each correction are described in Section 5, Sound Insulation Calculations. A brief description of the corrections is outlined below.
4.5.1 Air Absorption Correction
This corrects the source spectrum shape to account for varied amounts of air absorption. This correction is based on the ANSI S1.26 19953 and ISO 9613-14 standards that describe how air absorption of sound varies with distance,
temperature and relative humidity. Although the spectrum shape is adjusted, the corresponding NEF, Leq24 or Ldn is not changed. This correction typically has only small effects on indoor sound levels because it mostly influences the relative importance of higher frequency sound levels.
4.5.2 Vertical Angle Correction
Transmission loss (TL) values are expected to vary with the cosine of the vertical angle of incidence as indicated in ASTM E9665 and ISO 140/V6. Field
measurements7 suggest this occurs for frequencies below 1000 Hz. IBANA-Calc only allows vertical angles between 0 and 80 degrees because the validity of this correction is not known outside this range. The resulting corrections are usually quite small.
The supporting data for this correction are not precise and this correction should be used with caution.
4.5.3 Horizontal Angle Correction
This correction is not implemented in the current version of the software due to lack of supporting evidence.
4.5.4 Horizontal Angle of View Correction
The incident aircraft noise energy is assumed to be proportional to the horizontal angular view of the aircraft by from the particular façade. If the complete fly-by is visible, there is a 180 degree horizontal angular view of the aircraft fly-fly-by. If the façade is perpendicular to the flight track, the angular view is reduced to 90 degrees and only half of the energy is incident on the particular façade. IBANA-Calc can correct (reduce) the effective incident sound energy to account for the effect of reduced horizontal angular view. The correction varies a little with frequency because some energy is diffracted around the vertical edge of the building.
The total correction is quite small but the supporting data is not precise and this correction should be used with caution.
4.5.5 Ground Reflection Correction
The combination of the direct and ground reflected aircraft noise can
destructively interfere at lower frequencies reducing the effective low frequency incident sound energy. The frequency at which this effect is greatest depends on the height of the centre of the façade above ground level. This correction only has a significant effect at first floor façades and should not be used for other situations.
The correction is based on a fit to measurements at a single test house. Its generally applicability has not been validated and therefore it should be used with caution.
4.6 Room Absorption
To calculate the indoor sound level it is necessary to specify the room
absorption. This is estimated as a percentage of the floor area for the type of room that IBANA-Calc is to model. Different types of rooms typically have different sound absorption characteristics. Acceptable values of the absorption as a percentage of floor area are in the range of 50-150%.
As part of a scenario, the user must therefore choose the amount of absorption in the room. This is done by either choosing the type of room from a list, which will automatically set the scale of absorption as a percentage of floor area, or by setting the scale independently by moving a slider. The user is also required to specify the floor area in square metres (or square feet).
The absorption value, combined with the floor area of the room, affects the overall indoor sound level that is predicted by IBANA-Calc.
4.7 Selecting Façade Elements
Adding façade elements to a scenario specifies the building construction details to be used by the scenario. The user must define those elements which are exposed to the sound source. The program contains a database of laboratory transmission loss measurements of façade elements including walls, doors, windows and roof-ceiling assemblies. The user has the option of also adding their own transmission loss results to the database at any time.
Once the specific construction of a façade element is chosen, the user must specify the area of the element. The user has the option of inserting sub-elements, such as a window or door, into an existing element such as a wall or floor-ceiling assembly in order to fully describe the part of the building which is exposed to the noise.
A composite plot shows transmission loss vs. frequency for each façade element and sub-element, as well as a calculated transmission loss vs. frequency plot that is the combination of the transmission loss spectra weighted by area for all selected façade elements. An STC rating and OITC rating are also displayed for the calculated transmission loss spectrum.
4.8 Scenario Definition
Scenarios are central to the IBANA-Calc program. Each noise
source-construction combination is defined by the program as a scenario. A scenario is one combination of source details, building façade elements and room details. When setting up a scenario the user must choose the source spectrum and level, possible source distance and direction corrections, the room absorption and the façade elements. The user has the option of naming the scenario so that it can be saved and retrieved at a later date. The program has the ability to calculate and display multiple scenarios as well as to combine scenarios together.
4.9 Duplicating Scenarios
Once the user has defined a scenario, IBANA-Calc allows the user to easily duplicate all details of the scenario. The user can then modify the copy to create small changes for quick comparisons.
4.10 Comparing Scenarios
Once two or more scenarios have been specified, IBANA-Calc allows the user to compare scenarios by displaying the results from several scenarios on one plot. This can be useful for rooms with different facades exposed to different aircraft noise.
4.11 Saving and Recalling Scenarios
Once a scenario has been fully specified, including a source spectrum, floor area and façade elements, the user may wish to save the scenario (.scn Scenario File) for later retrieval. When a scenario is saved to a scenario file, all details of
the scenario are included, such as the source spectrum used and the façade elements specified.
4.12 Printing Reports
The user has the option of printing a hardcopy report of all information pertaining to a scenario. This information can also be written to an electronic file.
4.13 Auditioning Scenarios
The user can listen to a jet aircraft flyby either as it would sound outdoors or indoors for comparison of up to 5 scenarios. They can switch between scenarios during the flyby for better comparisons. The headphones or loudspeakers used to listen to the calculated indoor sounds must be capable of reproducing low frequency sounds that typically will dominate the indoor aircraft noises.
4.14 Database Editing
IBANA-Calc contains two databases – one which contains aircraft noise spectra and one which contains laboratory transmission loss measurements of various common building constructions. The program allows the user to add new data to the two databases. Any added information can be changed or deleted at any time but the initial data provided with the software cannot be changed.
4.15 Database Replacement
IBANA-Calc contains two databases – one which contains aircraft noise spectra and one which contains laboratory transmission loss measurements of various common building constructions. The program allows the user to replace the two databases with new databases of information as long as the files are in the correct format. The file IBANA-Calc_database.xls provided with the software is an example of the correct format and includes all of the data supplied with the software.
5. Description of Each Program Window
5.1 Select Default Source Window
This window allows the user to select “standard” sources from the database or to combine sources to create a “mixed” source. The user is also required to choose an NEF, Leq24 or Ldn value to represent the aircraft noise level at the building in question.
An example of the Select Default Source window and the many boxes it contains is shown in Figure 3
The purpose of this window is to select a noise source to be used in the
calculations. The user can choose a noise source by either selecting a standard source or “mixing” a unique source.
5.2 Standard Sources
The standard sources contained in the program’s noise source database are listed in the Standard Sources Available list-box. To display a plot of any of the spectra, the user simply clicks on any of the standard sources listed and the plot will display in the Source Plot box. To select one of these sources, the user can either double-click on the icon of the chosen source in the Standard Sources
Available list-box or drag the icon from the Standard Sources Available list-box
down into the Selected Sources drop-box. Once a source is selected by the user, it appears in the Selected Source drop-box. A plot of the chosen source appears in the Source Plot box which displays source level vs. frequency over the frequency range of 50 Hz to 5000 Hz.
Unless there is a particular reason to do otherwise, the Standard Aircraft source spectrum should be used.
Once the shape of the source is chosen, the user must enter either an NEF, Leq24 or Ldn value to indicate the level of the noise. This is entered in the appropriately labelled boxes at the bottom of the screen. The user has to enter one of these numbers only, the computer will calculate the corresponding value of the two other numbers which were not entered. The user then presses the
Draw Spectrum button to display a plot of the source spectrum to be used by the
program for this Scenario calibrated according to the selected NEF (or Leq or Ldn) value.
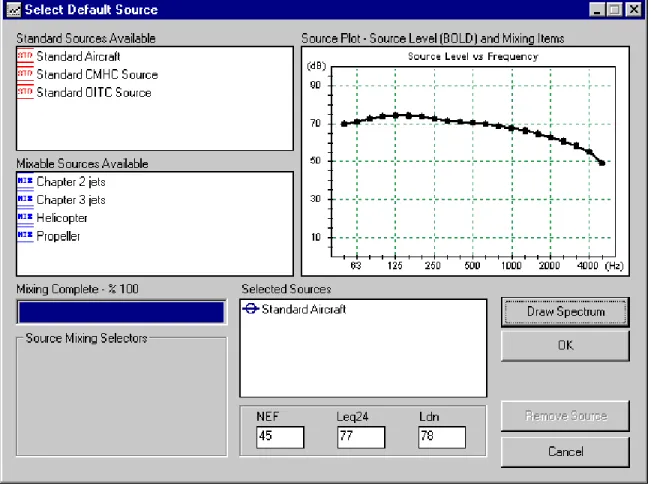
Figure 3: Select Default Source Window – Selection of Standard Source
Figure 3 is an example of what the Select Default Source window would look like if a user choose the Standard Aircraft noise source and entered an NEF value of 45.
5.3 Mixable Sources
Below the Standard Sources Available list-box is the Mixable Sources Available
list-box. This list-box displays the choices of mixable noise spectra that are
contained in the program’s noise source database. To display a plot of any of the spectra, the user simply clicks on any of the standard sources listed and the plot will display in the Source Plot box. To select one of these sources, the user can either double-click on the icon of the chosen source in the Standard Sources
Available list-box or drag the icon from the Mixable Sources Available list-box
down into the Selected Sources drop-box.
The user may choose one or many of the sources listed in the Mixable Sources
Available list-box. As each source is chosen, a plot of the noise spectrum is
displayed for that source in the Source Plot box. After the mixable sources to be used have been chosen, the user must weight each source as a percentage of the total “mixed” source being created.
In order to assign a weight to each selected source, the user should move the
Source Mixing Selectors slider controls that correspond in order to each item in
the Selected Sources list-box. The user must completely specify 100% of the source weighting before successfully creating a “mixed” spectrum. To display a plot showing each of the chosen spectra as well as the final “mixed” spectrum, the user must press the Draw Spectrum button. A plot showing each of the individual sources, using the unique symbol which is shown beside the source name in the Selected Sources drop-box, as well as the resulting “mixed” source, shown in bold, is displayed in the Source Plot box. The plot displays source level vs. frequency over the frequency range of 50 Hz to 5000 Hz.
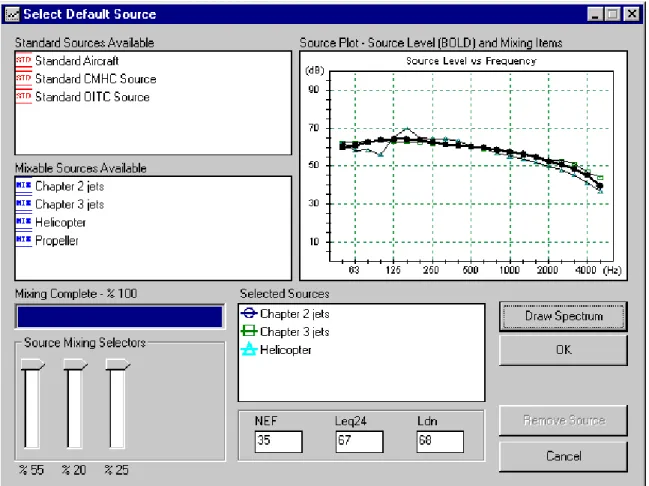
Figure 4: Select Default Source Window – Selection of Mixable Sources
Once the shape of the source is chosen, the user must enter either an NEF, Leq24 or Ldn value to indicate the overall level of the noise. This is entered in the appropriately labelled boxes at the bottom of the screen. The user has to enter one of these numbers only, the computer will calculate the corresponding value of the other two numbers which were not entered. The user then presses the Draw Spectrum button to display a plot of the source spectrum to be used by the program calibrated according to the selected NEF (or Leq or Ldn) value.
Figure 4 is an example of what the Select Default Source window would look like if a user chose a mixable source which comprised 55% Chapter 2 jets, 20% Chapter 3 jets, 25% Helicopters and an NEF value of 35.
To move to the next window, the user presses the OK button.
5.4 Scenario Window
The Scenario window is the central element of the IBANA-Calc application. This window allows the user to have access to all the information about the Scenario including the source spectrum, the construction details of the façade elements, and the resulting sound levels in the target room.
In Scenario window the user must first define the room absorption as a percentage of floor area. The absorption value is determined from the
combination of the type of room and floor area of the room and affects the overall indoor sound level calculated by IBANA-Calc. The program has several pre-set absorption values that correspond to common rooms in houses and office buildings such as bedrooms, meeting rooms, living rooms, offices, kitchens and work areas. The user can choose one of these pre-set values by clicking the radio button for their selection in the Room Absorption box. By choosing one of the four options the slider indicating absorption as a percentage of floor area will set itself to a value which is stored in the program, representing the chosen room.
To choose a value other than one that is pre-set, the user can move the
Absorption as a Percentage of Floor Area slider to any value in the range of
50-150 percent. Once the user changes the slider value, the radio button “other” is automatically selected.
The user must next define a floor area. This can be done several ways. The user may directly enter a value in the Area box. If the user does not know the area, the Calc button may be pressed. The Enter Floor Area window will appear giving the user the option of entering the length and width of the room. The default units used by IBANA-Calc are metric however, the units may set to imperial under the WindowÆOptionsÆNew Scenario Default Units menu item. The units can be set for each individual scenario.
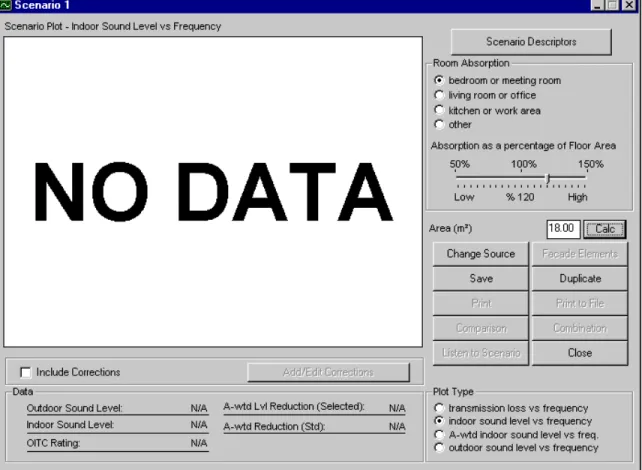
Figure 5 shows the Scenario window once the room absorption and floor area have been set but before any façade elements have been defined. In Figure 5 a bedroom or meeting room of 18 square metres has been chosen.
Figure 5: Scenario Window – with room absorption and floor area defined
Once the room absorption and floor area are entered the user can choose the façade elements by pressing the Façade Elements button.
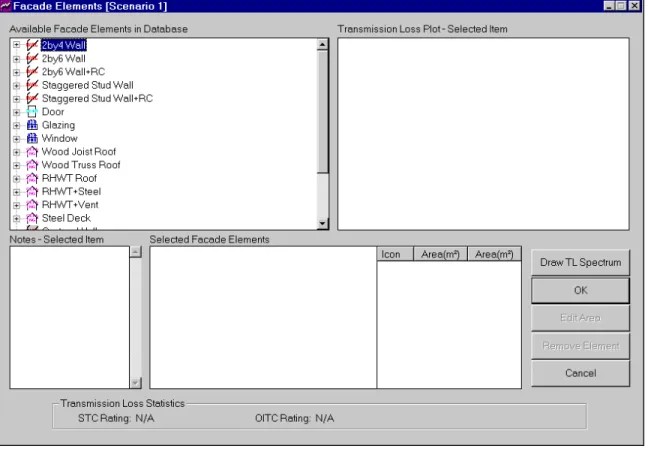
5.5 Façade Elements Window
This window allows the user to specify the construction of the elements which are exposed to the noise. Adding façade elements to a scenario specifies the
building construction details of the Scenario and is thus the basis for transmission loss calculations.
IBANA-Calc contains a database of laboratory transmission loss measurements for various building façade elements. The constructions contained in the
program’s façade element database are listed in the Available Façade Elements
in Database list-box.
Figure 6 shows the Façade Elements window before any elements have been chosen.
Figure 6: Facade Elements Window – no façade elements selected
Each construction listed in the database appears in coded format in the Available
Façade Elements in Database list-box. A listing of what each code stands for
can be found in Appendix A or in the programs Help feature. The constructions are divided into several categories. The major groupings are by type of façade element: wall, roof-ceiling, doors, windows, glazing units. Wall and roof-ceiling assemblies are divided into smaller categories by framing type. Walls are divided into the following categories: 2x4, 2x6, 2x6 + resilient channels, staggered stud and staggered stud + resilient channels. Roof-ceilings are divided into: wood joist, wood truss, raised heel wood trusses, and steel decks. The menus in the Available Façade Elements in Database list-box can be expanded and collapsed by pressing on the “+” sign and “-“ sign respectively.
An example of a coded construction is:
VIN1_GFR25_OSB11_WS89(406)_GFB89_RC13(406)_2G13
This code describes the construction of a 2” by 4” (38 x 89 mm) wood stud wall from one face to the other. The description of each component is as follows:
VIN1 1 mm thick vinyl siding
GFR25 25 mm thick rigid glass fibre insulation OSB11 11 mm thick oriented strand board
WS89(406) 38x89 mm wood studs spaced 406 mm on centre GFB89 89 mm thick glass fibre batts
RC13(406) 13 mm resilient channels spaced 406 mm on centre 2G13 2 layers of 13 mm thick gypsum board
By single clicking on any of the coded descriptions of façade elements, a
description in words of the selected construction will appear in the Notes box. A plot of transmission loss vs. frequency over the frequency range of 50 Hz to 5000 Hz for the selected construction will appear in the Transmission Loss Plot
box. As well, the STC rating and OITC rating will appear at the bottom of the
screen in the Transmission Loss Statistics box.
5.6 Choosing Façade Elements
To select one of the façade elements for a scenario, the user can either double-click on the coded description of the chosen element in the Available Façade
Elements in Database list-box or drag the description from the Available Façade Elements in Database list-box down into the Selected Façade Elements drop-box. Once a façade element is chosen, an area calculator dialogue box opens.
This dialogue box requires the user to enter either the area or the width and height of the façade element in metric or imperial units. Once an element is selected by the user and its area has been entered, it appears in the Selected
Façade Elements drop-box with its coded description, assigned symbol used in
the plot, and area in square metres. A plot for the chosen element appears in the
Transmission Loss Plot box which displays transmission loss vs. frequency over
the frequency range of 50 Hz to 5000 Hz. As well, the STC rating, OITC rating and A-weighted level reduction will appear at the bottom of the screen in the
Transmission Loss Statistics box for the selected façade element.
5.7 Choosing Façade Sub-Elements
It is also possible to define façade elements as sub-elements of existing elements. For example putting a window in a wall. When a sub-element is added to an existing element, the area of the sub-element is subtracted from the area of the existing parent element and both areas are displayed.
user then highlights the sub-element in the Available Façade Elements in
Database list-box and drags it over to the Selected Façade Elements drop-box.
The sub-element is dropped onto the “parent” Façade Element which already appears in the Selected Façade Elements drop-box. The area calculator
dialogue box opens and the user is required to enter either the area or the width and height of the façade element in metric or imperial units. The sub-element is then listed in the Selected Façade Elements drop-box under the parent element rather than as a separate element. The plot in the Transmission Loss Plot box is updated showing a plot of each element and sub-element with their
corresponding symbols as defined in the Selected Façade Elements drop box as well as a composite plot, shown in bold, of the combination of parent and sub-elements. As well, the STC rating and OITC rating in the Transmission Loss
Statistics box are shown for the composite element.
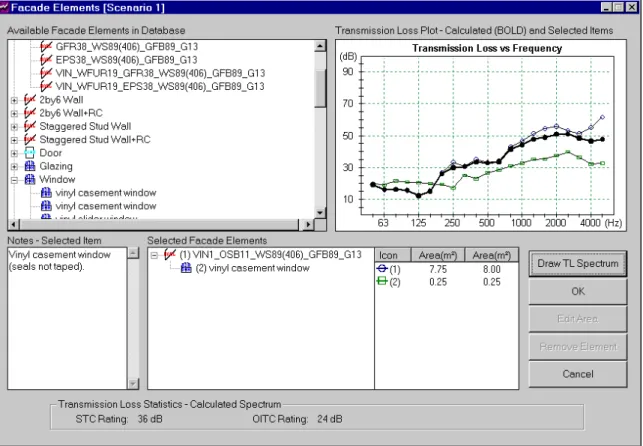
The user may select several façade elements and sub-elements. After choosing the desired façade elements and sub-elements, the composite transmission loss vs. frequency plot can be updated by pressing the Draw TL Spectrum button. This plot shows each façade element as a unique data series with a unique plot symbol associated with each element. The plot also shows a bolded Calculated Transmission Loss data series that is the combination of the transmission loss spectra weighted by area for all selected Façade Elements. At the bottom of the window, the STC Rating and OITC Rating is displayed for the calculated
transmission loss spectrum.
Figure 7 shows the Façade Elements window with an 8.0 m2 wall chosen as the parent façade element and a 0.25 m2 vinyl slider window as the sub-element in the wall. As shown in the Selected Façade Elements drop box, the wall area has been adjusted for the size of the window.
Figure 7: Facade Elements Window – a wall and window are selected as elements and sub-elements respectively
At any time, the user may remove defined façade elements by highlighting the element to be removed in the Selected Façade Elements drop box and pressing the Remove Element button.
Once all the desired elements and sub-elements have been defined in the
Façade Elements window, the user presses on the OK button to return to the Scenario window.
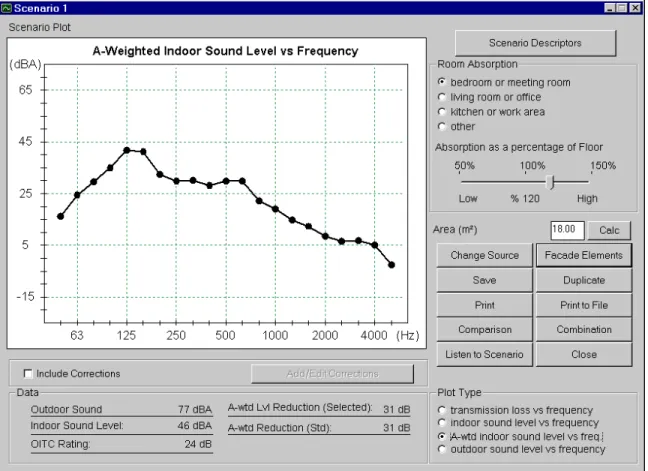
When the user is returned to the Scenario window, a plot now appears in the
Scenario Plot box. The user has the option of displaying four different plots:
transmission loss vs. frequency, indoor sound level vs. frequency, A-weighted indoor sound level vs. frequency and outdoor sound level vs. frequency. The type of plot is chosen in the Plot Type box in the bottom right hand corner of the
Scenario window.
Figure 8 shows a plot of A-weighted indoor sound level vs. frequency with the standard aircraft noise spectrum chosen as the source, the room absorption of a bedroom or meeting room, 18 square meter floor area and a façade element of a 8 m2 wall with a 0.25 m2 window in it. The Data box at the bottom of the window displays a number of different single number ratings for the scenario.
Figure 8: Scenario Window – plot of A-weighted indoor sound level vs. frequency
The Scenario window can also be used to define a scenario descriptor, change the source, save a scenario, duplicate a scenario, print a scenario, print a scenario to file, compare scenarios, combine scenarios and listen to a scenario. This window also gives the user the choice of including corrections or not. Each of these options is described below.
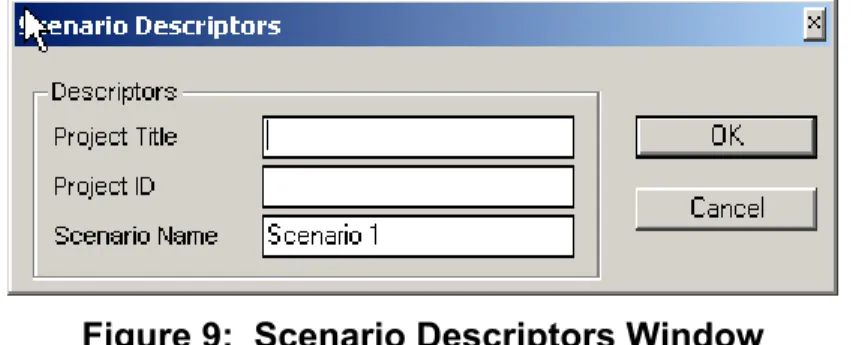
5.8 Define a Scenario Descriptor
By pressing on the Scenario Descriptors button in the top right corner of the
Scenario window, the user is able to enter useful information that describes a
certain scenario. When the Scenario Descriptors button is pressed the Scenario
Descriptors window appears, as shown below.
Figure 9: Scenario Descriptors Window
The user can then enter a Project Title and Project ID for the scenario as well a Scenario Name.
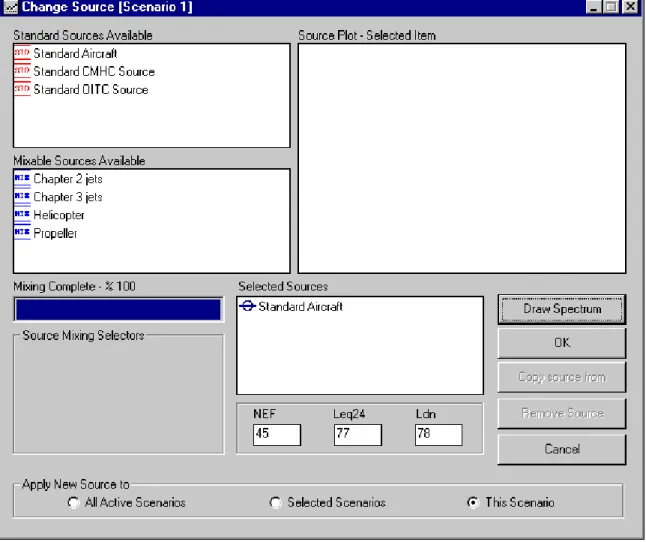
5.9 Change Source
The Change Source button in the Scenario window can be used to change the source used in the scenario. When the Change Source button is pressed, the
Figure 10: Change Source for Scenario 1 Window
The user then has the option of changing the source type and level. The user can choose a noise source by either selecting a standard source or “mixing” a unique source as previously described in the Standard Sources and Mixable Sources sections (Section 5.2 and 5.3) of this manual.
The Change Source window offers an additional option at the bottom of the screen. The user can choose to apply the source changes to all active scenarios, all selected scenarios or this scenario only.
Unless there is a particular reason to do otherwise, the Standard Aircraft source spectrum should be used.
If the Selected Scenarios option is chosen, the Apply Source – Choose
Scenarios to Update window appears. The user selects the scenarios which the
changed source is to apply to in the Active Scenarios list-box by double clicking, dragging and dropping into the Scenarios to Update box, or selecting and then moving with the Æ button. After the Scenarios have been chosen, the user must click the OK button to complete the operation. The source used in the selected
Figure 11: Apply Source – Choose Scenarios to Update Window
From the Change Source window, the user can also copy the source by pressing the Copy Source button. The Copy Source button will only be active if more than one Scenario is open. When the Copy Source button is pressed the Copy
Source Preview window opens. The user then clicks on the scenario name of
the source to be copied, as displayed in the Active Scenarios list box.
This option is useful if a complicated mixed source has been defined.
5.10 Save Scenario(s)
Once the user has defined a scenario (source, room absorption, façade elements) it is possible to save the scenario for future use. All details of the defined scenario are saved, such as the source spectrum used and the façade elements that specify the construction of the building.
To save the scenario the user presses the Save button in the Scenario window or chooses Save Scenarios from the Scenario menu. The Save Scenario(s) to
Scenario File window will appear (see Figure 13).
Figure 13: Save Scenario(s) to Scenario File Window
By pressing the Browse button, the Save Scenarios In window appears. From this window, the user can enter a name for the scenario file or choose a
previously saved scenario file. The user also chooses the folder in which the scenario file will be saved. When the Save button is pressed, the user will be returned to the Save Scenarios(s) to Scenario File window.
The filename and path of the scenario file will appear at the top of this window. The scenario names which are already saved in this scenario file will appear in the Scenarios in Scenario File box. The names of the scenarios which are active and are available to be added to the file, will be listed in the Active Scenarios to
Save list-box.
The user selects the scenario names in the Active Scenarios to Save list-box to be saved, by double clicking, dragging and dropping into the Scenarios to Save
scenario names listed in the Active Scenarios to Save list-box to the Scenarios to
Save box.
After the scenario names have been chosen, the user must click the Save
Scenario(s) button to complete the operation. To remove scenario names from
the Scenarios to Save box, the user can highlight the scenario name and press the Å button. Pressing the << button will remove all scenario names listed in the Scenarios to Save box.
The file is saved with the extension .scn. Each scenario file may contain multiple scenarios. When a scenario is saved to a Scenario File, all details of the
scenario are included, such as the source spectrum used and the façade elements that specify the construction of the building.
Figure 14 shows a scenario file named example.scn. This file has one scenario named Scenario 1 already saved in it. When the Save Scenario(s) button is pressed a second scenario (named Scenario 2) will be saved to the file named example.scn.
Figure 14: Save Scenario(s) to Scenario File Window – Scenario 2 being added to example.scn
The Save Scenario(s) to Scenario File window can also be used to change the name of a scenario by highlighting the scenario and pressing the Rename button. The Save Scenario(s) to Scenario File window can also be used to delete a scenario from a scenario file by highlighting the scenario and pressing the Delete
5.11 Duplicate a Scenario
By pressing the Duplicate button in the Scenario window, the presently active scenario will be duplicated. All details of the scenario are duplicated – source spectrum, room absorption and façade elements. The name of the duplicated scenario will automatically be given a scenario number. The user can change the scenario name by pressing the Scenario Descriptors button or by using the
Rename button when the duplicated scenario is saved.
5.12 Print a Scenario on Paper
By pressing the Print button, a hardcopy of the scenario results will be printed. The printed report comprises three pages. The first page lists information about the scenario including the source spectrum chosen by the user, the receiving room details and the chosen façade element details. The second and third pages show the four plots and single number ratings which apply to the scenario. The plots are indoor sound level vs. frequency, A-weighted indoor sound level vs. frequency, transmission loss vs. frequency and source sound level vs. frequency (calibrated according to NEF, Leq24 and Ldn). All plots display values over the frequency range of 50 Hz to 5000 Hz. Beside each plot is a table of the data used to produce the plot.
5.13 Print a Scenario to File
By pressing the Print to File button, the Print Scenario to File window appears. From this window, the user enters a filename for the report to be saved in. All information from the hardcopy report is saved in a text file with the extension .txt. The only difference between the hardcopy printout and the text file is that the plots are saved as tables of data in the text file and are not shown in graphical form. When the Save button is pressed, the user will be returned to the Scenario
window.
5.14 Compare Scenarios
When the Comparison button is pressed the Choose Scenarios to Compare
Figure 15: Choose Scenarios to Compare window
The user selects the scenarios for comparison from the Active Scenarios list-box by double clicking, dragging and dropping into the Scenarios to Compare box, or selecting and then moving with the Æ button. To remove a scenario the user
highlights the scenario and presses the Å button. After the scenarios have been
chosen, the user clicks the OK button to complete the operation. The Scenario
Figure 16: Scenario Comparison Window
The Scenario Comparison window displays a plot of all scenarios the user chose to compare. The user has the option of displaying four different types of plots in the window: indoor sound level vs. frequency, A-weighted indoor sound level vs. frequency, transmission loss vs. frequency and outdoor sound level vs.
frequency. The type of plot is chosen in the Plot Type box in the bottom right hand corner of the Scenario Comparison window.
IBANA-Calc lets the user make changes to scenarios while the Scenario
Comparison window is open. If changes are made, the user will have to press
the Refresh button to update the comparison graph.
5.15 Combine Scenarios
When the Combination button is pressed the Choose Scenarios to Combine
window appears.
Figure 17: Choose Scenarios to Combine Window
The user selects the scenarios for combination from the Active Scenarios list-box by double clicking, dragging and dropping into the Scenarios to Combine box, or selecting and then moving with the Æ button. To remove a scenario the user
highlights the scenario and presses the Å button. After the scenarios have been
chosen, the user clicks the OK button to complete the operation. The Scenario
Figure 18: Scenario Sound Level Combination window – two scenarios combined, indoor sound level plot displayed
The Scenario Sound Level Combination window displays a plot of all scenarios the user chose to combine along with the results for the combination of the scenarios, shown in bold. The overall A-weighted indoor sound level is also calculated and displayed at the lower right of this window.
The user has the option of displaying two different plots in the window: indoor sound level vs. frequency or the A-weighted indoor sound level vs. frequency. The type of plot is chosen in the Plot Type box in the bottom right hand corner of the Scenario Sound Level Combination window.
Pressing the Print button will print a hardcopy of the two plots.
5.16 Listen to Scenario
The user can listen to the sound of a jet aircraft flyby either outdoors or indoors according to the details of particular scenarios. To start the process the user clicks the Listen to Scenario button on the Scenario window or chooses this menu item under the Scenario menu.
The Choose Scenarios for Audio Playback screen then appears as illustrated in Figure 19. The user can choose up to 5 scenarios for audio comparison.
The user selects the scenario names in the Active Scenarios list-box, by double clicking, or dragging and dropping into the Scenarios for Playback box, or selecting and then moving with the Æ button.
Figure 19: Scenarios for Audio Playback Window - 1 of 3 available scenarios selected
Calculations can be performed in either octave or 1/3 octave bands. Normally octave band calculations should be used because the process is much faster when using octave bands and the extra detail of the 1/3 octave calculations is rarely required. Choosing fewer scenarios will also speed up the calculation time. After the scenarios to be compared have been selected, click the OK
Figure 20: IBANA Audio Playback Window - progress bar indicates calculations partially complete
Figure 21: IBANA Audio Playback Window – Play button selected
After clicking the OK button on the Choose Scenarios for Audio Playback
window, the IBANA Audio window will appear and the horizontal progress bar will
indicate the progress of the audio calculations. When the calculations are
complete the progress bar will disappear and the user can press on the Listen to
Source button or the Play button.
Pressing the Listen to Source button plays the sound of the outdoor aircraft flyby (outdoor sounds are actually 10 dB quieter relative to the indoor sounds than indicated to reduce the range of playback sound levels).
Pressing the Play button will play the calculated indoor sounds for the selected scenario. Clicking the radio buttons allows the user to switch between scenarios without interrupting the progress of the aircraft flyby. When the Continuous Play box is checked, the flyby is repeated until the user presses the Stop button. To close the IBANA Audio window the user presses the Finish button.
5.17 Source and Transmission Loss Spectrum Corrections
On the Scenario window, the user has the option of choosing to include corrections by checking the Include Corrections checkbox. If the Include
Corrections checkbox is checked, the Add/Edit Corrections button becomes
active. When the Add/Edit Corrections button is pressed the Source and TL
Spectrum Correction window appears.
Figure 22: Source and TL Spectrum Correction Window – air absorption correction selected
To apply a correction to the active Scenario the user clicks the checkbox next to the correction to be applied. A brief description of the correction is shown on the screen if the correction name is highlighted. The user can find more details about each of the corrections listed in Section 4.5 of this manual.
To return values to defaults the user presses the Restore Defaults button. To close this window the user presses the Finish button.
5.18 Load Scenario(s)
To load a previously saved scenario file the user chooses Load Scenarios from the Scenario menu. The Open Scenario File window will appear. Once the scenario file has been chosen, the Load Scenario(s) from Scenario File window appears. This window is similar to the Save Scenario(s) to Scenario File window.
Figure 23: Load Scenario(s) from Scenario File Window
The user can choose which scenarios in the scenario file to load by double clicking, dragging and dropping into the Scenarios to Load drop-box, or selecting and then moving with the Æ button. The >>button will move all scenario names
listed in the Scenarios in Scenario File list-box to the Scenarios to Load box. To remove a scenario the user highlights the scenario and presses the Å button.
Pressing the << button will remove all scenario names listed in the Scenarios to
Load box.
Once all the scenarios which the user wants loaded are listed in the Scenarios to
Load drop-box, the user presses on the Load Scenario(s) button. The user can
see the names of any presently active scenarios in the Active Scenarios box. . The Load Scenario(s) from Scenario File window can also be used to change the name of a scenario by highlighting the scenario and pressing the Rename button. As well, the Load Scenario(s) from Scenario File window can be used to delete scenarios from scenario files by highlighting the scenario and pressing the Delete
From File button.
5.19 Database Editor –Transmission Loss Window
IBANA-Calc contains a database of laboratory transmission loss measurements for various building façade elements. The majority of test results are recent and include 50 exterior walls, 50 roof-ceilings, 40 windows and glazing units and some doors.
The program allows the user to edit, add or delete information from the sound transmission loss database. The Database Editor – Transmission Loss Data
window is shown in Figure 24.
Figure 24: Database Editor – Transmission Loss Data window
Several boxes make up this window. In the top left hand corner is a list-box which displays all constructions contained in the database in coded form. A complete listing of all codes that appear in the program can be found in Appendix A. The coded entries are divided into several categories. The major groupings are by type of façade element: wall, roof-ceiling, doors, windows, glazing units. Wall and roof-ceiling assemblies are divided into smaller categories by framing type. Walls are divided into 2x4, 2x6, 2x6 + resilient channels, staggered stud and staggered stud + resilient channels. Roof-ceilings are divided into wood joist, wood truss, raised heel wood trusses and steel decks.
A plot of transmission loss vs. frequency over the frequency range of 50 Hz to 5000 Hz for the highlighted construction is shown below the list-box of coded constructions.
In the top right hand corner there is a box which lets the user know if the record can be modified or not. For the original data provided with the program, the records are READ ONLY, and cannot be edited. For data that the user has entered, records are labelled READ/WRITE RECORD and can be modified. This window also contains information about the construction including a box which
displays the construction coding (descriptor), a box which indicates the type or category of the construction, the date the test was performed, the Test ID and notes which explain the construction in words.
Below this there are two boxes in a row which display single number ratings for the construction: Outdoor-Indoor Transmission Class (OITC) and Sound
Transmission Class (STC).
Below the single number ratings, there are three columns of boxes in which the measured transmission loss data for each frequency is displayed.
Using this window the user is able to perform a number of operations on the records in the transmission loss database. At the very bottom of the window, the record number and the number of records in the database are displayed. The user can use the Previous and Next buttons to move back to the previously displayed record or move to the next record in the database.
To create a new record, the user must press the New button. The window below will appear.
Figure 25: Database Editor – Transmission Loss Data window for a new record
To add a new record, the user should enter either a coded description or some sort of title that identifies the construction in the Descriptor box. The descriptor
The user should then choose a category for the new construction from the Type
pulldown menu. The construction will appear under the chosen type in the
Construction list-box. The user is limited to five types: custom walls, custom windows, custom doors, custom roof-ceilings, custom others. IBANA-Calc does not give the user the option of adding other construction categories.
When entering new data, the current date will appear as the default in the Date
box. The user has the option of changing the date or leaving it as is.
The user may choose to enter a test identifier or leave the Test ID box blank. The user has the option of entering notes in the Notes box or leaving this box empty. The Notes box can be used to add additional comments about the construction.
The user then enters the one-third octave band airborne sound transmission loss data for the frequency range of 50 Hz to 5000 Hz. The user also has the option of pasting data from the clipboard using the Paste button. Data can be cut from either a row or column of data in an MS Excel spreadsheet and pasted into the transmission loss database.
Once all this information is entered, the record is saved into the transmission loss database by pressing the Save button.
Any records added to the database can be removed at any time by displaying the record on the screen and then pressing the Delete button.
5.20 Database Editor – Source Data Window
IBANA-Calc currently includes aircraft noise spectra for Chapter 2 and Chapter 3 jet aircraft as well as spectra for propeller aircraft and helicopters. It also
includes several standard spectra such as those previously used in the Canada Mortgage and Housing Guide1, the spectrum in the ASTM OITC standard E13322 and a new standard aircraft spectrum based on measurements at Ottawa,
Vancouver and Toronto airports.
The program allows the user to edit, add or delete information from the Aircraft Noise Spectrum database. The Database Editor – Source Data window is shown in Figure 26.
Figure 26: Database Editor – Source Data window
Several boxes make up this window. In the top left hand corner is a list-box which displays the sources in the database. There are three main categories: Standard Sources, Mixable Sources and Custom Sources. It should be noted that only those sources listed under Custom Sources can be edited.
A plot of level vs. frequency over the frequency range of 50 Hz to 5000 Hz for the highlighted source is shown below the Sources in Database list-box.
In the top right hand corner there is a box which lets the user know if the record can be modified or not. If the record is READ ONLY, it cannot be edited.
However, data that the user has added will be labelled READ/WRITE RECORD and can be modified. Below this there is information about the source including a box which displays a description of the source, a box which indicates the type of the source and notes about the source.
Below the Notes box, there are three columns of boxes in which the measured level data for each frequency is displayed.
Using this window the user is able to perform a number of operations on the records in the aircraft noise spectrum database. At the very bottom of the window, the record number and the number of records in the database is
displayed. The user can use the Previous and Next buttons to move back to the previously displayed record or move to the next record in the database.
To create a new record, the user must press the New button. The window below (Figure 27) will appear.
Figure 27: Database Editor – Source Data window for a new record
To add a new record, the user should enter something that identifies the sound source in the Descriptor box. The descriptor will appear in the list-box under Custom Sources. The user does not have a choice for the Type of source - all added data will appear under Custom Sources. IBANA-Calc does not give the user the option of adding to the other source categories.
The user has the option of entering notes in the Notes box or leaving the box empty. The Notes box can be used to add additional comments about the source.
The user then enters the one-third octave band source level data for the frequency range of 50 Hz to 5000 Hz. The user also has the option of pasting data from the clipboard using the Paste button. Data can be cut from either a row or column of data in an MS Excel spreadsheet and pasted into the Aircraft Noise Spectra database.
Once all this information is entered, the record is saved into the aircraft noise spectra database by pressing the Save button.
Any records added to the database can be removed at any time by displaying the record on the screen and then pressing the Delete button.
6. Main Menu and Menu Items Reference
Each of the menu items is described below. Many menu items simply offer an alternative method of performing various operations.
6.1 File
6.1.1 FileÆClose
This menu item will prompt the user to save all changes for the active scenario window. The active scenario window will then close.
6.1.2 FileÆExit
This menu item will prompt the user to save all changes and the program will terminate.
6.2 Source
6.2.1 SourceÆSelect Default Source
This menu item will take the user to the Select Default Source window where the user can define the default source. The newly chosen default source will be used for all subsequent scenarios until it is changed again.
6.2.2 SourceÆPrint Default Source
This menu item will print a hardcopy of the default sound source used in the active scenario window. The NEF, Leq24 and Ldn values, details about the source spectrum and a plot of sound level vs. frequency will be printed.
6.3 Scenario
6.3.1 ScenarioÆNew Scenario
This menu item will take the user to the Select Default Source window and will open a new Scenario window.
6.3.2 ScenarioÆLoad Scenario
This menu item will take the user to the Open Scenario File window so the user can choose a previously saved scenario to load.
6.3.3 ScenarioÆSave Scenario
This menu item will take the user to the Save Scenarios(s) to Scenario File
window. The user can then define a scenario filename and choose which