Publisher’s version / Version de l'éditeur:
Journal of Applied Fire Science, 4, 2, pp. 83-93, 1994-06-01
READ THESE TERMS AND CONDITIONS CAREFULLY BEFORE USING THIS WEBSITE. https://nrc-publications.canada.ca/eng/copyright
Vous avez des questions? Nous pouvons vous aider. Pour communiquer directement avec un auteur, consultez la première page de la revue dans laquelle son article a été publié afin de trouver ses coordonnées. Si vous n’arrivez pas à les repérer, communiquez avec nous à [email protected].
Questions? Contact the NRC Publications Archive team at
[email protected]. If you wish to email the authors directly, please see the first page of the publication for their contact information.
NRC Publications Archive
Archives des publications du CNRC
This publication could be one of several versions: author’s original, accepted manuscript or the publisher’s version. / La version de cette publication peut être l’une des suivantes : la version prépublication de l’auteur, la version acceptée du manuscrit ou la version de l’éditeur.
Access and use of this website and the material on it are subject to the Terms and Conditions set forth at
Applicability of temperature predicting models to building elements
exposed to room fires
Lie, T. T.; Gosselin, G. C.; Kim, A. K.
https://publications-cnrc.canada.ca/fra/droits
L’accès à ce site Web et l’utilisation de son contenu sont assujettis aux conditions présentées dans le site LISEZ CES CONDITIONS ATTENTIVEMENT AVANT D’UTILISER CE SITE WEB.
NRC Publications Record / Notice d'Archives des publications de CNRC:
https://nrc-publications.canada.ca/eng/view/object/?id=72168249-e0e0-44fd-b146-eb9a9dfff810 https://publications-cnrc.canada.ca/fra/voir/objet/?id=72168249-e0e0-44fd-b146-eb9a9dfff810
http://www.nrc-cnrc.gc.ca/irc
Applic a bilit y of t e m pe ra t ure pre dic t ing m ode ls t o building e le m e nt s
e x pose d t o room fire s
N R C C - 3 7 9 1 9
L i e , T . T . ; G o s s e l i n , G . C . ; K i m , A . K .
J u n e 1 9 9 4
A version of this document is published in / Une version de ce document se trouve dans:
Journal of Applied Fire Science, 4, (2), pp. 83-93, June 01, 1994
The material in this document is covered by the provisions of the Copyright Act, by Canadian laws, policies, regulations and international agreements. Such provisions serve to identify the information source and, in specific instances, to prohibit reproduction of materials without written permission. For more information visit http://laws.justice.gc.ca/en/showtdm/cs/C-42
Les renseignements dans ce document sont protégés par la Loi sur le droit d'auteur, par les lois, les politiques et les règlements du Canada et des accords internationaux. Ces dispositions permettent d'identifier la source de l'information et, dans certains cas, d'interdire la copie de documents sans permission écrite. Pour obtenir de plus amples renseignements : http://lois.justice.gc.ca/fr/showtdm/cs/C-42
JOURNAL OF
Applied Fire Science
Executive Editor:
PAUL R. DeCICCO
Volume 4, Number 2 - 1994-95
Applicability of Temperature Predicting Models to Building Elements Exposed to Room Fires
T. T.
Lie, G.C.
Gosselin, andA. K KimBaywood Publishing Company, Inc.
26Austin Avenue, Box 337 Amityville, NY 11701
Call (516) 691·1270 Fax (516) 691·1nO Orders only -call toll-free (800) 638-7819
J.APPLIED FIRE SCIENCE, Vol. 4(2) 83-93,1994-95
APPLICABILITY OF TEMPERATURE PREDICTING
MODELS TO BUILDING ELEMENTS
EXPOSED TO ROOM FIRES
T.T.LIE
G. C. GOSSELIN
A. K. KIM
National Research Council of Canada Institute for Research In Construction
ABSTRACT
The validity of mathematical models for the prediction of temperatures attained in a clay brick wall and a protected steel column is examined. For this purpose, test specimens consisting of a clay brick wall and a square hollow steel column, protected with vermiculite board, were exposed to fire in two full scale room bums and the temperatures measured in the specimens. Using existing mathematical models and published thermal properties of the materials of which the test specimens were composed, the temperatures in the specimens were calculated. A comparison between measured and calculated temperatures showed that it is possible to predict the temperatures of the test specimens with relatively high accuracy, in spite of the large temperature fluctuations that occurred during the room bums.
INTRODUCTION
Over the years, a large number of mathematical models have been developed to predict the temperatures and structural behavior of fire-exposed building ele-ments. These are commonly referred to as fire resistance models. In general, the validity of these models is verified by comparing calculated results with those obtained during exposure of a test specimen to a well-controlled fire in a test furnace. Such fires can usually be controlled to follow a predetermined fire
84 / LIE, GOSSELIN AND KIM
temperature course; the heat transfer from the furnace to the test specimen is also controllable and the temperatures in the furnace chamber are reasonably uniform. This is not the case in actual compartment fires. The temperatures in these fires are generally not uniform and the heat transfer to exposed objects, as well as the fire temperature course itself, are more erratic than in test furnaces.
As a part of a project to investigate the influence of the properties of the bounding walls on the severity of room fires, studies were conducted to verify the accuracy of mathematical models for the prediction of the temperatures of build-ing elements exposed to room fires. For this purpose, two mathematical models of building elements with known thermal properties were selected. The models, which were developed at the National Fire Laboratory (NFL) of the Institute for ResearchinConstruction, National Research Council of Canada, comprised of a model for the prediction of the temperatures of clay brick walls [l, 2] and another for the prediction of the temperatures of hollow steel sections protected with venniculite board [1,3]. Specimens of these building elements were constructed and their temperatures measured during exposure to fire in full scale room bum experiments.
FULL SCALE ROOM BURN EXPERIMENT
Two full scale room bum experiments were carried out in a test room designed
towithstand the severity of post-flashover fires.
Test Room
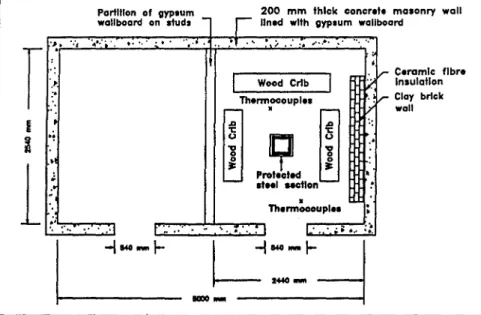
The test room, built of 200 rom thick masonry blocks, had inside dimensions of 5.0 m by 2.54 m and a height of 2.44 m (Figure 1). In each experiment, the test room was separated by partitions into two compartments of equal size, one of which was the bum room and the other a room to which the fire eventually could spread through the partition. Spread of fire will notbe considered in this study, however.
All construction and instrumentation details for the two experiments were identical except that,inthe first test, a wood stud frame with one layer of gypsum board on each side was used as a dividing partition; and, in the second test, a steel stud frame covered by one layer of gypsum board on each side was used for the same purpose.
Wood cribs were used to simulate office furniture to ensure repeatability of test conditions. The cribs in both tests were equivalent to a fire load of 60.3 kg/m2of floor area. All cribs were ignited simultaneously to simulate a rapidly developing
fireleading to flashover conditions. A ventilation opening, 0.584 m in width and 0.66 minheight, was provided in each room at an elevation of 1.32 m from the floor level. The walls and floor of the bum room were covered with gypsum
TEMPERATURE PREDICTING MODELS I 85
Partition of gypsum 200 mm thick concr.t. masonry wall wallboard on studs -
r
lined with gypsum wallboard•... t ':,
T
": Lセ'.
I
.;i
1
;.
•
.
'-
.
' ...:.'.
to ,,' • • • t·:: .. ' .... .••
. Ir C.ramlc flbr. /. Insulatlon , ,rCloy brick y wall " " .'•
Th.rm_pl••..,
..
,::.
Figure 1. Schematic diagram oft95troom.
board. The ceiling was protected with ceramic fiber insulation to enable it to withstand the complete burnout of the two compartment fires.
Bum room temperatures were measured with eight thermocouples. Four were attached, at equal vertical distance of approximately 500 mm between floor and ceiling, on each of two trees at different locations (Figure 1).
Test Specimens
Two test specimens, namely, a clay brick wall and a protected square hollow steel column were simultaneously exposed to fire in each of the two burn rooms.
The clay brick wall was 1220 mm in width by 1830 mm in height and had a thickness of 200 mm. It was insulated at the non fire-exposed face with ceramic fiber blanket and placed with this side against the concrete wall of the room (Figure 1). To measure the temperatures of the clay brick wall, five thermocouples were installed at various depths, namely one at the center of the exposed surface and the other four at respectively 33 mm, 66 mm, 99 mm, and 198 mm distance from the exposed surface.
The square hollow steel column had a height of 1830 mm and a cross section with 150 x 150 mm outside dimensions. It was protected at all sides by a 25 mm thick vermiculite board. The steel temperatures were measured at the mid-height
86 / LIE, GOSSELIN AND KIM
with eight thennocouples, two on each side of the column, peened in the steel at a distance of 50 mm from the corners of the column.
MATHEMATICAL MODEL
The mathematical model for the calculation of the temperatures of the wall are described in detail in [2] and for the calculation of the temperatures of the protected steel column in [3]. In this article these models will not be discussed further. Only an outline of the calculation procedure will be given.
The calculation of the temperatures of the specimens was carried out using a fInite difference method. In this method, the cross-section of the specimens is divided in elementary regions, which are elementary layers for the wall and elementary squares for the protected steel column. For each element its tempera-ture is calculated at selected time intervals during exposure to fIre.Inthis way, the temperature history of the specimens can be determined.
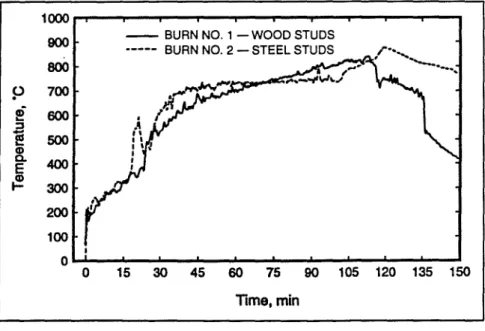
The temperatures of the specimens, reached during exposure to fIre, depend on the fIre temperature course. This temperature course, which is used as input data in the mathematical model, can be a standard temperature course, a calculated temperature course or a measured temperature course. In this study, the measured average temperature course, obtained by averaging the temperatures measured at the eight thennocouple locations in the burn room, was used as input data. The average temperature courses, measured during the two room burns, are shown in Figure 2. Burn No. 1 was with a wood stud partition and Burn No.2 with a steel stud partition.
Because of the fluctuations in temperatures, which made the use of these temperatures as input data more complicated, the temperature courses of the two room burns were approximated by a number of straight lines, which can easily be used as input for the mathematical model. These lines, representing the tempera-ture courses of the two room bums, are shown in Figure 3. They can be given for Bum No. 1 by the following equations:
T=9.4t+ 175.4 for PセエセRS T = 35.6 t-415.1 for RS\エセRW T=7.9t+310.3 for 27 < tセTTNU T = 2.5 t+ 554.8 for 44.5 < tセ 115 T = -12 t + 2212.6 for 115 < tセ 149.5 and for Burn No.2:
T = 8.8 t+ 199.2 for oセエセ 16.5 T = 14.8 t + 156.2 for 16.5 < tセ 32 T = 0.98 t + 660.9 for SR\エセ 100 T = 6.1 t + 139.8 for ャPP\エセ 120 T = -3.3 t
+
1267.7 for 120 < tセ 149.51000 900 800
P
700!
eoo
:::J-
e
500 CD Co 400 Eセ
300 200 100 0 0TEMPERATURE PREDICTING MODELS / 87
- - BURN NO.1 - WOOD STUDS
BURN NO.2 - STEEL STUDS
r
o•---,
...
'...
---
---,
15 30 45 60 75 90 105 120 135 150
lime,min
Figure 2. Average room bum temperatures as a function of time.
1000
P"'I"'-_--.--""T"-""T"-""T"-..,..-..,..-..,.--..---,
P
!
:::Je
8-E{!
300 200 100 0 0- BURN NO.1 - WOOD STUDS BURN NO.2 - STEEL STUDS
15
30
45
60
75
90
105 120 135 150
Tune, min
88 I LIE, GOSSELIN AND KIM
where:
T
=
the fire temperature in °C and t=
the time in minutes.With the approximate temperature courses as input data, the temperatures of the wall and the protected steel specimens were calculated, using the mathe-matical models described in [2, 3) and the relevant thermal properties given in
the Appendix. The calculated results, which will be further discussed, are given below.
RESULTS AND DISCUSSION
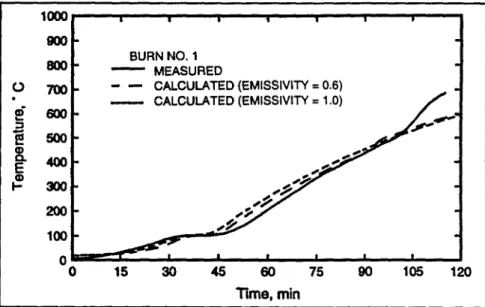
In Figures 4 and 5, calculated steel temperatures for the protected steel columns are compared with those measured during the two room bums. Because the emissivities of the fires were not known precisely, the calculations were made for two emissivities; namely, one for a reasonably high emissivity of 0.6 and the other for the extremely high emissivity of 1.0. It can be seen that, for high emissivities which are normally the case for the luminous flames produced by wood fires, there is almost no influence of the emissivity on the steel temperatures.
The comparison for Burn No.1 (Figure 4) showed a good agreement between calculated and measured temperatures up to about 100 minutes. After this time,
BURN NO. 1 MEASURED CALCULATED (EMISSIVITY=0.6) _ CALCULATED (EMISSIVITY=1.0) 1000 900 800 0 700 a) 600 セ ::J
e
5008-
400 Eセ
300 200 100 0 0 15 30 45 60 Time, min 75 90 105 120Figure 4. Measured and calculated steel temperatures as a function of time for Bum NO.1.
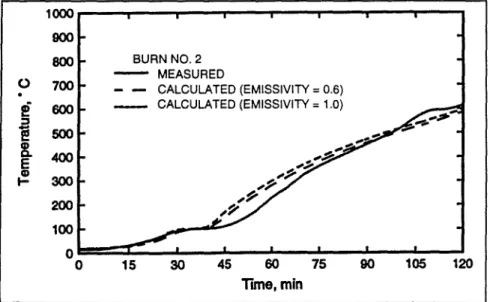
TEMPERATURE PREDICTING MODELS / 89 BURN NO.2 MEASURED CALCULATED (EMISSIVITY
=
0.6) CALCULATED (EMISSIVITY=
1.0) 1000 900 800 0 700e
600 セe
5008-
400 Eセ
300 200 100 0 0 15 30 45 60 75Tune,min
90 105 120Figure 5. Measured and calculated steel temperatures as a function of time for Bum No.2.
the measured temperatures rose considerably faster than those calculated. This sudden rise in steel temperature can be attributed to the formation of openings in the joints at the corners of the protective vermiculite boards. Therefore, calcu-lated and measured temperatures could no longer be compared. For Burn No.2 (Figure 5), the comparison showed good agreement between calculated and measured steel temperatures for the whole duration of the experiment.
The results for the clay brick wall are shown in Figures 6 and 7, where calculated wall temperatures are compared with those measured at various depths in the wall. The comparisons are made for two times during exposure to fire, namely, for sixty and 120 minutes after the start of the fire.
The results show that there is good agreement between the temperatures measured at various depths in the walls and those calculated. The maximum difference between measured and calculated temperatures is approximately 20 percent, which is small taking into account the several factors that determine the results, such as, accuracy of the thermal properties used, location of the thermo-couples in the walls and the approximation of the fire temperature course used as input data.
The results indicate that it is possible, using existing methods, to predict the temperatures in building elements exposed to real world fires with relatively high accuracy, provided the temperatures of the fire, to which the building element will be exposed, are known. Unfortunately, this is not the case at the design stage of a
90 / LIE, GOSSELIN AND KIM 198 165 132 MEASURED CALCULATED 120min 99 Depth,mm BURN NO.1 0 - 0 . A . - A 66 33 1000 , , - - - . , . . . - -...- - . , . . . - -...--..,.---, 900 800
P
700 セ 600 ::le
500 Gl セ 400{!?
300 200Qセ lセ]ZセZ]ZZZセセM[MセMセMセMセM[セ[[[[[[ZZj
o
Figure 6. Measured and calculated clay brick temperatures as a function of depth for Burn NO.1.
198 165 132 99 120 min BURN NO.2 o - 0 MEASURED .A. _ . . CALCULATED 66 33 1000
r---.,...--.,...--..,.---...--..,.---,
900 BOO 700 600 500 400 300 200Qセl
__
NMZセセ[[セセセ[[[Z]ャ
o
Oepth,mmFigure 7. Measured and calculated clay brick temperatures as a function of depth for Burn NO.2.
TEMPERATURE PREDICTING MODELS / 91
building. It is possible, however, to indicate fire temperature courses, representing a severity which will likely not be exceeded in the event of fire in the building under consideration [1,4-9]. Using these temperature courses as input data in the mathematical models, the thermal behavior of building elements can be evaluated with relatively high accuracy.
CONCLUSIONS
The results of this study indicate that, in spite of the erratic temperature fluctua-tions met within room fires, the prediction of the thermal behavior in such fires for clay brick walls and protected steel can be made with relatively high accuracy. Given the excellent correlation that exists between thennal behavior and fire resistance ratings, designers can thus be provided with flexible and reliable modeling tools.
Inorder to be able to make such fire resistance predictions, at the design stage of a building, it is necessary to know the maximum likely temperature course of the fire to which the building elements will be exposed in the event of fire. Although the intensity and duration of the fire are not predictable, it is possible, using existing data, to indicate a fire whose severity will likely not be exceeded during the service life of the building. This enables the selection, at the design stage, of appropriate measures, such as, wall thickness, steel size and shape or thickness of steel protection, that will provide adequate fire protection for the building. It is expected that, using existing models, similar predictions can be made for other building elements, such as, beams, floors, and columns.
APPENDIX: THERMAL PROPERTIES
The thermal properties used in this study were derived from various publica-tions. The thermal properties for clay brick were published in [3], those for ceramic fiber in [10], those for steel in [1,3] and those for vermiculite board in [11]. The moisture content of vermiculite board was 5 percent by volume. That of the other materials, which normally do not contain a significant amount of water, was assumed to be negligible.
Clay Brick
Therrnalconductivity
k
=
5.07X10⁻⁴ T+
0.935 Thermal capacity92 / LIE, GOSSELIN AND KIM Ceramic Fibre Thennal conductivity k = 2.91X10⁻²+ 6.54
x
10-5T + 2.52X10⁻⁷T2 Thennal capacity pc=
96X103 Steel Thennal conductivity Perfect conductor Specific heat c= 0.478 T+
440 Vermiculite Board Thennal conductivity k = 0.000192 T+
0.135 k=0.327 Thennal capacity pc = 4200 T+
425000pc
= -4250 T+
847500pc
= 335 T+
389000pc=
724000 for for for for for for O:s;T:s; 1000°C T> 1000°C O:s;T:s; 50°C 50<T:S; 100°C 100 < T:s; 1000°C T> 1000°C where: T=
thetemperaturein °Ck
=
the thennal conductivity in J/(m°C) pc=
the thennal capacity in W/(m3°C) c=
the specific heatin J/(kg°C)REFERENCES
1. Structural F"tre Protection, T. T. Lie (ed.), Manuals and Reports on Engineering Practice No.78, American Society of Civil Engineers, New York, 1992.
2. T. T.Lie, Calculation of theFireResistance of Composite Concrete FloorandRoof Slabs,Fire Technology,14: I, 1978.
TEMPERATURE PREDICTING MODELS / 93
3. T. T. Lie and T. Z. Hannathy, A Numerical Procedure to Calculate the Temperature of
Protected Steel Columns Exposed to Fire, National Research Council of Canada,
Division of Building Research, Fire Study No. 28, NRCC 12535, Ottawa, Ontario, 1972.
4. The SFPE Handbook of Fire Protection Engineering, Society of Fire Protection
Engineers, National Fire Protection Association, Quincy. Massachusetts, 1988.
5. K. Kawagoe and T. Sekine, Estimation of Temperature-time Curves in Rooms, Occa-sional Report No. 11, Building Research Institute, Tokyo, 1963.
6. S. E. Magnusson and S. Thelandersson, Temperature-Time Curves of Complete
Process of Fire Development. Theoretical Study of Wood Fuel Fires in Enclosed Spaces, Acta Polytechnica Scandinavia, Civil Engineering and Building Construction
Series No. 65, Stockholm, 1970.
7. T. T. Lie, Characteristic Temperature Curves for Various Fire Services, Fire
Tech-nology 10, pp. 315·326, 1974.
8. O. Pettersson, S. E. Magnusson, and J. Thor, Fire Engineering Design of Structures, Swedish Institute of Steel Construction, Publication 50, 1976.
9. D. Drysdale,An Introduction to Fire Dynamics, John Wiley and Sons Ltd., New
York,1985.
10. Ceramic Fiber Technical Information, Carborundum Company, Niagara Falls, New
York,199O.
11. T.Z Harmathy, Properties of Building Materials at Elevated Temperatures, National
Research Council of Canada, Division of Building Research, DBR Paper No. 1080, NRCC 20956, Ottawa, Ontario, 1983.
Direct reprint requests to:
T. T.Lie
National Research Council of Canada Institute for Research in Construction National Fire Laboratory