Jorge J. Ferreiro, Thomas E. Gartmann, Bernhard Schläppi, and
Ruth Signorell*
Can we Observe Gas Phase Nucleation at the
Molecular Level?
DOI 10.1515/zpch-2015-0603
Received March 25, 2015; accepted June 18, 2015
Abstract: We propose and discuss an experiment for the study of neutral gas phase
nucleation on a molecular level using propane as the condensable gas. The ex-periment combines a uniform Laval expansion with soft mass spectrometric de-tection. The uniform Laval expansion allows nucleation experiments under well-defined conditions while the mass spectrometric detection provides molecular-level information on the molecular aggregates formed. It is discussed how one could observe the onset of nucleation and retrieve the size of the critical nucleus from the mass spectra.
Keywords: Critical Nucleus, Laval Nozzle, Mass Spectrometry, Vacuum Ultraviolet
Laser, Propane.
||
Dedicated to Prof. Dr. Dr. h.c. mult. Jürgen Troe on the occasion of his 75thbirthday
1 Introduction
Gas-liquid or gas-solid phase transitions play a pivotal role in atmospheric and technical processes. Examples include aerosol and cloud formation or the for-mation of water droplets in steam turbines, which can affect their performance (see [1–6] and references therein). Despite the importance of gas phase nucleation its quantitative description is still an unsolved issue. Often, experimental and modelling results agree only qualitatively while their quantitative agreement can be very bad (see [1,7] and references therein). In some cases, not even qualitative agreement can be reached. Theoretical models range from Classical Nucleation
*Corresponding author: Ruth Signorell, ETH Zürich, Laboratory of Physical Chemistry, Vladimir-Prelog Weg 2, CH-8093 Zürich, Switzerland, e-mail: [email protected]
Jorge J. Ferreiro, Thomas E. Gartmann, Bernhard Schläppi: ETH Zürich, Laboratory of Physical Chemistry, Vladimir-Prelog Weg 2, CH-8093 Zürich, Switzerland
Figure 1: Gibbs free energyΔ𝐺CNT(𝑛) as a function of the cluster size 𝑛 for three different saturations𝑆 according to predictions from CNT. 𝑛cis the respective critical cluster size. Theory (CNT) to semi-phenomenological models and molecular-level simulations using Monte-Carlo or Molecular Dynamics simulations [1,8–10]. Cloud chambers, shock tubes, and supersonic expansions are among the most widely used exper-imental techniques to study neutral gas phase nucleation [1,7,11–18]. In these experiments, nucleation rates are typically determined from measuring the for-mation rate of particles after nucleation or growth, and CNT is used to extract the critical cluster size from these aerosol particle formation rates. None of these methods directly observe the molecular properties (e. g. detailed sizes, chemical composition) of the ensemble of molecular aggregates (clusters) that are impor-tant for the actual nucleation step. This lack of molecular-level information on the nucleation step motivated the present work on neutral gas phase nucleation.
Gas phase nucleation can occur when an undersaturated (𝑆 < 1) gas is brought to supersaturation (𝑆 > 1). Under the simplest assumptions, the satura-tion ratio𝑆 = 𝑝/𝑝𝑒𝑞is defined as the ratio of the partial pressure of the condens-able gas𝑝and its equilibrium vapour pressure𝑝𝑒𝑞under the given conditions [1]. Figure1illustrates schematically the Gibbs free energy changeΔ𝐺CNT(𝑛)for the formation of a cluster with𝑛monomer units for the three cases𝑆 < 1,𝑆 > 1, and 𝑆 ≫ 1. For𝑆 < 1, no phase transition can occur becauseΔ𝐺CNT(𝑛)monotonically increases with increasing𝑛. For𝑆 > 1and𝑆 ≫ 1, the general idea is that nucle-ation is initiated by the formnucle-ation of a cluster with a critical size𝑛c, which typically lies in the subnanometer to nanometer range. For clusters smaller than𝑛c, growth is kinetically hindered while for clusters larger than𝑛c growth occurs sponta-neously. At the critical cluster size, the Gibbs free energy of formation reaches a maximumΔ𝐺𝑐∗. Figure1also shows that𝑛cdecreases with increasing super-saturation and that the barrier becomes lower and narrower. Because of the finite barrier in the Gibbs free energy nucleation might not be observed on the time scale of a certain experiment even if𝑆 > 1. To describe this behavior, we use the term “subcritical conditions” for experimental conditions for which nucleation is not observed at𝑆 > 1in a certain experiment whereas “supercritical conditions”
re-fer to experimental conditions for which nucleation and growth occur in the same experiment. (Note that there is no connection to the thermodynamic notion of su-percritical.)
In the present study, we propose and discuss an experiment that could en-able us to investigate neutral gas phase nucleation on a molecular level. The ulti-mate goal would be the observation of cluster size (number of monomers), cluster composition (for multi-component systems), and cluster abundance of the cluster ensembles that are formed during the transition from subcritical to supercritical conditions. The experimental setup combines a Laval nozzle for cluster formation with soft mass spectrometeric detection (Section2). We use a pulsed Laval noz-zle and match the background gas after the noznoz-zle to ensure a uniform postnoz-zle flow, i. e. the temperature, the pressure (number density) and the gas velocity (Mach number) are constant in the postnozzle flow [19,20]. The design is similar to that described in refs. [19–22]. Uniform Laval expansions have been success-fully used before for gas kinetic reaction studies because they allow one to investi-gate processes under well-defined conditions (thermal equilibrium and constant pressure) (see refs [19,21–31] and references therein). As aptly described in [23], a uniform postnozzle Laval expansion may be regarded as “a cold flow reactor without walls”. To retrieve molecular-level information on the cluster ensemble, we use mass spectrometric detection. Mass spectra provide information on the number of molecules per cluster, its chemical composition and abundance. Two research groups have previously reported on the combination of Laval nozzles with mass spectrometric detection for gas phase reaction studies and dimeriza-tion studies [21,25,29, 31]. Our system differs from these setups in two impor-tant aspects [20,32]. Firstly, the high ion extraction voltages we use ensure sen-sitive detection of cluster ions over a very wide cluster size range (up to many hundred thousand mass units) in the same mass spectrum. This is crucial for the simultaneous detection of clusters under sub- and supercritical conditions. Sec-ondly, the clusters are ionized close to the lowest ionization threshold by single photons from a tunable Vacuum Ultraviolet (VUV) laser. For many compounds, threshold VUV ionization is a soft ionization method and thus minimizes frag-mentation. This is even the case for weakly-bound molecular aggregates [33–38], which are the subject of the present investigation. Furthermore, the tunability of the VUV laser makes this ionization method broadly applicable to many com-pounds. We would also like to emphasize that we solely focus on nucleation of neutral molecules. Nucleation involving charged species is very different from neutral nucleation and is a subject of its own [3]. Methods that might be appropri-ate for charged or strongly-bound species, such as simple sampling from a static gas reservoir at ambient pressure into a mass spectrometer, cannot be applied to nucleation studies of neutral weakly-bound molecular aggregates. Because of
the weak intermolecular interactions, the latter are very sensitive even to small changes in the conditions (temperature, pressure) so that these conditions must be well-controlled from the formation to the detection.
In the following, we report on our first steps towards the observation of gas phase nucleation at the molecular level. Using propane as a model system, we discuss the possibilities offered by the experimental approach described above to contribute to a better understanding of one of the important unsolved issues in the kinetics of phase transitions.
2 Experiment
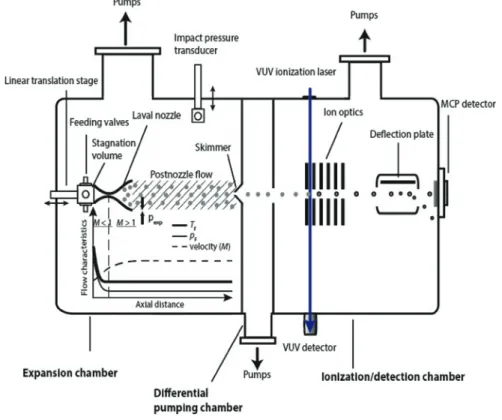
Figure2shows a sketch of our experimental setup, which has been described in detail in reference [20]. Here, we only provide a brief summary. The stagna-tion volume of the Laval nozzle (𝑝0 and𝑇0 are the stagnation pressure and temperature, respectively) is fed by two pulsed solenoid valves, which provide pulses of about6 msnominal duration. Note that the timescale for cluster forma-tion is much shorter; i. e. typically in the microsecond regime [18]. Typically,𝑝0 lies around20–150 mbarand𝑇0corresponds to room temperature. The pulsed solenoid valves are connected to a gas reservoir (not shown) containing a mixture of propane (the condensable gas; Messer,3.5) and argon gas (the carrier gas; Pan-gas,5.0). Mass flow controllers are used to achieve steady and uniform mixing of the two gases. The convergent-divergent shape of the Laval nozzle produces a uni-form flow with constant Mach number𝑀at the nozzle exit. The Laval nozzle has a length of105.0 mmfrom the nozzle entrance to the nozzle exit, a diameter at the throat of8.1 mm, and a diameter at the exit of27.1 mm. The uniform flow at the Laval nozzle exit is extended into the postnozzle region (grey-shaded area in Figure2; typically10–20 cmin length) by matching the pressure in the expansion chamber𝑝expto the flow pressure𝑝𝐹(static pressure in the flow frame). Typically, 𝑝explies in the range between0.1and1 mbar(pumped by a roots blower backed
by a rotary piston pump). The impact pressure𝑝𝐼in the postnozzle flow region is measured by a pressure transducer. By translating the impact pressure mount perpendicular to the flow axis (radial direction) and translating the Laval nozzle mount in flow direction (axial direction) one can map𝑝Iover the entire postnozzle flow region. The Mach number𝑀is determined from𝑝𝐼and from the stagnation pressure𝑝0with the Rayleigh-Pitot formula [19,20,22]:
𝑝𝐼 𝑝0 = { (𝛾 + 1)𝑀2 (𝛾 − 1)𝑀2+ 2} 𝛾 𝛾−1 { 𝛾 + 1 2𝛾𝑀2− 𝛾 + 1} 1 𝛾−1 (1)
Figure 2: Sketch of the experimental setup, which includes the Laval nozzle, the vacuum system, the VUV laser for ionization, and the mass spectrometric detection.
𝛾 =𝐶𝑝
𝐶𝑣is the ratio of the heat capacities at constant pressure and constant volume,
respectively, of the sample gas (gas mixture). Once the Mach number𝑀is known, the flow temperature𝑇𝐹and the flow pressure𝑝𝐹are calculated from
𝑇0 𝑇𝐹 = 1 + 𝛾 − 1 2 𝑀2 (2) 𝑝0 𝑝𝐹 = ( 𝑇0 𝑇𝐹) 𝛾 𝛾−1 (3)
assuming isentropic flow conditions. Finally, the number density𝑛𝐹of the gas in the uniform postnozzle flow is obtained from the ideal gas law. Typically,𝑛𝐹lies between1016to1017molecules/cm3.
Figure2shows a sketch of the profiles of𝑇𝐹,𝑝𝐹, and the gas velocity (Mach number) as a function of the axial distance from the Laval nozzle entrance. (Mea-sured profiles can be found in ref. [20].)𝑇𝐹and𝑝𝐹decrease strongly in the first
part inside the Laval nozzle (𝑀 < 1), become uniform at the nozzle exit, and stay uniform in the whole postnozzle flow region (grey-shaded area).𝑇𝐹,𝑝𝐹, and the gas velocity (𝑀) in the postnozzle region are constant and well-defined. Because of the large number of collisions inside the Laval nozzle thermal equilibrium is established in the postnozzle flow [19,20,22,30]. It is these properties that make the uniform Laval flow so attractive for gas phase chemical kinetics studies (see refs. [21–31] and references therein) and that make it an attractive candidate for the study of gas phase nucleation. In the present work, we slightly increase the saturation𝑆(Figure1) and thus the nucleation rate either by increasing the par-tial pressure𝑝of propane (the condensable gas) at constant𝑇𝐹and𝑝𝐹or by de-creasing𝑇𝐹at constant𝑝and𝑝𝐹(see Section3.1).
The cluster size distribution present in the postnozzle flow at a specific saturation is detected by soft ionization mass spectrometry [20]. For that pur-pose, the central part of the pulsed postnozzle flow is sampled by a skim-mer and passes through the differential pumping chamber before it enters the ionization/detection chamber (Figure2). The molecular aggregates are ionized by single-photon ionization close to the lowest ionization threshold using a home-built, tunable VUV laser at energies between6and18 eV. Single-photon thresh-old ionization is in general a soft ionization method even for the weakly-bound molecular aggregates studied here [33–38]. The ions are mass separated using a Wiley–McLaren type time-of-flight (TOF) configuration, which has been opti-mized for better time-focusing compared with the recently described configura-tion in ref. [20]. Our mass spectrometer allows us to detect cluster size distribu-tions over a very wide size range from the monomer to clusters of hundreds of thousands of mass units, which is a crucial prerequisite for nucleation studies. The detection of heavy aggregates with microchannel plate (MCP) detectors is a major issue, which we compensate by applying high voltages to the ion optics (> 20 kV) [20,32]. Another issue concerns saturation effects in the mass spectra caused by strong monomer signals. To reduce such saturation effects, we installed a deflection plate in front of the detector, which we used to deflect the monomer so that it no longer hits the MCP. For further details on VUV ionization and the mass spectrometer, we refer the reader to ref. [20].
3 Results and discussion
3.1 How to find the onset of nucleation?
The transition from subcritical to supercritical conditions (the onset of nucle-ation) can be observed in Laval expansions if the vapor of the condensable gas
is supersaturated and if nucleation happens on the time-scale of the experi-ment (up to several hundred microseconds). Previous dimerization studies have shown that investigations of aggregation of molecules are feasible with Laval noz-zles [28,29,31]. In this context, the nucleation process can be considered as a poly-merization. Because of the time constraints of the experiment the onset of nucle-ation is expected to be observed only in a narrow temperature and pressure win-dow, which depends on the type of condensable gas. Within this temperature and pressure range, minor changes in the temperature or the partial pressure of the condensable gas should allow one to tune the conditions from subcritical (nucle-ation does not yet occur) to supercritical (nucle(nucle-ation occurs). We have performed two types of experiments using propane as the condensable gas. In the first type of experiment, we systematically change the temperature in the uniform Laval ex-pansion while keeping the partial pressure𝑝of the condensable gas and all other flow parameters constant. This is achieved by slightly modifying the carrier gas composition. For example, up to a few percent of argon carrier gas (major car-rier gas) is replaced by nitrogen gas (minor carcar-rier gas), which results typically in temperature changes of up to a fewK. It is important to note here that minor modifications of the carrier gas composition do not change the collision condi-tions of the propane molecules because most of the collisions still occur with the major carrier gas. However, the temperature can only be varied in a narrow range (a fewK) by this method because more pronounced changes also alter the other flow parameters. We can monitor these changes and the quality of the flow by im-pact pressure measurements as explained in Section2. In the second type of ex-periment, the partial pressure𝑝of the condensable gas is systematically changed while keeping the temperature and all other flow parameters constant. Again, the partial pressure can only be varied in a narrow range (typically by a few percent) without affecting the flow conditions. Both types of experiments provide the same qualitative trends so that we restrict the following discussion to the second type of experiment.
To the best of our knowledge nucleation experiments in Laval nozzles using mass spectrometric detection have not been reported before. It is therefore not clear what kind of changes one expects to observe in the cluster mass spectra when nucleation happens. A major goal of the present work is to discuss this as-pect and to evaluate it by comparison with first experimental data. As mentioned above, the time-scales of the different processes in relation to the time-scale of the experiment determines what is observed in the mass spectra. We begin the discus-sion with “case 1”, for which we assume that the condensable gas is highly super-saturated so that nucleation and subsequent growth occur on the same time-scale as the cooling (thermalization) by collisions with the carrier gas. This means that nucleation and growth are already complete in the region inside the Laval
noz-Figure 3: Mass spectra of propane aggregates recorded under highly supersaturated conditions (“case 1”). The aggregates are generated in an𝑀 = 5.7 Laval nozzle (𝑇𝐹= 26.9 K and
𝑝𝐹= 0.18 mbar). The inset shows that individual mass peaks are resolved.
zle where the temperature and pressure become constant (see Figure2). If growth is complete, one expects to observe a cluster mass distribution with a large aver-age cluster size⟨𝑛⟩and typically a multimodal mass distribution. The multimodal feature has its origin in different competing growth processes, including for exam-ple growth from the gas phase and growth by coagulations. Furthermore, minor changes in𝑝(under otherwise constant conditions) are not expected to affect the cluster size distribution. Figure3confirms these expectations. It shows the mass spectrum for a mixture of10%propane in argon carrier gas that was expanded in a Mach5.7nozzle (𝑇𝐹= 26.9 Kand𝑝𝐹= 0.18 mbar). The spectrum indeed shows the expected multimodal (bimodal indicated by the open circles) distribution. We found the same characteristics in the mass spectra for many other compounds whenever supersaturation was so high that nucleation and growth already took place during the thermalization in the nozzle (see examples in ref. [20]). From these observations we conclude that multimodal distributions are a fairly general feature under such conditions.
More interesting for nucleation studies, however, is “case 2”. It refers to condi-tions for which the time-scales of the nucleation and the experiment are such that the transition from subcritical to supercritical conditions can be induced by minor changes of the partial pressure𝑝(all other flow parameters are constant). Since such measurements have not been reported before we can only speculate on how the cluster mass spectrum is expected to change with changing propane partial pressure𝑝. To keep the discussion simple, we use the center value of the clus-ter size distribution𝑛M= 𝑛min+𝑛max
2 in each spectrum as the indicator for the onset
of the nucleation (𝑛minand𝑛maxare the smallest and the largest cluster sizes de-tected, respectively). Equivalent results are obtained if the average cluster size⟨𝑛⟩ is used instead. Figure4shows schematically how we expect𝑛Mto change with
Figure 4: Sketch of the evolution of the center value of the cluster size distribution𝑛Mas a function of the partial pressure𝑝 of the condensable gas in the region where the onset of nucleation occurs.𝑝maxdenotes the maximum partial pressure up to which all expansion parameters (𝑇𝐹,𝑝𝐹, and𝑀) stay constant.
increasing partial pressure𝑝. We stress again that the overall change in𝑝must be small in order not to affect any of the other flow parameters. For low𝑝in Figure4, we assume that nucleation does not yet take place on the time-scale of the exper-iment. If we further assume that thermalization has been achieved and that all processes (cluster formation) except nucleation have reached local equilibrium one would expect to observe a cluster distribution that corresponds to the ther-mal cluster distribution at this partial pressure and this temperature. Under these conditions of metastable equilibrium, all significantly populated cluster sizes and 𝑛Mlie below the size of the critical nucleus𝑛c. As long as nucleation does not yet
occur on the time-scale of the experiment, an increase in𝑝would only lead to a moderate increase in𝑛M. This behavior is indicated in Figure4by the first curve with a flat slope in the subcritical region. As soon as𝑝is high enough, nucle-ation can occur. This should lead to a more or less sudden increase in𝑛M, which is the point where supercritical conditions are reached indicated in Figure4as the “onset of nucleation”. A further increase in𝑝should result in a much more pronounced increase in𝑛Mthan under subcritical conditions because under su-percritical conditions clusters can grow unhindered. This behavior is indicated in Figure4by the steeper slope of the second curve above the onset of nucleation. Why does the onset of nucleation not correspond to an abrupt step in Figure4and why is the growth region under supercritical conditions not drawn with a much steeper slope? Whether nucleation leads to a smoother or a more abrupt change in𝑛Mdepends on the exact time-scales of the various processes involved. These time-scales also determine the shape and steepness of the two curves in Figure4. Depending on the type of system, the degree of saturation, and other competing processes, such as diffusion, one might observe curves with different slopes and shapes than the example curves in Figure4. Still, as a general qualitative
fea-ture we expect to find two different curves with increasing propane concentration, which intersect at the onset of nucleation. And we expect the first curve to be less steep than the second one. The sketch in Figure4ends at a maximum pressure 𝑝maxindicating the maximum partial pressure at which all other flow parameters are still constant. Above this pressure, we assume that the flow conditions are no longer constant because the propane concentration becomes too high. This can cause the flow temperature to increase or the flow to become non-uniform.
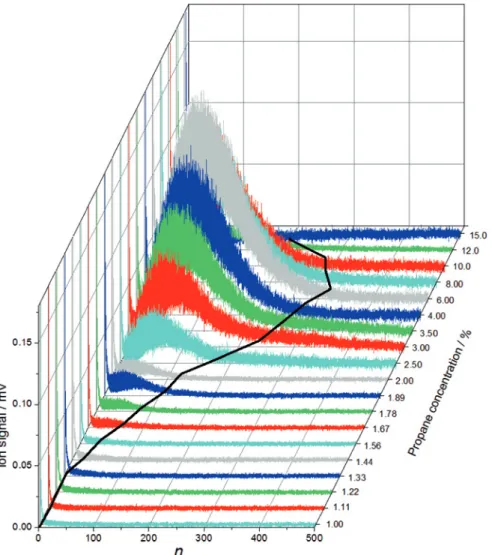
How do the above expectations compare with experimental results? Figure5 shows a series of mass spectra recorded for different propane partial pressures (propane concentration) but otherwise identical conditions. Note that for these spectra we reduced the ion signal and the detection sensitivity so that we could record the monomer and the clusters in the same mass spectrum avoiding pro-nounced saturation effects due to the monomer (see Section2). As mentioned below, we also have recorded spectra at a sensitivity of about a factor of 30 higher than in Figure5(data not shown), which, however, required deflecting the monomer to reduce saturation effects. Below a propane concentration of1.22% only clusters up to about the trimer are visible in the spectra in Figure5. The first clusters with𝑛M∼ 4and𝑛maxup to∼ 8are detected in the1.22%and1.33% spec-tra. At higher concentrations,𝑛M,𝑛max(line in Figure5), and the clusters abun-dance increase pronouncedly up to about a concentration of∼ 6%. Above this concentration,𝑛M,𝑛max, and the abundance of clusters decrease again. Figure6 shows the corresponding evolution of𝑛Mwith increasing propane concentration. A comparison with Figure4suggests that the onset of nucleation happens around a propane concentration of∼ 1.4%. The ion signals shown in Figure5for these lower concentrations are rather low so that the onset at∼ 1.4%might be an arti-fact produced by the finite detection sensitivity of the ions. To check this, we have also recorded mass spectra at much higher ion sensitivity (see above), which in-deed confirm the presence of clusters at∼ 1.5%and the absence of cluster below ∼ 1%. The observed onset is apparently not an artifact due to finite detection sen-sitivity. We have also measured the flow temperature𝑇𝐹to ensure that the tem-perature is stable in the region where the onset occurs (𝑇𝐹 = 48 ± 0.7 K) and that the flow conditions are constant up to a propane concentration of∼ 2%. Unstable flow conditions can also be excluded as a reason for the increase in𝑛Mat a con-centration of∼ 1.4%. While we cannot provide a final proof at this point that the sudden increase in𝑛M at a concentration of∼ 1.4%corresponds to the onset of nucleation, our current observations are at least consistent with this explanation. The second pronounced change in Figure6is the decrease in𝑛Mabove a con-centration of ∼ 6%(see inset). Flow temperature measurements reveal that at these higher concentrations𝑇𝐹has increased by a few degrees to about51 K. This indicates that concentrations above∼ 6%correspond to values of𝑝that lie
be-Figure 5: Mass spectra of propane aggregates recorded as a function of propane concentration in the region where the onset of nucleation occurs (“case 2”). The mass peak at the lowest mass is the monomer peak. The line indicates the evolution of𝑛maxwith increasing propane concentration. The aggregates are generated in an𝑀 = 4.0 Laval nozzle. 𝑇𝐹= 48 ± 0.7 K and 𝑝𝐹= 0.34 ± 0.01 mbar are constant below a concentration of 2%. At higher concentrations, 𝑇f
and𝑝fare no longer constant (see text).
yond𝑝maxin Figure4; i. e. one reaches conditions under which the temperature and flow conditions are no longer constant. The observation that the clusters be-come smaller and finally disappear above∼ 6%(Figs.5and6) is consistent with
Figure 6: Experimentally measured evolution of𝑛Mas a function of the concentration (partial
pressure𝑝) of propane (condensable) gas in the region where the onset of nucleation occurs. The lines are to guide the eye. The data are extracted from the spectra in Figure5.
what one would expect to happen when the temperature starts to increase and/or the uniformity of the flow starts to deteriorate.
3.2 How to get to the critical nucleus?
Even if the onset of nucleation is identified, it is not obvious how to extract the size of the critical nucleus𝑛cfrom the mass spectra. We suggest and discuss here two possible approaches. The first suggestion is to look simply at the maximum cluster size𝑛maxin the region where the onset of nucleation happens. Under sub-critical conditions,𝑛maxmust be smaller than𝑛cwhile under supercritical condi-tions𝑛maxis larger than𝑛c. This allows one to determine a size range for𝑛cfrom two spectra recorded under subcritical and supercritical conditions, which both should lie close to where the onset is observed. If we assume that the onset of nucleation for the propane measurements in Figure5is at∼ 1.4%, we can extract a size range for𝑛cfrom the values of𝑛maxof the spectra recorded just below1.4% (subcritical) and just above1.4%(supercritical), respectively. From these spec-tra, one would predict𝑛cto lie somewhere between∼ 8and∼ 33 molecules. If we simply take the average in this region we predict an𝑛cof∼ 21 molecules. This ap-proach has its disadvantages. An obvious disadvantage is the fact that one does not know how far away the𝑛maxlie from𝑛cso that the range can be broad. Maybe less obvious are the limitations that arise from the detection sensitivity. The
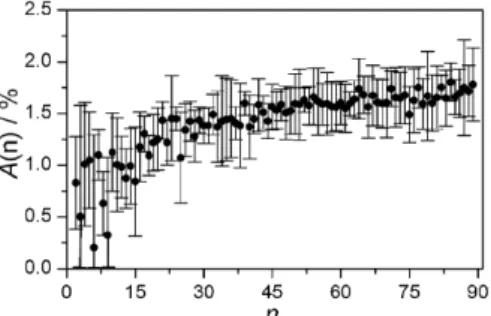
abun-Figure 7: The appearance concentration𝐴 as a function of the cluster size 𝑛 extracted from the data in Figure5.𝐴(𝑛) is the propane concentration at which the cluster with size 𝑛 appears for the first time. The critical cluster size is estimated to be around𝑛c∼ 20 molecules (see text). dance of clusters with high masses is typically low as visible in the size distribu-tions in Figure5so that one might underestimate the true size of𝑛max.
In the second approach, we first analyse the concentration dependence of the ion signal of each cluster size𝑛individually and determine for each cluster size 𝑛its “appearance concentration”𝐴. The latter is the propane concentration at which the cluster with size𝑛appears for the first time. For cluster sizes below the critical size𝑛 < 𝑛c,𝐴should increase with increasing𝑛. As soon as the critical cluster size is reached, a range of cluster sizes with𝑛 ≥ 𝑛cshould appear at about the same propane concentration because of the unhindered cluster growth above 𝑛c. All these clusters should thus have about the same𝐴. The critical cluster size𝑛c
can then be determined from𝐴(𝑛)as the smallest cluster size at which𝐴(𝑛)starts to plateau. Figure7shows the appearance concentration𝐴as a function of the cluster size𝑛for the spectra in Figure5. Up to a cluster size of about20 molecules, 𝐴increases with increasing𝑛and seems to plateau beyond this size. From this type of analysis, one would predict a critical size𝑛cof∼ 20 molecules. For the data shown in Figure7, the trends in𝐴still lie within the experimental error. To eval-uate the usefulness of this second approach to determine𝑛cwe would need more accurate measurements. Some confidence can be drawn from the agreement of the values for𝑛cobtained with the two different independent approaches (𝑛c∼ 21 for the first and𝑛c∼ 20for the second). We have also used CNT to predict the size of the critical nucleus for the conditions in Figure5. Using extrapolations for the bulk vapor pressure and the surface tension for propane [1,39,40], CNT predicts a value of𝑛c∼ 5 molecules, which lies below the values we predict from our anal-ysis. We would like to emphasize here that CNT is known to provide quantitatively incorrect results for many compounds as already mentioned in Section1. We are not aware of any study that provides a comparison between experiment and CNT for propane so that we do not know how CNT performs for propane.
4 Conclusions
Can we observe gas phase nucleation at the molecular level? The present study suggests the combination of uniform Laval expansions and soft mass spectromet-ric detection as a promising experimental step towards this goal. We still need to evaluate the broader applicability of this approach to nucleation studies, which will require many further systematic investigations. For the example of propane, we have discussed how the onset of nucleation and the size of the critical cluster can be extracted from experimental mass spectra. In contrast to other nucleation studies, the mass spectrometric detection allows for the direct observation of the sizes and the chemical composition of the clusters that are involved in the nucle-ation step. The chemical composition is a determining factor in multi-component nucleation – an aspect that has not yet been investigated experimentally at the molecular level. Such molecular snapshots recorded during nucleation events should contribute to a better understanding of the origin of the large discrepan-cies that exist between experiment and theory. In this context one has to keep in mind that the actual molecular nucleation processes can be complicated and that various processes (diffusion, nucleation, growth) can compete with each other. It is thus not a priori clear whether simple concepts, such as the notion of a critical cluster size, provide an appropriate description.
Acknowledgement: We are very grateful to David Stapfer and Markus Steger from
the LPC shops for their assistance in developing the experimental setup. Financial support was provided by the ETH Zürich and the Swiss National Science Founda-tion (SNF projects no. 200021_146368 and 200020_159205).
References
1. V. I. Kalikmanov,Nucleation Theory, Springer Netherlands, Heidelberg (2013). 2. R. Zhang, Science328 (2010) 1366.
3. S. Schobesberger, A. Franchin, F. Bianchi, L. Rondo, J. Duplissy, A. Kürten, I. K. Ortega, A. Metzger, R. Schnitzhofer, J. Almeida, A. Amorim, J. Dommen, E. M. Dunne, M. Ehn, S. Gagné, L. Ickes, H. Junninen, A. Hansel, V.-M. Kerminen, J. Kirkby, A. Kupc, A. Laakso-nen, K. Lehtipalo, S. Mathot, A. Onnela, T. Petäjä, F. Riccobono, F. D. Santos, M. Sipilä, A. Tomé, G. Tsagkogeorgas, Y. Viisanen, P. E. Wagner, D. Wimmer, J. Curtius, N. M. Don-ahue, U. Baltensperger, M. Kulmala, and D. R. Worsnop, Atmos. Chem. Phys.15 (2015) 55. 4. F. Bianchi, A. P. Praplan, N. Sarnela, J. Dommen, A. Kürten, I. K. Ortega, S. Schobesberger, H. Junninen, M. Simon, J. Tröstl, T. Jokinen, M. Sipilä, A. Adamov, A. Amorim, J. Almeida, M. Breitenlechner, J. Duplissy, S. Ehrhart, R. C. Flagan, A. Franchin, J. Hakala, A. Hansel,
M. Heinritzi, J. Kangasluoma, H. Keskinen, J. Kim, J. Kirkby, A. Laaksonen, M. J. Lawler, K. Lehtipalo, M. Leiminger, V. Makhmutov, S. Mathot, A. Onnela, T. Petäjä, F. Riccobono, M. P. Rissanen, L. Rondo, A. Tomé, A. Virtanen, Y. Viisanen, C. Williamson, D. Wimmer, P. M. Winkler, P. Ye, J. Curtius, M. Kulmala, D. R. Worsnop, N. M. Donahue, and U. Baltensperger, Environ. Sci. Technol.48 (2014) 13675.
5. J. Jiang, J. Zhao, M. Chen, F. L. Eisele, J. Scheckman, B. J. Williams, C. Kuang, and P. H. McMurry, Aerosol Sci. Technol.45 (2011) ii.
6. M. Ebrahimi and M. H. Roozbahani, Int. J. Adv. Des. Manuf. Tech.3 (2010) 25. 7. L. M. Feldmar, J. Wölk, and R. Strey, AIP Conf. Proc.1527 (2013) 15.
8. R. Becker and W. Döring, Ann. Physik24 (1935) 719.
9. M. Horsch, J. Vrabec, M. Bernreuther, S. Grottel, G. Reina, A. Wix, K. Schaber, and H. Hasse, J. Chem. Phys.128 (2008) 164510.
10. L. Inci and R. K. Bowles, J. Chem. Phys.139 (2013) 214703.
11. B. J. C. Wu, P. P. Wegener, and G. D. Stein, J. Chem. Phys.69 (1978) 1776. 12. J. Wölk and R. Strey, J. Phys. Chem. B105 (2001) 11683.
13. S. Sinha, H. Laksmono, and B. E. Wyslouzil, Rev. Sci. Instrum.79 (2008) 114101. 14. D. Brus, A.-P. Hyvärinen, V. Ždímal, and H. Lihavainen, J. Chem. Phys.122 (2005) 214506. 15. K. Iland, J. Wölk, R. Strey, and D. Kashchiev, J. Chem. Phys.127 (2007) 154506.
16. D. Bergmann, D. Ghosh, R. Strey, J. Wölk, S. Tanimura, and B. E. Wyslouzil:Homogeneous
Nucleation of a Homologous Series of n-Alkanes in a Supersonic Nozzle, Springer
Nether-lands, (2007), p. 255.
17. S. Sinha, A. Bhabhe, H. Laksmono, J. Wölk, R. Strey, and B. Wyslouzil, J. Chem. Phys.132 (2010) 064304.
18. H. Laksmono, S. Tanimura, H. C. Allen, G. Wilemski, M. S. Zahniser, J. H. Shorter, D. D. Nelson, J. B. McManus, and B. E. Wyslouzil, Phys. Chem. Chem. Phys.13 (2011) 5855. 19. D. B. Atkinson, and M. A. Smith, Rev. Sci. Instrum.66 (1995) 4434.
20. B. Schläppi, J. H. Litman, J. J. Ferreiro, D. Stapfer, and R. Signorell, Phys. Chem. Chem. Phys. (2015) DOI:10.1039/C5CP00061K.
21. S. Lee, R. J. Hoobler, and S. R. Leone, Rev. Sci. Instrum.71 (2000) 1816.
22. T. Spangenberg, S. Köhler, B. Hansmann, U. Wachsmuth, B. Abel, and M. A. Smith, J. Phys. Chem. A108 (2004) 7527.
23. B. Hansmann and B. Abel, ChemPhysChem8 (2007) 343. 24. I. W. M. Smith, Angew. Chem.118 (2006) 2908.
25. B. R. Rowe and J. B. Marquette, Int. J. Mass Spectrom.80 (1987) 239.
26. D. Chastaing, P. L. James, I. R. Sims, and I. W. M. Smith, Faraday Discuss.109 (1998) 165. 27. E. Vöhringer-Martinez, B. Hansmann, H. Hernandez, J. S. Francisco, J. Troe, and B. Abel,
Science315 (2007) 497.
28. S. Hamon, S. D. Le Picard, A. Canosa, B. R. Rowe, and I. W. M. Smith, J. Chem. Phys.112 (2000) 4506.
29. L. Biennier, H. Sabbah, V. Chandrasekaran, S. J. Klippenstein, I. R. Sims, and B. R. Rowe, Astron. Astrophys.532 (2011) A40.
30. I. R. Sims, Nature Chem.5 (2013) 734.
31. H. Sabbah, L. Biennier, S. J. Klippenstein, I. R. Sims, and B. R. Rowe, J. Phys. Chem. Lett.1 (2010) 2962.
32. B. Schläppi, J. J. Ferreiro, J. H. Litman, and R. Signorell, Int. J. Mass Spectrom.372 (2014) 13.
34. S. Schütte and U. Buck, Int. J. Mass Spectrom.220 (2002) 183.
35. J. H. Litman, B. L. Yoder, B. Schläppi, and R. Signorell, Phys. Chem. Chem. Phys.15 (2013) 940.
36. J. Lengyel, A. Pysanenko, V. Poterya, J. Kočišek, and M. Fárník, Chem. Phys. Lett.612 (2014) 256.
37. B. L. Yoder, J. H. Litman, P. W. Forysinski, J. L. Corbett, and R. Signorell, J. Phys. Chem. Lett. 2 (2011) 2623.
38. F. Dong, S. Heinbuch, J. J. Rocca, and E. R. Bernstein, J. Chem. Phys.124 (2006) 224319. 39. H. Lin and Y.-Y. Duan, J. Chem. Eng. Data48 (2003) 1360.