S1
Supporting Information
Compartmentalization of Alkaline Earth Metals in Salen-type
Cu- and Ni-Complexes in Solution and in the Solid State
Alba Finelli †, Nelly Hérault †, Aurélien Crochet ‡, Katharina M. Fromm*,†
† Department of Chemistry, University of Fribourg, Ch. du Musée 9, 1700 Fribourg, Switzerland ‡ FriMat,Department of Chemistry, University of Fribourg, Ch. du Musée 9, 1700 Fribourg,
Swit-zerland.
Table of Contents
General ... 1
NMR Titration of metallohost LNi ... 2
UV-Vis Titration of the metallohost LCu ... 7
Powder X-Ray ... 11
Crystallography ... 17
General
All experiments were performed in air and at RT. Ligand H2L was prepared according to the
pro-cedure reported by Avecilla et al. previously. All chemicals were commercial products of reagent grade and were used without further purification. 1H and 13C measurements were carried out for
the Ni-compounds with a Bruker 400 MHz spectrometer at ambient temperature, and chemical shifts are given in ppm with respect to the residual solvent peak. Mass spectra (ESI-TOF, positive mode) were recorded with a Bruker esquire HCT spectrometer with a DMF/ACN mixture as sol-vent. The UV/Vis spectra were recorded with a Perkin-Elmer Lambda 40 spectrometer. The crys-tallographic data of single crystals were collected with Mo-Kα radiation (λ = 0.71073 Å).
Powder
X-ray spectra were collected on a Nonius Enraf FR 590 X-ray generator with mounted Stoe StadiP
using Cu Kalpha1 radiation (1.5406 A˚).
S2
All measurements were performed at 200 K, or 250 K for the compounds 5 and 8, with Stoe IPDS-II or IPDS-IPDS-II T diffractometers equipped with Oxford Cryosystem open-flow cryostats. Single crys-tals were picked under the microscope, and placed in inert oil. All cryscrys-tals were mounted on loops and all geometric and intensity data were taken from one single crystal. The absorption correc-tions were partially integrated in the data reduction procedure. The structures were solved and refined using full-matrix least-squares on F2 with the SHELX-2014 package. All atoms (except
hydrogen atoms) were refined anisotropically. Hydrogen atoms were refined where possible, and otherwise added using the riding model position parameters.
NMR Titration of metallohost LNi
Figure S1: 1H NMR spectrum of LNi (400 MHz, DMSO-d
S3
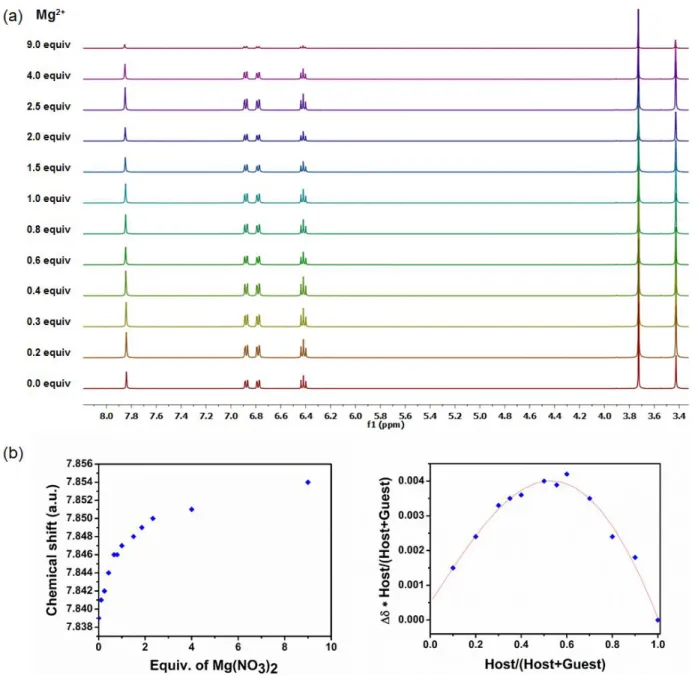
Figure S2: a)1H NMR spectral changes of the metallohost LNi (400 MHz, DMSO-d
6, 0.04 M) upon
the addition of Mg(NO3)2 in deuterated DMSO b) the corresponding isotherm curve and the Job
S4
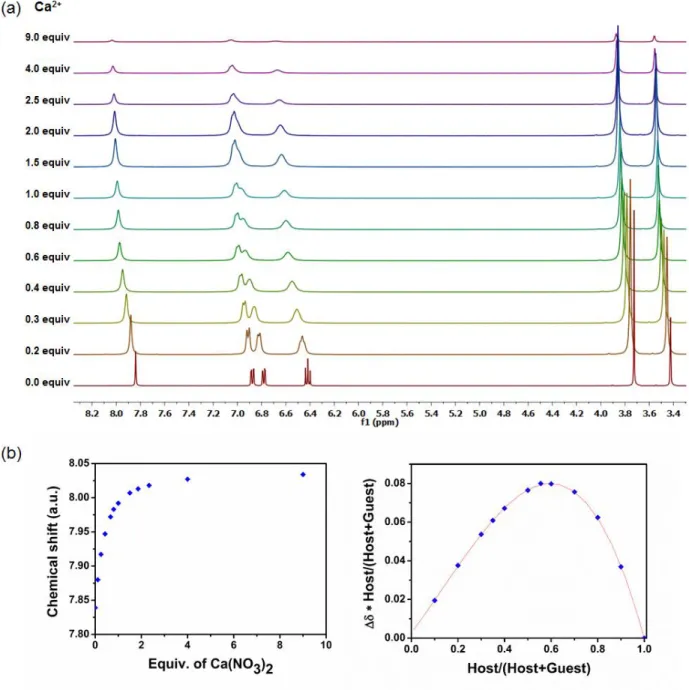
Figure S3: a)1H NMR spectral changes of the metallohost LNi (400 MHz, DMSO-d
6, 0.04 M) upon
the addition of Ca(NO3)2 in deuterated DMSO b) the corresponding isotherm curve and the Job
S5
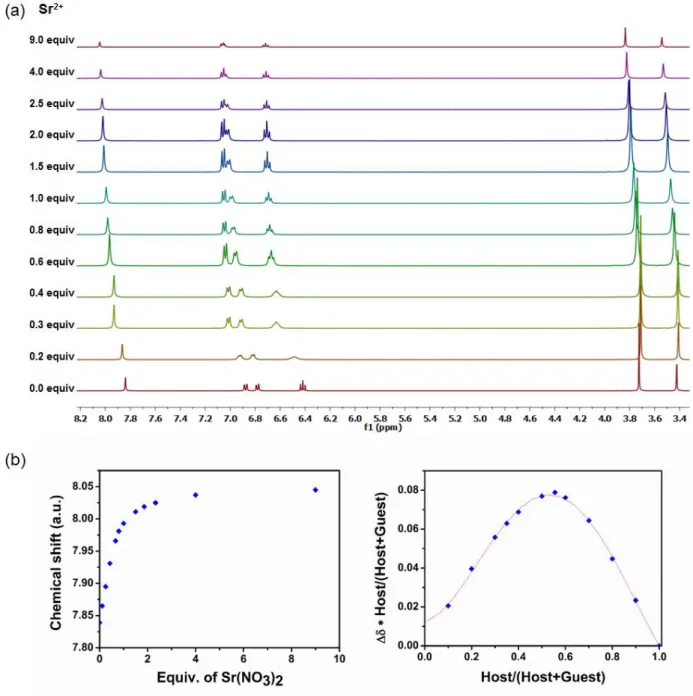
Figure S4:a)1H NMR spectral changes of the metallohost LNi (400 MHz, DMSO-d
6, 0.04 M) upon
the addition of Sr(NO3)2 in deuterated DMSO b) the corresponding isotherm curve and the Job
S6
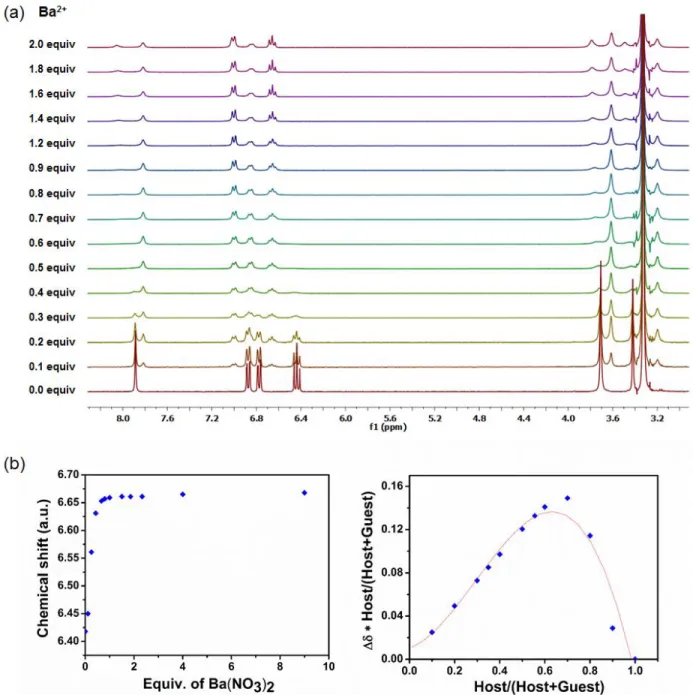
Figure S5: a)1H NMR spectral changes of the metallohost LNi (400 MHz, DMSO-d
6, 0.04 M) upon
the addition of Ba(NO3)2 in deuterated DMSO b) the corresponding isotherm curve and the Job
S7
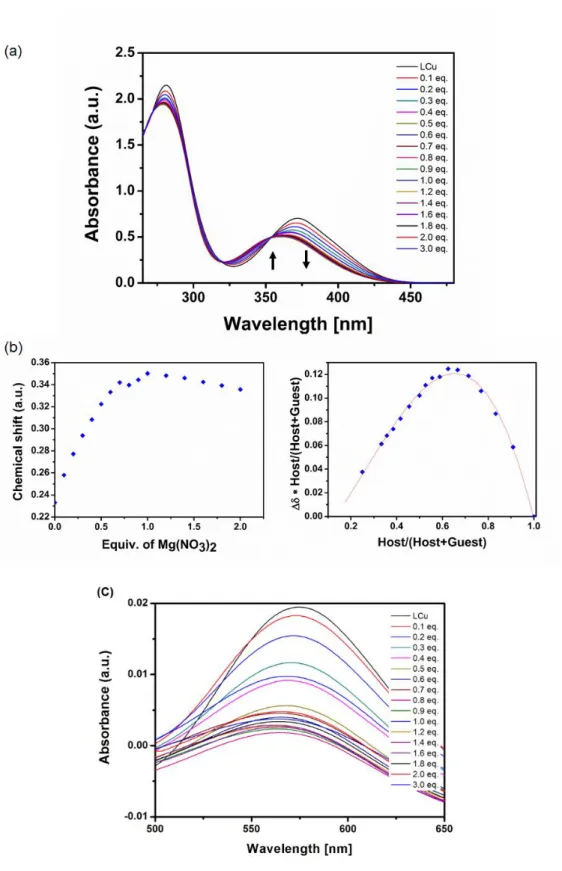
UV-Vis Titration of the metallohost LCuFigure S6: a) UV-Vis spectral changes of the metallohost LCu (0.1 mM) in ACN upon the addition of a solution of Mg(NO3)2 in DMSO, b) the corresponding isotherm curve and the Job plot, c) zoom
S8
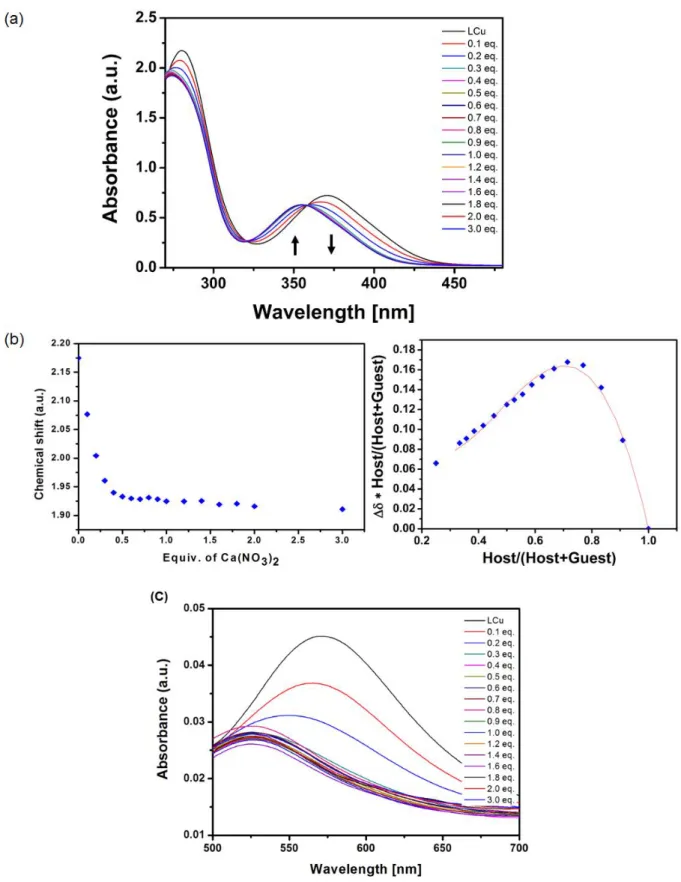
Figure S7: a) UV-Vis spectral changes of the metallohost LCu (0.1 mM) in ACN upon the addition of a solution of Ca(NO3)2 in DMSO, b) the corresponding isotherm curve and the Job plot, c) zoom
S9
Figure S8: a) UV-Vis spectral changes of the metallohost LCu (0.1 mM) in ACN upon the addition of a solution of Sr(NO3)2 in DMSO, b) the corresponding isotherm curve and the Job plot, c) zoom
S10
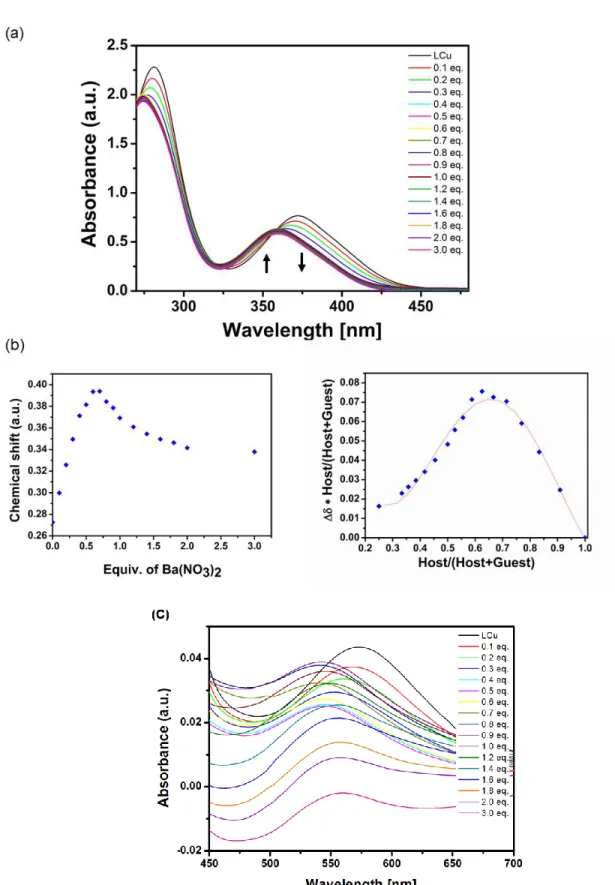
Figure S9: a) UV-Vis spectral changes of the metallohost LCu (0.1 mM) in ACN upon the addition of a solution of Ba(NO3)2 in DMSO, b) the corresponding isotherm curve and the Job plot, c) zoom
S11
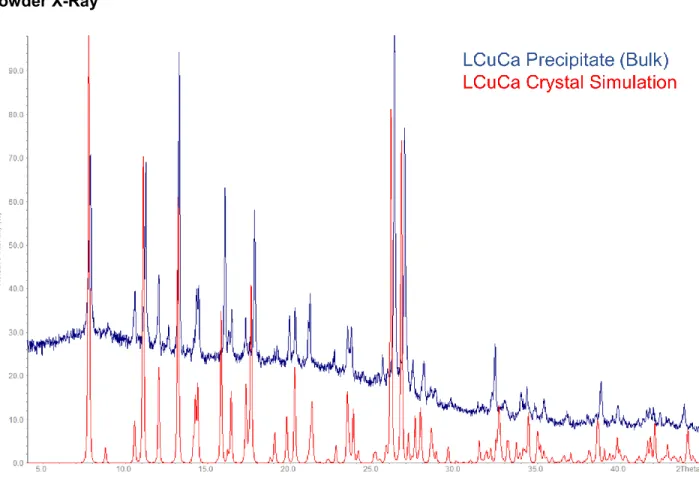
Powder X-RayFigure S10: XPRD diffractogram of the LCuCa (2) precipitate compared with the crystal structure simulation 2.
S12
Figure S11: XPRD diffractogram of the LCuSr (3) precipitate compared with the crystal structure simulation 3.
S13
Figure S12: XPRD diffractogram of the LCuBa (4) precipitate compared with the crystal structure simulation 4.
S14
Figure S13: XPRD diffractogram of the LNiMg (5) precipitate compared with the crystal structure simulation 5.
S15
Figure S14: XPRD diffractogram of the LNiCa (6) precipitate compared with the crystal structure simulation 6.
S16
Figure S15: XPRD diffractogram of the LNiSr (7) precipitate compared with the crystal structure simulation 7.
S17
CrystallographyFigure S16: Crystal structure of LCuMg complex 1 (above, #2 (-x, 1-y, 1-z), #2(1-x, 1-y, 1-z), #3(1+x, y, z)), shows a π‒π-system packing (orange dash bonds) and Cu(II)‒C14 interaction (green dash bonds). H-atoms except for water are omitted for clarity.
S18
Figure S17 : Crystal structure of LCuCa complex 2 (#2 (1/2 -x, ½+y, z), #3 ( 1/2 -x, -½+y, ½-z)), reveals a 1D coordination polymer expansion of the calcium ion via the neighbor O-atom O7 of a nitrate bridging ligand and Cu(II)‒O6 weak bond (green dash bonds). H-atoms except for water are omitted for clarity.
S19
Figure S18: Crystal structure of LCuSr complex 3 (#2(x, -1+y, z), #3( ½-x,- ½-y, ½+z), #4( ½ -x, ½+y, ½+z),#4( ( ½ -x, ½+y, -½+z)) presenting similar characteristics as compounds LNiCa (6) and LNiSr (7). Above, Cu(II)‒C14 interaction (green dash bonds) and π‒π-system packing interac-tions between two parallel neighbor unities (orange dash bonds). Below, presence of H-bonds creating different layers showed from the top and from the profile (blue dash bonds). All H-atoms except for water, are omitted for clarity.
S20
Figure S19: Crystal structure of LNiMg complex 5 presenting similar characteristics as com-pounds LNiCa (6) and LNiSr (7). They show Ni(II)‒C4 interactions (green dash bonds) and π‒π system packing interactions between two parallel neighbor unities (orange dash bonds). Below, presence of H-bonds creating different layers showed from the top, creating channels along a-axis occupied by two nitrate ions (blue dash bonds). All H-atoms except for water, are omitted for clarity.
S21
Table S1: Bonds lengths in [Å] and angles of all crystal structures obtained.Length [Å] LCuMg (1) LCuCa (2) LCuSr (3) LCuBa (4) LNiMg (5) LNiCa (6) LNiSr (7) LNiBa (8)
O2 ̶ M1 1.877(5) 1.884(3) 1.890(7) 1.904(5) 1.832(4) 1.845(2) 1.857(3) 1.800(2) O6 ̶ M1 1.898(4) 1.860(2) O3 ̶ M1 1.873(6) 1.902(2) 1.893(5) 1.898(4) 1.827(3) 1.847(2) 1.859(3) 1.860(2) O7 ̶ M1 1.896(5) 1.850(2) N1 ̶ M1 1.911(7) 1.931(4) 1.910(9) 1.911(6) 1.830(4) 1.843(3) 1.844(4) 1.880(2) N3 ̶ M1 1.937(6) 1.820(2) N2 ̶ M1 1.907(6) 1.918(4) 1.918(8) 1.931(6) 1.822(5) 1.840(2) 1.841(4) 1.870(3) N4 ̶ M1 1.918(7) 1.810(2) O1 ̶ M2 2.449(5) 2.566(3) 2.691(6) 2.952(4) 2.463(4) 2.562(2) 2.634(3) 2.990(2) O5 ̶ M2 3.074(5) 2.990(2) O2 ̶ M2 2.065(7) 2.378(3) 2.531(7) 2.792(5) 2.065(4) 2.369(2) 2.549(3) 2.800(2) O6 ̶ M2 2.830(5) 2.840(2) O3 ̶ M2 2.060(6) 2.372(3) 2.538(5) 2.781(5) 2.069(4) 2.360(2) 2.542(3) 2.810(2) O7 ̶ M2 2.799(5) 2.910(2) O4 ̶ M2 2.509(6) 2.614(3) 2.675(6) 3.068(4) 2.446(4) 2.556(2) 2.639(3) 2.930(2) O8 ̶ M2 2.951(4) 2.990(2) O5 ̶ M2 2.137(8) 2.437(4) 2.635(9) 2.166(5) 2.691(3) O6 ̶ M2 2.169(7) 2.681(4) 2.682(9) 2.723(4) O7 ̶ M2 2.462(2) O8 ̶ M2 2.002(7) 2.532(3) 1.987(4) 2.401(2) 2.672(4) O9 ̶ M2 2.720(1) 2.965(4) 2.690(2) O10 ̶ M2 2.455(4) 2.941(7) 2.653(3) O11 ̶ M2 2.570(7) 2.377(2) 2.578(4) O12 ̶ M2 3.059(7) 2.900(3) O13 ̶ M2 2.893(8) 2.930(3) M1 ̶ M2 3.350(1) 3.567(1) 3.738(9) 3.764(1) 3.088(2) 3.393(7) 3.590(6) 3.751(4) 3.796(4)