REGULAR ARTICLE
Investigation of small-scale processes in the rhizosphere
of
Lupinus albus using micro push-pull tests
K. Knecht&B. Nowack&M. H. Schroth& M. J.-F. Suter&R. Schulin
Received: 20 June 2013 / Accepted: 9 January 2014 / Published online: 31 January 2014 # Springer International Publishing Switzerland 2014
Abstract
Background and Aims Rhizosphere processes affect the mobility, phytoavailability and toxicity of solutes in soil. To study reactions in the rhizosphere under quasi in situ conditions, we recently developed the“micro push-pull test” (μPPT) method, combining micro-suction cups with the principle of the“push-pull test” method known from groundwater applications. Here we report the
application ofμPPT to investigate rhizosphere reactions in situ, i.e. degradation of deuterated citrate (citrate-d4) in the rhizosphere of Lupinus albus grown in sand-filled rhizoboxes.
Methods In a μPPT, a solution containing reactive (citrate-d4) and non-reactive solutes (bromide) is injected into a porous medium and shortly thereafter, the pore water solution is re-extracted from the same location. Concentration (“breakthrough”) curves of ex-tracted reactants can be compared to those of the non-reactive solute, allowing the determination of reaction rates. We applied theμPPT in rhizoboxes with Lupinus albus and sampled different types of micro-habitats: bulk soil, rhizosphere of normal roots and rhizosphere of cluster roots of different ages.
Results Breakthrough curves of citrate-d4 varied con-siderably between tests adjacent to cluster roots and normal roots, and in bulk soil. Degradation of citrate-d4 in bulk soil and adjacent to normal roots was below detection, while we found strong degradation of citrate-d4 adjacent to 4 to 5-days old cluster roots. In situ degradation rate constants for citrate-d4 around cluster roots were found to be in the range from 0.38 to 0.71 h−1.
Conclusions We successfully applied the μPPT to the rhizosphere. The μPPT is useful to investigate local processes in microcosms and to monitor processes also over time (e.g., during cluster-root development) due to its non-destructive nature.
Keywords Citrate . Microbial degradation . Micro push-pull test . Modeling . Rhizosphere . Suction cup
Responsible Editor: Timothy George. K. Knecht
:
B. Nowack:
R. SchulinInstitute of Terrestrial Ecosystems, ETH Zurich, 8092 Zurich, Switzerland K. Knecht e-mail: [email protected] R. Schulin e-mail: [email protected] B. Nowack (*)
Swiss Federal Laboratories for Materials Science and Technology (EMPA),
Lerchenfeldstrasse 5, 9014 St. Gallen, Switzerland e-mail: [email protected]
M. H. Schroth
Institute of Biogeochemistry and Pollutant Dynamics, ETH Zurich,
Zurich, Switzerland e-mail: [email protected] M. J.<F. Suter
Eawag: Swiss Federal Institute of Aquatic Science and Technology,
Dübendorf, Switzerland e-mail: [email protected]
Introduction
The rhizosphere, the zone of soil under direct influence of active plant roots, differs in many aspects from bulk soil. For example, root growth and water uptake by plants directly alter physical properties of the rhizo-sphere. Therefore, flow and transport processes can vary in the rhizosphere and strongly differ from those in bulk soil. Furthermore, root activities such as nutrient absorp-tion, respiraabsorp-tion, and exudation strongly influence chem-ical properties of the rhizosphere (e.g. concentration of nutrients, of toxic elements, of complexing compounds, pH, pO2and pCO2). Moreover, root exudation stimulates
microbial activity, resulting in strong gradients in chem-ical potentials and solute concentrations (e.g. Hinsinger et al.2009; Vetterlein and Jahn2004). Thus, the rhizo-sphere is a unique micro-habitat and most of all a zone of particularly intense turnover and transformation process-es. To understand the ecological role and functioning of the rhizosphere, it is highly important to understand rhizosphere processes and the factors governing them.
Much progress has been made during the past de-cades in assessing the spatial variability in soils and especially in the rhizosphere (Gregory and Hinsinger 1999; Luster et al. 2009). In the 1990s, small-scale soil-solution investigations started with the miniaturiza-tion of sampling probes, which enabled non-destructive in situ observation of soil-solution chemistry (Göttlein et al.1996; Vetterlein et al.1993). Later, micro-suction cups were used successfully in conjunction with rhizoboxes that allow observation of root-system devel-opment through a transparent front plate and thus per-mitted the targeted sampling of soil solution adjacent to
roots (Dessureault-Rompré et al. 2006, 2007;
Dieffenbach et al. 1997; Göttlein et al. 1999;
Puschenreiter et al. 2005; Schreiber et al. 2011). This allowed the determination of solute concentrations in the rhizosphere at high spatial and temporal resolution and provided information about small-scale heterogene-ities with respect to solute concentrations. Nevertheless, the underlying processes are often not yet adequately understood: So far, micro-scale processes were mostly studied under rather artificial conditions (e.g., pot and column experiments, hydroponics) (Luster et al.2009) and little is known about the mobility and degradation of solutes (e.g. exudates) under real rhizosphere condi-tions. New non-destructive methods to investigate rhi-zosphere processes in situ are therefore needed. One example is the use of optodes for non-destructive
analysis of pH and oxygen in the rhizosphere (Blossfeld et al.2011).
On a larger scale, single-well injection-withdrawal tests, called push-pull tests, have been used extensively for the investigation of chemical, physical and biologi-cal phenomena in aquifers (Drever and McKee 1980; Istok et al.1997). In a push-pull test, a solution contain-ing non-reactive and reactive tracers is injected (pushed) into an aquifer. The test-solution/groundwater mixture is then extracted (pulled) from the same location. The concentration (“breakthrough”) curves of the extracted reactants are compared to those of the tracers, which allows to determine the rates at which the reactants are eliminated from the solution.
The idea underlying the study presented here is the miniaturization of the push-pull technique by using micro-suction cups to investigate small-scale processes in the rhizosphere. The new technique is expected to yield not only concentrations of solutes, but also reaction rates for processes such as the biodegradation of exu-dates or the ligand-controlled dissolution of minerals. In a previous study, we showed that the push-pull technique can be miniaturized using micro-suction cups (Knecht et al. 2011). By injecting about 250 μl of a solution containing different non-reactive and reactive tracers into a sand-filled, water-saturated thin-slab chamber and then extracting about 850μl of the pore water from the same point with a slow and constant flow rate, we obtained breakthrough curves that were well predicted by simula-tions based upon the advection-dispersion equation (White and Oostrom 2000). In a similar experimental system, we subsequently adopted the μPPT method to unsaturated conditions and showed that it worked to a soil water saturation as low as 34 % (Knecht et al.2013). All these previous tests were performed in the ab-sence of plant roots. Root activity changes the relative hydraulic conductivity, which is the main limiting factor for theμPPT method under unsaturated conditions, not only by altering the water content but also because of compaction and reorientation of soil particles around them. In addition, microbial activity can have a strong influence on flow conditions (during a μPPT experi-ment). Microorganisms colonizing the pore space can clog pores by proliferation of cells, production of extra-cellular polymers, release of gaseous byproducts or microbially mediated accumulation of insoluble precip-itates (“bioclogging”) (Baveye et al.1998). Soil hydrau-lics may not only be affected by changes in porosity, but also by changes in the viscosity of the soil solution. All
these changes can be local and result in a non-uniform porous medium characterized by different local porosity domains with highly contrasting permeability. Under unsaturated conditions, these heterogeneities can cause hysteresis effects during a μPPT experiment, thus the sampled pores during extraction may not be entirely identical with those affected during injection of the test solution. Another implication might be caused by pref-erential flow, which includes “all phenomena where water and solutes move along certain pathways, while bypassing a fraction of the porous matrix” (Simunek et al.2003).
The aim of this work was to adapt the new μPPT method to a porous medium colonized by plants and to evaluate its potential usefulness for studying rhizo-sphere processes. For this purpose we performed μPPT in the surroundings of roots of Lupinus albus grown in sand-filled rhizoboxes. To show the potential of the new method, we studied the biodegradation of citrate as a well-known model process. Citric acid is a low-molecular-weight organic acid, which is exuded by the roots of many plants and thus is a representative substrate for microbial activity in the rhizosphere. Lupinus albus was chosen as a model plant because it is well known for exuding particularly high amounts of organic compounds (like citrate) from so-called cluster or proteoid roots (Dinkelaker et al.1995).
To investigate degradation, we used deuterated cit-rate (citcit-rate-d4), which was injected both into bulk soil and adjacent to roots. As a non-reactive tracer bromide was injected simultaneously to obtain information about the hydraulic properties of the pore space into which the test solution was injected. The extracted transient solute concentration curves were numerically modeled. To account for changes in the tortuosity and permeability at sampling locations, hydraulic parameters were fitted when necessary. In addition, potential in situ degrada-tion rates for citrate-d4 around cluster roots were deter-mined. Background concentrations of citrate (exuded by the plants) were monitored to gain information about the exudation activity of the roots.
Materials and methods Rhizoboxes
The rhizoboxes used in this study were adapted from the type used by Dessureault-Rompré et al. (2006). The
boxes had a length of 60 cm, a width of 15 cm and a thickness of 1 cm (inner volume: 900 cm3; Fig.1). Front and back sides were made of acrylic glass plates to allow the observation of root growth and to permit the targeted insertion of micro-suction cups. The two transparent p l a t e s w e r e f i x e d i n t o a f r a m e m a d e f r o m polyvinylchloride (PVC) and sealed with silicon to pre-vent water leaking from the box. Three wicks made of a hollow polyethersulfone fiber (Rhizon irrigators, Rhizosphere research products, Wageningen, Netherlands) were installed, one each at 5 and 10 cm depth, enabling subsequent irrigation of the system, and one at 58 cm depth, allowing for drainage at the bottom. Each rhizobox was filled with quartz sand (40/50 Accusand, Schroth et al. (1996)). The mean particle diameter was 0.359 mm and the sphericity 0.9, the particle size distribution is shown in Schroth et al. (1996), > 99 wt.% of particles are in the range 0.25– 0.5 mm. The sand contained trace concentrations of metals and had an organic matter content of 0.3 g kg−1. For further chemical and physical character-istics we refer to Schroth et al. (1996). To pack the sand as homogeneously as possible, we used a wide-neck falling funnel containing three sieves to randomize par-ticle motion during falling. The bulk density of the sand packings was about 1.73 g cm−3in all rhizoboxes. Plant cultivation
Seeds of Lupinus albus amiga (“Weissblühende Lupinie”, Otto Hauenstein Samen, Rafz, Switzerland) were surface-sterilized in a 10 % hydrogen peroxide solution (Liang and Li 2003) and then germinated in pots filled with sand. After a week, three healthy plants were transplanted into three rhizoboxes described above (one plant per rhizobox) and grown in a climate cham-ber under controlled conditions on a 16 h (22 °C)/8 h (15 °C) day/night cycle at 60 % humidity. The rhizoboxes were tilted at an angle of 30° to force the roots to grow along the front plate. To prevent light interference on root growth, the rhizoboxes were cov-ered with dark plastic sheets (see Fig.1). The cover was only removed to monitor root development and for the μPPT experiments. The rhizoboxes were percolated with a nutrient solution (10 % strength modified Hoagland solution according to Tandy et al. (2006)) by means of a peristaltic pump, keeping the sand in the boxes moist throughout the experiments. After 10 days of growth, the phosphate concentration of the irrigation
solution was reduced to 5μM to induce the formation of cluster roots and to maximize citrate exudation (Johnson et al. 1996; Keerthisinghe et al. 1998; Neumann and
Römheld1999).
Emergence of cluster roots
When cluster roots became distinguishable from normal roots, the cluster rootlets had already reached a length of approximately 2 to 3 mm. It was not possible in this study to clearly distinguish cluster roots already at an earlier stage of their development due to their similarity in color to that of the quartz sand. Furthermore, the roots did not always grow close to the transparent front plate. Based on the investigations of Watt and Evans (1999b), we determined the day of “visible” emergence to be after 2 to 3 days of development. For pictures of cluster roots of Lupinus albus we refer to Watt and Evans (1999b).
Estimation of water saturation using light transmission To obtain spatially resolved information about the water saturation in the medium around the roots and in bulk soil, we used visible light transmission combined with image analysis. We built a system similar to that de-scribed by Tidwell and Glass (1994). The rhizoboxes were installed in front of a light box (Prolite 5,000 HiQ, Kaiser Fototechnik, Buchen, Germany). A digital
single-lens reflex camera (Pentax K 10D, Lens: Pentax 18–55, Pentax Europe GmbH, Hamburg, Germany) was fixed at a distance of 50 cm from the chamber to record the intensity of the light transmitted through the porous medium. The light box was covered with black cardboard/plastic with an opening just large enough that only a selected area of 10×10 cm of the rhizobox was illuminated. For analysis, the images (raw image format) were converted to gray scale (Adobe Photoshop CS3 Extended). Gray-scale values were calculated from the pixels included in 3 to 4 rectangles of approximately 1× 1 mm size each (ca. 590 pixels in total) selected in the close surrounding of the suction cup, and mean values were calculated. This resolution allowed to detect even small-scale heterogeneities in water saturation around a sampling location. Before taking a picture of a rhizobox with roots, a picture of a dry“control” sand pack was recorded. The pictures of the dry“control” sand pack were used for light intensity offset correction, eliminat-ing possible time dependent heterogeneities in the lighting.
Gray values were calibrated to water saturation using a sand pack in a small thin-slab chamber of 10×10× 1 cm (identical acrylic glass and PVC-frame as used for rhizoboxes), as described in detail by Knecht et al. (2013). Pictures were taken at dry and saturated condi-tions and after varying the capillary pressure head in several steps from 0 to 60 cm H2O by means of a
hanging water column. Again, before each picture, an
Rhizon irrigators
Black plastics for covering the rhizobox
Rhizobox filled with sand transparent front and back side
Irrigation tubes connected to a pump Rhizon irrigator Lupinus albus Inflow of nutrient solution used for drainage (optional) Fig. 1 Schematic of a rhizobox
with a growing plant. For cultivation, rhizoboxes were tilted at an angle of 30°; rhizoboxes were in an upright position during micro push-pull tests
additional dry“control” sand pack was recorded. Gray-scale values were averaged along a distinct straight line of approximately 3.5 cm (899 pixels) lateral from the center of the sand pack for each picture. To relate the measured gray-scale values to volumetric water satura-tion, we used the water retention curve determined for the same sand by Schroth et al. (1996).
Micro push-pull test experiments
Micro push-pull tests were carried out in three different types of “micro-habitats”: bulk soil (>2 cm distance from roots), rhizosphere of normal roots, and rhizo-sphere of cluster roots (∼1 mm distance from normal or cluster root). Cluster roots were selected at different stages of development. Preparations for an experiment started as soon as cluster roots became visible in the lower part of the rhizoboxes. To reduce water flow towards the root during theμPPT, transpiration of the plants was limited by covering the plants with a trans-parent plastic bag 1 day before a test was started. Approximately 10 h before the test, irrigation was stopped to limit vertical water flow during theμPPT. One to three h before the experiments, pictures were taken to determine the water content in the sand packs as described above. Then, holes were drilled through the front plate adjacent to cluster roots, normal roots and in bulk soil by means of a hand drill, and suction cups were installed as described by Knecht et al. (2011). They were made of 1-cm-long ceramic capillaries (pure aluminum oxide, effective length∼0.85 cm; 1.2 mm o.d., 0.6 mm i.d.; PI Ceramic, Lederhose, Germany) and had a total dead volume of<6 μL. One tip of the capillary was closed with hot glue, while the other one was connected via a small ETFE tube (Omnilab, Mettmenstetten, Switzerland) to a peristaltic pump (BVP, Ismatec, Glattbrugg, Switzerland). To determine pH, a drop of soil solution (about 70μL) was collected through addi-tionally drilled holes in bulk soil and in the rhizosphere of the selected roots by inserting a short piece of a small ETFE tube connected to a syringe. To limit disturbance around the suction cups, the samples from the rhizo-sphere for pH measurement were taken on the side of the roots opposite to the suction cups. The pH of the sam-pled solution was measured using an ion sensitive field effect transistor electrode (ISFET IQ125, IQ scientific Instruments, California, USA). No samples for pH mea-surements were taken on the second day of experiments
to avoid interference with the sensitive experimental design after the micro-suction cups had been installed.
A total of 24μPPT were performed in rhizoboxes moved to an upright position (no tilt): 4 in bulk soil, 7 adjacent to normal roots and 13 close to cluster roots. The tests were always performed in the afternoon, when peak values for citrate exudation from cluster roots can be expected (Dessureault-Rompré et al. 2007). In one rhizobox, tests were repeated after 24 h using the same suction cups. We defined grey-brown/dark-brown col-ored cluster roots as senescent cluster roots (cf. Neumann et al.1999). Within this work the following replicate samples were therefore collected: With one suction cup installed at one location and oneμPPT, we collected a sequence of about 10–15 samples for this one location and time of injection. Replicates refer to i) different sampling locations in different rhizoboxes and different roots and ii) repeating aμPPT at exactly the same location at a later time.
The test solution contained citrate-d4 (5 mM, citric acid-2,2,4,4-d4, isotopic purity 98 %, ReseaChem
GmbH, Burgdorf, Switzerland) as reactive tracer and bromide (1 mM, potassium bromide p.a., Merck, Darmstadt, Germany) as non-reactive tracer.
The pH of the test solution was adjusted to the measured pH values of the respective sampling location (using 1 M NaOH or 1 M HCl). The injected volumes were about 120 to 160 μl at rates
of 2.4 to 3.0 μl min−1 (injection time: 0.83 to
0.95 h). In 7 tests the extraction did not yield enough soil solution for further analysis. In the other tests, the extraction volumes were between 210 and 500 μl after an extraction time of approx-imately 2.8 to 3.4 h. The extraction rates varied between 2.3 and 2.6 μl min−1 (for four experiments,
the rates were ≤2.1 μl min−1). The rest phase
between injection and extraction was 0.03 to 0.14 h (time needed to prepare peristaltic pump, tubes and sample vials for extraction phase). Information about the exudation activity of the roots was gained by determination of non-labeled citrate concentrations in the extracted soil solution samples. Preliminary experiments were performed with an additional rhizobox, using Acid Red 1 (a red dye, Azophloxine for Microscopy, Fluka AG, Switzerland) as tracer (1.47 mM, injection volumes: 200μl, injection rates:∼2.5 μl min−1, injection time: 1.7 h) to visualize the spatial distribution pattern of the injected test solu-tion during aμPPT (not shown).
Analysis of solution samples
All solution samples were collected in autosampler vials
with 200 μl inserts (Chromacol, Herts, United
Kingdom). About 20μl of formaldehyde (>36.5 % in water, Fluka AG, Switzerland) was added to each vial before extraction to prevent microbial degradation (cf. Dessureault-Rompré et al.2006). Each sample was di-luted with ultrapure water (TKA-GenPure, Huber & Co. AG, Reich, Switzerland) in order to get sufficient vol-ume for analysis. Sample vials were hermetically sealed and stored at 4 °C. Analysis was carried out within 25 days. Bromide was analyzed by means of ion chro-matography using a DX-320 ion chrochro-matography sys-tem equipped with an electrical conductivity detector and an EG40 eluent gradient generator (Dionex IC20, column: AS11-HC, eluent generator EG40: potassium hydroxide (1–60 mM), flow: 1.5 ml/min; Dionex AG, Olten, Switzerland).
Citric acid (sodium citrate monobasic anhydrous, Sigma-Aldrich, Buchs, Switzerland) and citric acid-2,2,4,4-d4 for internal standard were quantified in the
sample extracts using a HP Series 1,100 high-performance liquid chromatograph (Hewlett-Packard, Waldbronn, Germany), equipped with an online vacuum degasser (DG4, Henggeler Analytic Instruments, Riehen, Switzerland), a binary high-pressure gradient pump, an autosampler, and a heated column compart-ment (column temperature was kept at 25 °C). Separation was achieved with a Macherey Nagel AG, CC 125/2 Nucleosil, 120–3, C18 column. A 5 μL ali-quot of sample extract was injected and isocratically eluted off the column with 0.2 mL min−1 of 100 % nanopure water for 6 min.
A triple quadrupole mass spectrometer (API4000, Applied Biosystems, Rotkreuz, Switzerland) was operated in negative ion mode electrospray. Ionization efficiency was increased by post-column
addition of a 2 % ammonia solution at 30 μL/min
using a Bischoff 2,200 micro-HPLC pump (Bischoff GmbH, Leonberg, Germany). Nitrogen gas was used as drying and nebulizer gas. Highest sensitivity was achieved with the spray voltage set to -3,800 V, the source temperature to 390 °C, entrance potential at −15.0 V and the declustering potential to −35.0 V. The transition from m/z 191.6 to 112.3 was
moni-tored with a collision energy of −15 V and m/z
191.6 to 87.0 with a collision energy of −25 V for citric acid, and m/z 195.2 to 113.1 with a collision
energy of −20 V and m/z 195.2 to 89.1 with a
collision energy of −25 V for citric acid-d4. Modeling
The transport behavior of the tracers was simulated as described by Knecht et al. (2013) using the model STOMP (Subsurface Transport Over Multiple Phases, White and Oostrom (2000)). To account for the potential influence of microorganisms and root growth on flow and transport in the sand pack, the values of the porosity (n) and longitudinal dispersivity (αL) were adjusted by
weighted nonlinear least-squares curve-fitting of the simulated tracer curves to the experimental bromide curves (fitting range for n: 0.30–0.35; fitting range for αL: 0.4–14 mm). The weights were adjusted according
to the analytical reliability of the measured solute con-centrations and the information content of the profile (increased weights for the first 1 to 2 h of extraction phase). To account for heterogeneity in the (initial) water content distribution (information gained from pic-tures of visible light transmission), especially around roots, and for differences in the hydraulic properties between rhizoboxes with plants and those with sterile quartz sand used for water content calibration (e.g. differences in porosity due to root growth and microbial activity in the planted rhizoboxes), also the initial hy-draulic pressure (Pl) was fitted within a given range of
values (fitting range: about ± 5 mm from estimated mean values). Values for the diffusion coefficients were taken from the literature as DBromide=2.08×10⁻⁹m2s−1and
DCitrate3-= 6.23 × 10⁻¹⁰ m2 s−1 (Buffle et al. 2007).
Microbial degradation of citrate was described as a first-order reaction. The reaction rate coefficient was determined by weighted nonlinear least-squares curve-fitting of the model to the measured citrate-d4 concen-trations of the extracted solution samples.
Results
Non-reactive tracer behavior
We performed a total of 24 μPPT in the presence of living plant roots. In all experiments, it was possible to inject a small volume of about 120 to 160 μl of test solution. In 17 experiments it was possible to extract 8– 10 samples of about 20 to 80μl volume each. The water saturation of the sampled soil domains was estimated
using the light transmission method to range between 0.7 and 0.9, with small-scale variations especially around cluster roots. In 7 experiments, it was not possi-ble to extract enough soil solution for the chemical analysis of the tracers. In three of these cases the reason for this was too low hydraulic conductivity due to a water saturation of <0.5 at the sampling locations. In the other four experiments (estimated water saturations ≥0.65) hydraulic contact was lost between suction cup and porous medium.
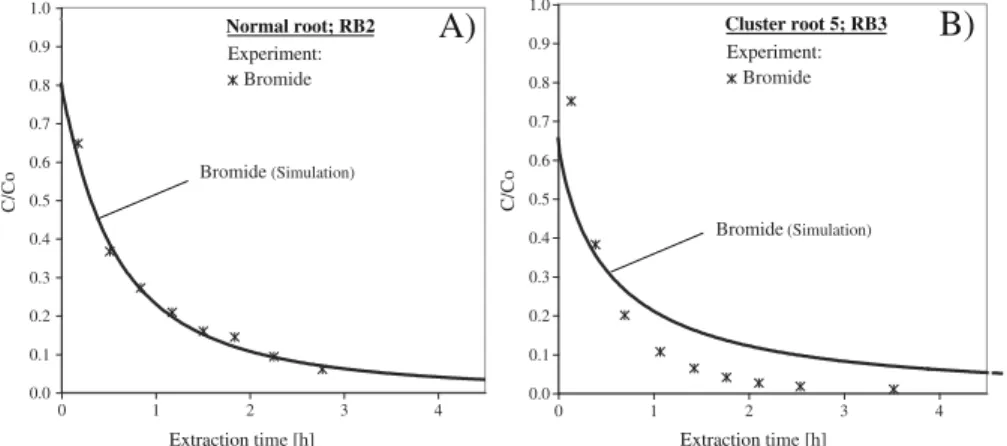
Typical examples of the experimental bromide (breakthrough) curves are shown in Fig. 2. The mea-sured bromide concentrations decreased exponentially from the beginning of the extraction phase. Table 1 gives an overview of the best-fit values of the parame-ters determined by curve-fitting and the corresponding root mean squared errors (RMSE). For 13 experiments, the RMSEbromidewas between 0.02 and 0.07. The
cu-mulative mass recovery for these experiments was
be-tween 52 and 68 %. For the remaining four μPPT
experiments, the RMSEbromide was comparably high
with values between 0.11 and 0.18 and less than 34 % of the injected bromide could be recovered after about 3 h of extraction. A representative example of break-through curves for bromide for each case is shown in Fig. 2: a) RMSEbromide=0.02; b) RMSEbromide=0.12.
The root mean-squared errors indicate a good model fit in the case of curve (a) while the fit was not satisfac-tory in case (b). In all four experiments with high RMSEbromide, the measured concentration of bromide
decreased faster than in the best-fit simulation.
Preliminary experiments (data not shown) with Acid Red 1 dye showed strong gravity-driven flow of the
injected test solution during the first 2 h of the tests for rather dry conditions with a water saturation <0.45. In tests with higher water saturation (water saturation >0.7), the front of the injected test solution showed in most cases more or less circular shapes around the suction cups, but in some cases, the test solution showed uneven flow patterns during injection (e.g. distinct rapid flow in only some parts around the suction cup or along a root).
Reactive tracer behavior
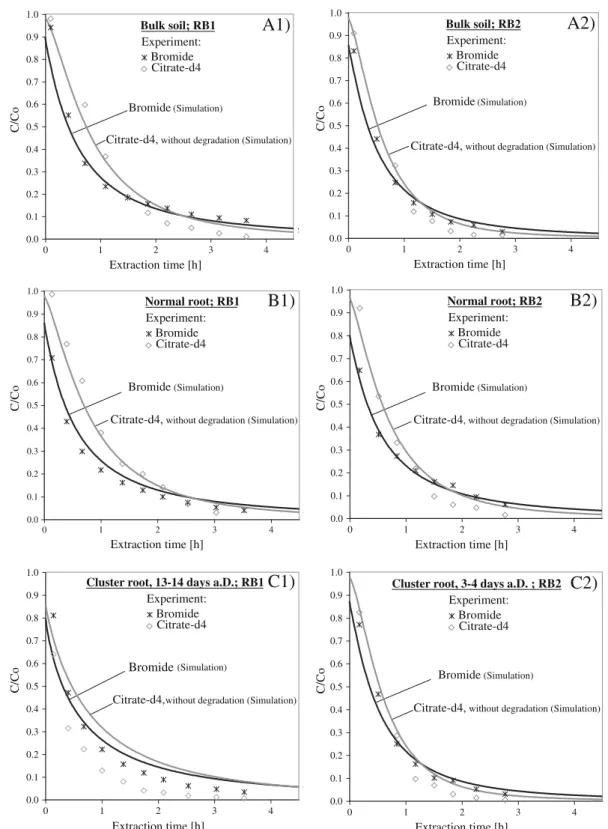
After adapting the hydraulics of the respective habitats in the numerical simulations to fit the non-reactive tracer data, theoretical extraction breakthrough curves were calculated with the assumption of no microbial degra-dation for citrate-d4 with the diffusion coefficient for citrate and with the identical hydraulic properties for flow and transport conditions (for experiments with RMSEbromide≤0.07). Figure3 shows results from tests
in bulk soil, adjacent to normal roots and adjacent to cluster roots for two different rhizoboxes each. In most cases, the simulated curves described the measured citrate-d4 concentrations reasonably well in the early phases of extraction, but overestimated them strongly in the later phases. The largest discrepancy between simulation and measurements was found adjacent to a 13 to 14 days old senescent cluster root, where right from the beginning of the extraction phase the measured citrate-d4 concentration decreased much faster than the simulated one. The cumulative mass recovery for these experiments was 60 to 78 %, except for the cluster root of 13 to 14 days after development: in this experiment,
C /C o Bromide(Simulation) Extraction time [h] Normal root; RB2 Experiment: Bromide
A)
0.0 0.1 0.2 0.3 0.4 0.5 0.6 0.7 0.8 0.9 1.0 0 1 2 3 4 C /C o Bromide(Simulation) Extraction time [h] 0.0 0.1 0.2 0.3 0.4 0.5 0.6 0.7 0.8 0.9 1.0 0 1 2 3 4 Cluster root 5; RB3 Experiment: BromideB)
Fig. 2 Extraction breakthrough curves for bromide for two micro push-pull tests adjacent to a normal root and b cluster root. The root mean squared errors for the best fit were: a 0.02; b 0.12. C Concentration [mM], CoInitial concentration [mM]
only about 27 % of the injected citrate-d4 could be recovered over the extraction time.
Results for the experiments in the surroundings of three cluster roots of different age are shown in Fig.4 (experiments were repeated after 24 h on the same roots). The divergence between the theoretical simula-tion for citrate-d4 and the measured concentrasimula-tions in the experiments with cluster roots after 3 to 4 days of development was again observed only in the rear part of the curves (Fig.4a1-3). For the repeated experiments 1 day later, however, the measured citrate-d4 concentra-tions in the extracted soil solution samples decreased much faster and were from the beginning of the extrac-tion significantly lower compared to the curves predict-ed by simulation (Fig. 4 b1-3). Consequently, mass recovery was significantly lower for the experiments on the second day: from prior 45–62 % to now 21– 29 %. Interpreting the difference between measured and predicted citrate-d4 concentrations being due to micro-bial degradation, the μPPT experiments showed only little microbial degradation of citrate-d4 at the beginning of the extraction phase—in bulk soil, adjacent to normal roots and in the surroundings of cluster roots after 3 to
4 days of development, whereas strong degradation took place in the rhizosphere of cluster roots after 4 to 5 days of development. For the latter habitats, first-order deg-radation rate constants of 0.71, 0.51 and 0.50 h−1 (half-life: T1/2=0.98, 1.36 and 1.37 h) were obtained by fitting
the model to the measured data (see Table 1). For the experiment in the surroundings of the senescent cluster root after 13 to 14 days of development, we calculated a degradation rate constant of 0.61 h−1 (half-life: T1/2=
1.14 h).
Background citrate
Background citrate concentrations in the sampled soil solutions were determined separately from the injected citrate-d4 concentrations. In bulk soil and in the sur-roundings of normal roots, we found no measurable citrate concentrations (detection limit: 0.0025 mM) for 4 habitats, while for one habitat the concentrations were <0.02 mM. This is in good agreement with values found by Dessureault-Rompré et al. (2007). Significantly higher concentrations were measured in the rhizosphere of cluster roots (Fig.4). Citrate is known as the major Table 1 Overview of the test
habitat of the experiments and best-fit results for the bromide data (S,αL: longitudinal dispersivity, n: porosity) and the citrate-d4 data (k). Corresponding root-mean squared errors (RSME) for the results for bromide are also listed. Reaction rate constants k were calculated assuming first order reaction kinetics
S: water saturation;αL: longitudi-nal dispersivity; k: reaction rate constant
a
For cluster roots, age is given as days after development
b
No degradation measurable from beginning of extraction phase
Test habitat Best-fit results for bromide/citrate-d4
Rhizobox Nr. Test surrounding Age of roota
Fitting parameters RMSE Fitting
parameter
S αL n k
[days] [mm] [cm3/cm3] [h−1]
RB1 Bulk soil 0.88 0.40 0.33 0.07 no deg.b
RB1 Normal root 0.90 0.40 0.34 0.03 no deg.b
RB1 Cluster root 13–14 0.74 2.30 0.35 0.07 0.61
RB2 Bulk soil 0.75 0.40 0.32 0.06 no deg.b
RB2 Normal root 0.84 0.40 0.31 0.02 no deg.b
RB2 Cluster root 3–4 0.73 0.40 0.30 0.05 no deg.b
RB2 Cluster root 4–5 0.69 0.40 0.35 0.11 –
RB3 Cluster root 1 3–4 0.91 3.00 0.34 0.02 no deg.b
RB3 Cluster root 2 3–4 0.85 0.40 0.35 0.04 no deg.b
RB3 Cluster root 3 3–4 0.90 3.00 0.35 0.03 no deg.b
RB3 Cluster root 4 4–5 0.79 0.40 0.30 0.04 0.38
RB3 Normal root 0.88 0.90 0.35 0.11 no deg.b
RB3 Cluster root 1 4–5 0.93 0.90 0.35 0.06 0.71
RB3 Cluster root 2 4–5 0.82 2.40 0.30 0.02 0.51
RB3 Cluster root 3 4–5 0.83 7.60 0.35 0.02 0.50
RB3 Cluster root 4 5–6 0.83 3.14 0.35 0.18 –
C
/C
o Bromide(Simulation)
Citrate-d4, without degradation (Simulation)
Extraction time [h] Citrate-d4 Bulk soil; RB1 Experiment: Bromide
A1)
0.0 0.1 0.2 0.3 0.4 0.5 0.6 0.7 0.8 0.9 1.0 0 1 2 3 4 C /C o Bromide(Simulation)Citrate-d4, without degradation (Simulation)
Extraction time [h] Citrate-d4 Bulk soil; RB2 Experiment: Bromide
A2)
0.0 0.1 0.2 0.3 0.4 0.5 0.6 0.7 0.8 0.9 1.0 0 1 2 3 4 C /C o Bromide (Simulation)Citrate-d4, without degradation (Simulation)
Extraction time [h] Citrate-d4 Normal root; RB1 Experiment: Bromide
B1)
0.0 0.1 0.2 0.3 0.4 0.5 0.6 0.7 0.8 0.9 1.0 0 1 2 3 4 C /C o Bromide (Simulation)Citrate-d4, without degradation (Simulation)
Extraction time [h] Citrate-d4 Normal root; RB2 Experiment: Bromide
B2)
0.0 0.1 0.2 0.3 0.4 0.5 0.6 0.7 0.8 0.9 1.0 0 1 2 3 4 Bromide (Simulation)Citrate-d4, without degradation (Simulation)
Citrate-d4
Cluster root, 13-14 days a.D.; RB1 Experiment: Bromide
C1)
C /C o Extraction time [h] 0.0 0.1 0.2 0.3 0.4 0.5 0.6 0.7 0.8 0.9 1.0 0 1 2 3 4 Citrate-d4Cluster root, 3-4 days a.D. ; RB2 Experiment: Bromide
C2)
C /C o Bromide (Simulation)Citrate-d4, without degradation (Simulation)
Extraction time [h] 0.0 0.1 0.2 0.3 0.4 0.5 0.6 0.7 0.8 0.9 1.0 0 1 2 3 4
Fig. 3 Extraction-breakthrough curves for bromide and cit-rate-d4 for two series of micro push-pull test experiments in a bulk soil and adjacent to b normal roots and c cluster roots performed in two different rhizoboxes (left side: Rhizobox 1
(RB1); right side: Rhizobox 2, RB2). Symbols show the experimental results, solid lines show the simulated curves. The development stage of cluster roots is given as days after development (a.D.)
C
/C
o
Bromide(Simulation)
Citrate-d4, without degradation (Simulation)
Extraction time [h] C o n c. [m M ] Citrate Citrate-d4
Cluster root 1, 3-4 days a.D.; RB3
Experiment: Bromide
A1)
0 0.1 0.2 0.3 0 1 2 3 4 0.0 0.1 0.2 0.3 0.4 0.5 0.6 0.7 0.8 0.9 1.0 C o n c. [m M ] Citrate-d4Cluster root 1, 4-5 days a.D.; RB3
Experiment: Bromide
B1)
0.0 0.1 0.2 0.3 0.4 0.5 0.6 0.7 0.8 0.9 1.0 C /C o Bromide (Simulation)Citrate-d4, without degradation (Simulation)
Citrate-d4, with degradation (Simulation)
Extraction time [h] 0.0 0.1 0.2 0.3 0 1 2 3 4 Citrate C /C o Bromide (Simulation)
Citrate-d4, without degradation (Simulation)
Extraction time [h] C o n c. [m M ] Citrate Citrate-d4
Cluster root 2, 3-4 days a.D.; RB3
Experiment: Bromide
A2)
0 0.1 0.2 0.3 0 1 2 3 4 0.0 0.1 0.2 0.3 0.4 0.5 0.6 0.7 0.8 0.9 1.0 C o n c. [m M ] Citrate 0.0 0.1 0.2 0.3 0.4 0.5 0.6 0.7 0.8 0.9 1.0 C /C o Bromide (Simulation)Citrate-d4, without degradation (Simulation)
Citrate-d4, with degradation (Simulation)
Citrate-d4
Cluster root 2, 4-5 days a.D.; RB3
Experiment: Bromide
B2)
Extraction time [h] 0 0.1 0.2 0.3 0 1 2 3 4 C /C o Bromide (Simulation)Citrate-d4, without degradation (Simulation)
Extraction time [h] C o n c. [m M ] Citrate Citrate-d4
Cluster root 3, 3-4 days a.D.; RB3
Experiment: Bromide
A3)
0 0.1 0.2 0.3 0 1 2 3 4 0.0 0.1 0.2 0.3 0.4 0.5 0.6 0.7 0.8 0.9 1.0 C /C o Extraction time [h] 0.0 0.1 0.2 0.3 0.4 0.5 0.6 0.7 0.8 0.9 1.0 C o n c. [m M ] Citrate-d4Cluster root 3, 4-5 days a.D.; RB3
Experiment:
Bromide
B3)
Bromide (Simulation)
Citrate-D4, without degradation (Simulation)
Citrate-D4, with degradation (Simulation)
0.0 0.1 0.2 0.3 0 1 2 3 4 Citrate
organic anion exuded by Lupinus albus (Watt and Evans 1999b). Thus, the increased citrate concentration indi-cates an exudation activity of the cluster roots—either during theμPPT experiments or before. Lower concen-trations at the beginning of the extraction phases can be due to dilution by the injected test solution, while the later decrease in citrate concentration may be explained by small-scale heterogeneity of background solute con-centrations and/or degradation processes. For two hab-itats, the measurements showed two peaks of citrate concentration, which may indicate a bi-phasic temporal pattern of the exudation activity (Dessureault-Rompré et al.2007).
In the rhizosphere of the younger cluster roots (3 to 4 days after development), citrate
concentra-tions were rather low and peak values of ≤0.1 mM
were determined. On the next day, however, citrate concentrations peaked between 0.30 and 0.35 mM in the same habitats. In other words, low concen-trations of citrate in the rhizosphere of young cluster roots correlated with no (or only little) biological degradation of citrate-d4 (or at least not at the beginning of extraction), whereas high citrate concentration in the same habitats 1 day later correlated with strong microbial degradation of citrate-d4.
The citrate concentrations measured in the soil solu-tion sampled adjacent to the senescent cluster root 13 to 14 days after development were rather low with a peak value of 0.033 mM, but nevertheless there was a strong immediate degradation of citrate-d4 with a calculated degradation rate constant of 0.61 h-1 (half-life: T1/2=
1.14 h) (Fig.3c).
The variation in citrate concentration was in accor-dance with pH values. The pH of the solution samples extracted prior to the tests were significantly higher in the bulk soil and around normal roots than in the rhizo-sphere of active cluster roots: pHbulk soil; (n=6)= 6.0;
pHnormal root; (n=5)=5.8; pHcluster root,age: 3–4 days; (n=4)=
4.6; pHcluster root, age 5–6 days; (n=2)=3.5; pHcluster root, age 13–14 days; (n=1)=6.0.
Discussion Zone of influence
The zone of influence is of high relevance for theμPPT method, since the purpose of the test is to assess rhizo-sphere processes on a small scale with minimal impact on the soil. The impacted soil volume of a μPPT is primarily determined by the injection volume and the radius r of the impacted soil cylinder around the suction cup may be computed using (Knecht et al.2013)
r¼ ffiffiffiffiffiffiffiffiffiffiffiffiffiffiffiffiffiffiffiffiffiffi Qt πbθþ rSC2 r ð1Þ where Q is the injection rate, t is the injection time, b is the length of the suction cup,θ is the water content and rsc is the radius of the suction cup. With decreasing
water saturation the impacted soil volume increases accordingly. For a saturation of 0.7 for example, the impacted sand pack volume would have been approxi-mately 490 to 660μl and the radius of the corresponding cylinder around the suction cup 4 to 4.6 mm with no mixing. Considering also diffusion/dispersion, the soil volume that actually came into contact with the injected solution was even larger, depending on the extent of these processes. In this case, the calculated radius can be understood as the location where C/Co=0.5 for a
non-sorbing, non-reactive tracer.
For an experiment with an extraction rate of 2.3 to 2.6μl/min and an extraction time of 2.5 h, the sampled soil volume would be about 1,400 to 1,600μl (equiva-lent to a soil cylinder around the suction cup with a radius of 6.7 to 7.1 mm) for a water saturation of 0.7. The width of the rhizosphere can vary considerably around a root, depending on the process of interest and can extend from <1 mm (e.g. for poorly mobile nutrients like phosphate) up to several centimeters (e.g. for mo-bile nutrients like nitrate) (cf. Darrah1993; Hinsinger et al.2005). Thus, theμPPT method shows potential for studying rhizosphere processes in situ. The substitution of micro-suction cups by micro capillaries, as used by Tandy et al. (2013) for collection of soil solution might allow further miniaturization of the μPPT . Increased spatial resolution could then be achieved by placing several micro-suction cups (or micro capillaries) around the same root. The micro capillaries could substitute the micro-suction cups used, but not theμPPT, which is an experimental method and not a device.
Fig. 4 Extraction-breakthrough curves forμPPT experimentad-jacent to 3 different cluster roots (Nr. 1–3) with different devel-opment stage of cluster roots of Lupinus albus: a 3 to 4 days after development and b 4 to 5 days after development. Symbols show the experimental results, solid lines show the simulated curves. The lower part of the graphics show the measured background citrate concentrations in the extracted soil solution samples
Hydraulic characterization of porous medium
To adapt theμPPT method to a porous medium popu-lated with roots and associated rhizosphere organisms, it was essential to accommodate changes in its hydraulic properties due to microorganisms and root growth. Information about the impact of the colonization of our sand packs by roots and microbes on flow and transport characteristics was gained from the break-through curve of the simultaneously injected non-reactive tracer. By varying three relevant hydraulic pa-rameters (porosity, n; longitudinal dispersivity,αL;
ini-tial hydraulic pressure, Pl) in the numerical simulation
during fitting, we forced the simulated curves to match the respective measured data for bromide concentrations adjacent to roots (normal roots and cluster roots) and in bulk soil as close as possible. Our results showed that the optimized values of this parameter set allowed for most experiments to adequately describe the measured bromide breakthrough curves and thus for adapting the μPPT method to different habitats. Nonetheless, due to numerous assumptions made in the simulations (Knecht et al. 2013), the best-fit parameters may not reflect actual physical conditions of the porous medium. While fitting parameters Pl and n affect the shape of
the breakthrough curves in a similar fashion,αLaffects
their shape in a different way.
From our results, we can see a tendency to higher dispersivity values in the rhizosphere of cluster roots than around normal roots and in bulk soil. This might be due to more heterogeneity caused by enhanced activity of roots or microorganism or quite simply because of the differences in root architecture. Cluster roots form dense rootlets with lengths of up to 9 mm in our experiments, which is in the range given by Dinkelaker et al. (1995). These differences to bulk soil and around roots may be sufficient to explain the different overall flow/transport behavior of solutes inμPPT adjacent to cluster roots.
In four experiments, the RMSE from the simulations was rather high compared to the other tests, and the model could not be fitted to the measured data within the range of predetermined physical model parameters. In these experiments, a faster decrease of the measured bromide concentration was observed than was predict-ed, and mass recovery was considerably lower than for the other experiments. A plausible explanation for this failure might be preferential flow. Under unsaturated conditions, preferential flow might become a limiting phenomenon for theμPPT as the flow patterns between
injection and extraction phase will not be entirely re-versible any more. Preferential flow can result from macro-pore flow through e.g. cracks and fissures, where during injection the test solution rapidly flows away from the injection point and cannot be recovered during the extraction phase. Such preferential flow was ob-served in preliminaryμPPT with Acid Red 1 as tracer performed in one of the rhizoboxes with plants. The formation of cracks and fissures can be induced espe-cially in the surroundings of roots by a high capillary water tension associated with root water uptake (Pierret et al.2007). However, note that high mass recovery of solutes during a PPT is not a prerequisite for accurate rate determination (Haggerty et al.1998).
Bromide has often been used as a conservative tracer in subsurface solute transport studies due to its generally low background concentration and low reactivity in soils (Schnabel et al. 1995). If bromide comes into contact with roots, also uptake by plants can be an important transport pathway (Kohler et al. 2005). The fraction of bromide taken up by plants such as wheat, potato and ryegrass in field tracer experiments was found to range from <2 % (Gish and Jury 1982) to 53 % (Kung1990) of the applied tracer mass, depending on factors such as rate of tracer application, soil drain-age, growth season and nitrogen fertilizer application. While plants were exposed to the tracer for several weeks to months in these studies, our tests lasted only 4 to 4.5 h. In addition, by covering the plants with a plastic bag we minimized transpiration-induced root water extraction during the tests. Furthermore, we used chloride, which is chemically analogous to bromide, as background electrolyte in all our experiments. As a competing anion, chloride reduces the uptake of bro-mide by plants (cf. also Epstein 1953; Sheppard and Evenden 1992). Taken all these aspects together, bro-mide uptake by the experimental plants was considered negligible in our tests. Also, the relative mass recovery of bromide from rhizosphere soil compared to root-free bulk soil indicated no significant uptake.
Microbial degradation of citrate-d4
The citrate concentrations in the rhizosphere suggest that the young cluster roots were at the beginning of the exudation activity. According to Watt and Evans (1999b), the efflux of citrate is linked among others to proteoid root development and they reported a begin-ning of citrate efflux by Lupinus albus after about 4 days
of development with a diurnal pulse over 2 or 3 days. Moreover, Shane et al. (2003) observed highest citrate exudation rates for cluster roots after 3 to 5 days of development. Our results from the citrate measurements fit well into these observations, although these studies were done in hydroponic systems and roots can behave quite differently in different growth media or in soils (Marschner1995; Watt and Evans1999a). Dessureault-Rompré et al. (2006) observed a similar behavior of citrate exudation in experiments with Lupinus albus grown in soil. The same authors reported a high tempo-ral variability in the beginning of citrate exudation be-tween individual cluster roots in a subsequent paper (Dessureault-Rompré et al.2007). In line with our ob-servations of lower pH around the active cluster roots, Dessureault-Rompré et al. (2006) reported a decrease in soil pH adjacent to cluster roots from 6.9 to 5.4 during citrate exudation. The mechanism for organic acid ef-flux by roots is not fully clarified. There is evidence that citrate is excreted concomitantly with protons (Watt and Evans 1999a), although Jones (1998) suggested that protons and organic acid are exuded separately of each other, but in spatially coordinated transport events.
The breakthrough curves of the extracted citrate-d4 varied considerably between tests performed adjacent to normal roots, in bulk soil and in the rhizosphere of cluster roots at different stages of development, with significantly lower citrate-d4 concentrations in the rhi-zosphere of active cluster roots and of a senescent cluster root. The fast initial decrease of citrate-d4 con-centrations at the beginning of the extraction phase could not be predicted by the model (using the same flow/transport conditions as for bromide, except for the diffusion coefficient). The assumption that biological degradation is responsible for this discrepancy between measured citrate-d4 concentrations compared to the the-oretical simulations is based on the following points: (1) In a previous study, we found no measurable adsorption of citrate to the sand used also in the present study, and citrate behaved like a non-reactive tracer inμPPT under sterile conditions (Knecht et al.2011). (2) We assume that citrate-d4 has the same adsorption behavior as cit-rate. (3) Root activity and microbial processes (e.g. substrate consumption, biomass growth, respiration, production of extracellular cells, release of gaseous byproducts, attachment/detachment to and from sur-faces etc.) can change physical and chemical properties
of a porous medium (cf. e.g. Baveye et al. 1998;
Frankenberger et al. 1979; Hinsinger et al. 2003;
Rockhold et al.2004). Thus effects on the sorption of the solute cannot be ruled out completely under non-sterile conditions. Different parameters (e.g. adsorption parameters, degradation rate) have a very specific effect on the shape of a breakthrough curve (Schroth et al. 2001). Thus, the numerical simulation is very important and helps to distinguish between different processes. Simulations in which varying degrees of sorption (dif-ferent KD values; KD: solid-aqueous partition
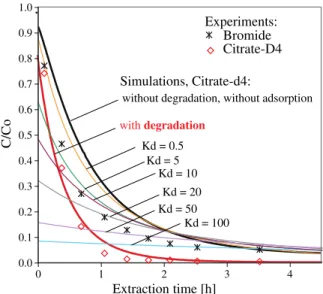
coeffi-cient) were assumed to influence the extraction of citrate show that the concentration of citrate would be de-creased significantly in the beginning of extraction phase and increased slightly at later stage of extraction phase (compared to not adsorbed solutes), resulting in a completely different form of the predicted citrate con-centrations (see Fig. 5). 4) There is good agreement between data and model in Fig.4busing a reaction term in the simulations, whereas the data points may not be fitted using a sorption term.
The measured concentrations of citrate-d4 were low-er than predicted towards the end of all these tests. We assume that this indicates microbial degradation of citrate-d4 after a lag-phase, thus 1 to 1.5 h after begin-ning the extraction (about 2.5 h after the start of the experiment). The assumption of a delayed start of mi-crobial degradation is supported by an incubation ex-periment with citrate and soil containing soil microflora
Experiments: Bromide Citrate-D4 C /C o
without degradation, without adsorption with degradation Kd = 0.5 Kd = 5 Kd = 10 Kd = 20 Kd = 50 Kd = 100 Simulations, Citrate-d4: Extraction time [h] 0.0 0.1 0.2 0.3 0.4 0.5 0.6 0.7 0.8 0.9 1.0 0 1 2 3 4
Fig. 5 Extraction-breakthrough curve for bromide and citrate-d4 with simulations including degradation of citrate and sorption of citrate to sand at different KDvalues (solid-aqueous partition coefficient). Symbols show the experimental results, solid lines show the simulated curves. The experimental data correspond to the results from the experiment shown in Fig.4B1
(Weisskopf et al. (2006). These authors found that cit-rate degradation was negligible during the first 3 h of incubation and then rapidly accelerated to be complete after 24 h.
The experiments performed on the same cluster roots 1 day later showed significantly lower citrate-d4 con-centrations at the beginning of the extraction phase compared to the simulation and the measured back-ground citrate concentrations were much higher than the day before with peak values between 0.3 and 0.35 mM. We conclude that at the time when we injected our test solution on the second day, the micro-organisms were already stimulated by release of citrate from the roots. In addition, degradation on the second day (adjacent to cluster roots after 4 to 5 days of devel-opment) may have been enhanced by induction of mi-crobial activity by the tests conducted at the same loca-tion the day before. But strong degradaloca-tion and a peak value for background citrate of 0.33 mM were also found adjacent to 4 to 5 days old cluster roots, which had not been tested the day before.
From the second-day tests, we determined first-order degradation rate constants for citrate-d4 that were in the range of 0.38 to 0.71 h−1 in the rhizosphere of active cluster roots after 4 to 5 days of development (corre-sponding half-life: T1/2=1.81 to 0.98 h). From the
re-sults of the experiment in the rhizosphere of the senes-cent cluster root, we determined a degradation rate of 0.57 h−1and measured only low concentrations of back-ground citrate. Jones et al. (2003) determined half-lives of organic acids turnover ranging from 1 to 5 h in organic topsoils and from 5 to 12 h in subsoils. Van Hees et al. (2003) determined a mean half-life of 2 to 6 h for citrate which was incubated in forest soils from organic surface horizons. Jones (1998) estimated that decomposition rates in rhizosphere soil were 2–3 fold higher than in bulk soil. On the other hand, Weisskopf et al. (2006) revealed complex strategies by which Lupinus albus protects secreted organic anions from microbial degradation. As far as we know, this was the first time that in situ rates have been determined for the degradation of organic acids in the rhizosphere.
The rhizosphere is often described as a“hot spot” of soil biological activity, which is attributed to the release of exudates by roots that serve as food for rhizosphere bacteria, and also act as chemo-attractants inducing microbes to move towards the roots (e.g. Jones1998). This study underlines the ecological role of the rhizo-sphere as a special soil micro-habitat with high
degradation potentials and high turnover rates. Our re-sults show that theμPPT has the potential to become a useful technique to study rhizosphere processes in situ and—because it is a non-destructive method with only minimal disturbance—to monitor them also over time. Further research is required to adapt the method to more complex systems (e.g. well-graded soil etc.) with e.g. more small-scale heterogeneity and possible influences of solute adsorption have to be taken into account. Our results complement previous findings based on model-ing (Knecht et al.2013), which demonstrated the feasi-bility of μPPT in soils of varying soil physical and hydraulic properties.
Acknowledgments The authors thank M. Oostrom and M.D.
White (Pacific Northwest National Laboratory) for providing STOMP and T. Zwickl (Wädenswil, Switzerland) for Ruby scripting of STOMP fitting and scanning methods. The authors also thank M. Keller (ETHZ) for assistance in designing and constructing the equipment, René Schönenberger (Eawag, Swit-zerland) for analysis of citrate-d4 and citrate and Jörg Luster (WSL, Switzerland) for providing a rhizobox prototype and the ceramic capillaries for the micro-suction cups. This research was funded by the Swiss National Science Foundation projects
200021–113792 and 200020–127139.
References
Baveye P, Vandevivere P, Hoyle BL, DeLeo PC, de Lozada DS (1998) Environmental impact and mechanisms of the biolog-ical clogging of saturated soils and aquifer materials. Crit Rev
Environ Sci Technol 28:123–191
Blossfeld S, Gansert D, Br T, Kuhn AJ, Lösch R (2011) The dynamics of oxygen concentration, pH value, and organic acids in the rhizosphere of Juncus spp. Soil Biol Biochem 43:
1186–1197
Buffle J, Zhang Z, Startchev K (2007) Metal flux and dynamic speciation at (Bio)interfaces. part 1: critical evaluation and compilation of physicochemical parameters for complexes with simple Ligands and Fulvic/Humic substances. Environ
Sci Technol 41:7609–7620
Darrah PR (1993) The rhizosphere and plant nutrition—a quanti-tative approach. Plant Soil 156:1–20
Dessureault-Rompré J, Nowack B, Schulin R, Luster J (2006) Modified micro suction cup/rhizobox approach for the in-situ detection of organic acids in rhizosphere soil solution. Plant Soil 286:99–107
Dessureault-Rompré J, Nowack B, Schulin R, Luster J (2007) Spatial and temporal variation in organic acid anion exuda-tion and nutrient anion uptake in the rhizosphere of Lupinus albus L. Plant Soil 301:123–134
Dieffenbach A, Göttlein A, Matzner E (1997) In-situ soil solution chemistry in an acid forest soil as influenced by growing
roots of Norway spruce (Picea abies [L.] Karst). Plant Soil 192:57–61
Dinkelaker B, Hengeler C, Marschner H (1995) Distribution and function of proteoid rests and other root clusters. Bot Acta
108:183–200
Drever JI, McKee CR (1980) The push-pull test—A method for
evaluating formation adsorption parameters for predicting the environmental effects on in-situ coal gasification and urani-um recovery. In Situ 4:181–206
Epstein E (1953) Mechanism of ion absorption by roots. Nature 171:83–84
Frankenberger WT, Troeh FR, Dumenil LC (1979) Bacterial ef-fects on hydraulic conductivity of soils. Soil Sci Soc Am J 43: 333–338
Gish TJ, Jury WA (1982) Estimating solute travel-times through a crop root zone. Soil Sci 133:124–130
Göttlein A, Hell U, Blasek R (1996) A system for microscale tensiometry and lysimetry. Geoderma 69:147–156 Göttlein A, Heim A, Matzner E (1999) Mobilization of aluminium
in the rhizosphere soil solution of growing tree roots in an acidic soil. Plant Soil 211:41–49
Gregory PJ, Hinsinger P (1999) New approaches to studying chemical and physical changes in the rhizosphere: an over-view. Plant Soil 211:1–9
Haggerty R, Schroth MH, Istok JD (1998) Simplified method of “push-pull” test data analysis for determining in situ reaction rate coefficients. Ground Water 36:314–324
Hinsinger P, Plassard C, Tang CX, Jaillard B (2003) Origins of root-mediated pH changes in the rhizosphere and their re-sponses to environmental constraints: a review. Plant Soil 248:43–59
Hinsinger P, Gobran GR, Gregory PJ, Wenzel WW (2005) Rhizosphere geometry and heterogeneity arising from root-mediated physical and chemical processes. New Phytol 168: 293–303
Hinsinger P, Bengough AG, Vetterlein D, Young IM (2009) Rhizosphere: biophysics, biogeochemistry and ecological relevance. Plant Soil 321:117–152
Istok JD, Humphrey MD, Schroth MH, Hyman MR, Oreilly
KT (1997) Single-well, “push-pull” test for in situ
determination of microbial activities. Ground Water
35:619–631
Johnson JF, Allan DL, Vance CP, Weiblen G (1996) Root carbon
dioxide fixation by phosphorus-deficient Lupinus albus—
contribution to organic acid exudation by proteoid roots. Plant Physiol 112:19–30
Jones DL (1998) Organic acids in the rhizosphere—a critical
review. Plant Soil 205:25–44
Jones DL, Dennis PG, Owen AG, van Hees PAW (2003) Organic acid behavior in soils—misconceptions and knowledge gaps. Plant Soil 248:31–41
Keerthisinghe G, Hocking PJ, Ryan PR, Delhaize E (1998) Effect of phosphorus supply on the formation and function of proteoid roots of white lupin (Lupinus albus L.). Plant Cell
Environ 21:467–478
Knecht K, Schroth MH, Schulin R, Nowack B (2011) Development and evaluation of micro push-pull tests to investigate micro-scale processes in porous media. Environ
Sci Technol 45:6460–6467
Knecht K, Nowack B, Schulin R, Schroth MH (2013) Micro push-pull tests for investigation of small-scale processes in
unsaturated porous media. Vadose Zone J 12. doi:10.2136/ vzj2012.0087.
Kohler A, Abbaspour KC, Fritsch M, Schulin R (2005) Solute recycling by crops and leaching in a drained arable soil. Eur J Soil Sci 56:145–153
Kung KJS (1990) Influence of plant uptake on the performance of bromide tracer. Soil Sci Soc Am J 54:975–979
Liang RX, Li CJ (2003) Differences in cluster-root formation and carboxylate exudation in Lupinus albus L. under different nutrient deficiencies. Plant Soil 248:221–227
Luster J, Göttlein A, Nowack B, Sarret G (2009) Sampling, defining, characterising and modeling the rhizosphere—the soil science tool box. Plant Soil 321:457–482
Marschner H (1995) Mineral nutrition of higher plants. Academic Press, London
Neumann G, Römheld V (1999) Root excretion of carboxylic acids and protons in phosphorus-deficient plants. Plant Soil
211:121–130
Neumann G, Massonneau A, Martinoia E, Römheld V (1999) Physiological adaptations to phosphorus deficiency during proteoid root development in white lupin. Planta 208:373– 382
Pierret A, Doussan C, Capowiez Y, Bastardie F, Pages L (2007) Root functional architecture: a framework for modeling the interplay between roots and soil. Vadose Zone J 6:269–281 Puschenreiter M, Wenzel WW, Wieshammer G, Fitz WJ,
Wieczorek S, Kanitsar K, Kollensperger G (2005) Novel micro-suction-cup design for sampling soil solution at de-fined distances from roots. J Plant Nutr Soil Sci 168:386–391 Rockhold ML, Yarwood RR, Selker JS (2004) Coupled microbial and transport processes in soils. Vadose Zone J 3:368–383 Schnabel RR, Stout WL, Shaffer JA (1995) Uptake of hydrologic
tracer (bromide) by ryegrass from well and poorly-drained soils. J Environ Qual 24:888–892
Schreiber C, Zeng B, Temperton V, Rascher U, Kazda M, Schurr U, Höltkemeier A, Kuhn A (2011) Dynamics of organic acid occurrence under flooding stress in the rhizosphere of three plant species from the water fluctuation zone of the Three Gorges Reservoir, P.R. China. Plant Soil 344:111–129 Schroth MH, Ahearn SJ, Selker JS, Istok JD (1996)
Characterization of miller-similar silica sands for laboratory hydrologic studies. Soil Sci Soc Am J 60:1331–1339 Schroth MH, Istok JD, Haggerty R (2001) In situ evaluation of
solute retardation using single-well push-pull tests. Adv
Water Resour 24:105–117
Shane MW, De Vos M, De Roock S, Lambers H (2003) Shoot P status regulates cluster-root growth and citrate exudation in Lupinus albus grown with a divided root system. Plant Cell
Environ 26:265–273
Sheppard SC, Evenden WG (1992) Response of some vegetable crops to soil-applied halides. Can J Soil Sci 72:555–567 Simunek J, Jarvis NJ, van Genuchten MT, Gardenas A (2003)
Review and comparison of models for describing non-equilibrium and preferential flow and transport in the vadose zone. J Hydrol 272:14–35
Tandy S, Schulin R, Nowack B (2006) The influence of EDDS on the uptake of heavy metals in hydroponically grown
sun-flowers. Chemosphere 62:1454–1463
Tandy S, Brittain S, Grail B, McLeod C, Paterson E, Tomos AD (2013) Fine scale measurement and mapping of uranium in soil solution in soil and plant-soil microcosms, with special
reference to depleted uranium. Plant Soil. doi:10.1007/ s11104-11012-11526-11107
Tidwell VC, Glass RJ (1994) X-ray and visible-light transmission for laboratory measurement of 2-dimensional saturation fields in thin-slab systems. Water Resour Res 30:2873–2882 van Hees PAW, Jones DL, Godbold DL (2003) Biodegradation of low molecular weight organic acids in a limed forest soil. Water Air Soil Pollut Focus 3:121–144
Vetterlein D, Jahn R (2004) Gradients in soil solution composition
between bulk soil and rhizosphere—in situ measurement
with changing soil water content. Plant Soil 258:307–317 Vetterlein D, Marschner H, Horn R (1993) Microtensiometer
technique for insitu measurement of soil matric potential and root water extraction from a sandy soil. Plant Soil 149: 263–273
Watt M, Evans JR (1999a) Linking development and determinacy with organic acid efflux from proteoid roots of white lupin grown with low phosphorus and ambient or elevated atmo-spheric CO2concentration. Plant Physiol 120:705–716 Watt M, Evans JR (1999b) Proteoid roots. Physiology and
devel-opment. Plant Physiol 121:317–323
Weisskopf L, Abou-Mansour E, Fromin N, Tomasi N, Santelia D, Edelkott I, Neumann G, Aragno M, Tabacchi R, Martinoia E (2006) White lupin has devel-oped a complex strategy to limit microbial degradation of secreted citrate required for phosphate acquisition.
Plant Cell Environ 29:919–927
White MD, Oostrom M (2000) STOMP. Subsurface transport over multiple phases, version 2.0, Theory Guide PNNL-12030. Pacific Northwest National Laboratory, Richland