HAL Id: hal-00304925
https://hal.archives-ouvertes.fr/hal-00304925
Submitted on 1 Jan 2004HAL is a multi-disciplinary open access archive for the deposit and dissemination of sci-entific research documents, whether they are pub-lished or not. The documents may come from teaching and research institutions in France or abroad, or from public or private research centers.
L’archive ouverte pluridisciplinaire HAL, est destinée au dépôt et à la diffusion de documents scientifiques de niveau recherche, publiés ou non, émanant des établissements d’enseignement et de recherche français ou étrangers, des laboratoires publics ou privés.
of acidity for woodland habitats in Great Britain
S. J. Langan, Janet Hall, B. Reynolds, M. Broadmeadow, M. Hornung, M. S.
Cresser
To cite this version:
S. J. Langan, Janet Hall, B. Reynolds, M. Broadmeadow, M. Hornung, et al.. The development of an approach to assess critical loads of acidity for woodland habitats in Great Britain. Hydrology and Earth System Sciences Discussions, European Geosciences Union, 2004, 8 (3), pp.355-365. �hal-00304925�
The development of an approach to assess critical loads of acidity
for woodland habitats in Great Britain
S.J. Langan
1, J. Hall
2, B. Reynolds
3, M. Broadmeadow
4, M. Hornung
5and M.S. Cresser
61The Macaulay Institute, Aberdeen, AB15 8QH, UK
2Centre for Ecology and Hydrology, Monks Wood, Abbots Ripton, Huntingdon, Cambridgeshire, PE28 2LS, UK 3Centre for Ecology and Hydrology, Deiniol Road, Bangor, Gwynedd, LL57 2UP, UK
4Environmental and Human Sciences Division, Forest Research, Farnham, Surrey, GU10 4LH, UK
5Centre for Ecology and Hydrology, Lancaster Environment Centre, Library Avenue, Bailrigg, Lancaster, LA1 4AP, UK 6Environment Department, University of York Heslington, York, YO10 5DD, UK
Email for corresponding author: s.langan@macaulay.ac.uk
Abstract
Alongside other countries that are signatories to the UNECE Convention Long Range Transboundary on Air Pollution, the UK is committed to reducing the impact of air pollution on the environment. To advise and guide this policy in relation to atmospheric emissions of sulphur and nitrogen, a critical load approach has been developed. To assess the potential impact of these pollutants on woodland habitats a steady state, simple mass balance model has been parameterised. For mineral soils, a Ca:Al ratio in soil solution has been used as the critical load indicator for potential damage. For peat and organic soils critical loads have been set according to a pH criterion. Together these approaches have been used with national datasets to examine the potential scale of acidification in woodland habitats across the UK. The results can be mapped to show the spatial variability in critical loads of the three principal woodland habitat types (managed coniferous, managed broadleaved/ mixed woodland and unmanaged woodland). The results suggest that there is a wide range of critical loads. The most sensitive (lowest) critical loads are associated with managed coniferous followed by unmanaged woodland on peat soils. Calculations indicate that at steady state, acid deposition inputs reported for 19951997 result in a large proportion of all the woodland habitats identified receiving deposition loads in excess of their critical load; i.e. critical loads are exceeded. These are discussed in relation to future modelled depositions for 2010. Whilst significant widespread negative impacts of such deposition on UK woodland habitats have not been reported, the work serves to illustrate that if acid deposition inputs were maintained and projected emissions reductions not achieved, the long-term sustainability of large areas of woodland in the UK could be compromised.
Keywords: critical loads, acid deposition, acidification, woodland, simple mass balance model, sustainability
Introduction
The role of emissions of acidifying atmospheric pollutants such as sulphur dioxide, nitrogen oxides and ammonia in the acidification of both terrestrial and aquatic ecosystems has long been recognised. A recent review of these impacts is given in the NEGTAP report (DEFRA, 2001). Since the 1980s, policy development has attempted to reduce the emissions of acidifying pollutants across the UK and Europe by focussing on the implementation of emission control protocols such as the Large Combustion Plant Directive (DEFRA, 2001). In Europe, reductions have been agreed as part of the Gothenburg Protocol in 1999, which targets
emissions reductions for sulphur dioxide, nitrogen oxides and ammonia of 75%, 50% and 12%, respectively, by 2010 relative to the 1990 baseline. Increasingly, such policies have required an effects-based approach to proposing solutions for environmental problems and implementing emissions reductions in a targeted and cost-effective way. From this background, the development of a critical loads approach has dominated acidification research since the late 1980s. A critical load is defined as a quantitative estimate of the exposure to one or more pollutants below which significant harmful effects on specified sensitive elements of the environment do not occur according to present knowledge
(Nilsson and Grennfelt, 1988). Where the critical load for an ecosystem is exceeded by inputs of acidifying pollutants (critical load exceedance), ecosystem damage may occur, but over an unspecified timescale. Comparison of critical loads with inputs of atmospheric pollution on a spatial basis can then be used to predict the ecosystems at risk of damage. In the UK, this concept has been applied in an incremental manner that reflects developments in the available data and knowledge of the processes linking atmospheric inputs of pollutants to potential ecosystem damage through acidification. Specifically for soils and terrestrial ecosystems, the first step in the sequence of developments has been to apply an empirical approach to setting critical loads (Hornung et al., 1995). This involved assessing available national soil databases to determine soils sensitivities to acidification based on their production of base cations through chemical weathering of the soils parent materials. Different soils were categorised into classes of weathering rate proposed by Nilsson and Grennfelt (1988). Further work to assess the applicability and potential uncertainties in using such an approach have been reported by Langan et al. (1995) and Hodson and Langan (1999). More recently, the concept has been developed to consider ecosystem specific responses through use of a steady state simple mass balance (SMB) model in which the major sources and sinks of acidity are accounted for. Other papers have reported on the generalised methodology (Posch et al., 1999) and the uncertainties of the approach (Hall et al., 2001; Kennedy et al., 2001).
This paper describes the development of the approach for woodland habitats and discusses the results in terms of sustainability issues for UK forestry and woodland management. The work described is being used, in part, to guide policy on emission abatement policies at both the UK and European level.
Methods
MAPPING WOODLAND AREAS
To map the spatial variability in critical loads for UK woodland types, the areas covered by different types of woodland across the UK have to be delineated. This has been achieved by using the broad woodland habitats as being developed for Biodiversity Action Plans (BAP). The UK BAP identifies two woodland Broad Habitats: broadleaved, mixed and yew woodland and coniferous woodland. Both managed and unmanaged woodlands are included in critical loads assessment, since the long-term protection of the whole ecosystem function (i.e. soils and trees) is important. A single woodland cover map compatible with critical loads
exceedance mapping for other land covers (Hall et al., 2003) has been developed by combining three data-sets describing woodland distribution and management. Woodland cover was identified as coniferous or broadleaved and mixed according to the National Inventory of Woodland and Trees (NIWT: FC, 2003). A distinction between managed and unmanaged woodland was then made on the basis of inclusion within the Ancient and Semi-Natural Woodland Inventory (ASNWI) of English Nature, the Countryside Council for Wales and Scottish Natural Heritage. Plantation Ancient Woodland Sites (PAWS) within the ASNWI were treated as exceptions and assumed to be managed. The two unmanaged woodland categories (coniferous and broadleaved) were then combined, resulting in the three woodland habitats used for critical load mapping managed coniferous, managed broadleaved and mixed, and unmanaged. Significant discrepancies are apparent between land mapped as woodland using the approach described above and woodland cover from either LCM2000 or NIWT individually. These discrepancies are likely to have resulted from differences in definition, resolution, survey approach and interpretation. To ensure compatibility with critical load mapping to other land-uses which is carried out on the basis of the Landcover Map 2000 (LCM2000: Fuller et al., 2002), total land cover for any 1 × 1 km grid-square cannot exceed 100%. Grid-squares which included woodland in only the derived woodland cover map were therefore excluded. Total woodland cover was then assumed to be that given in LCM2000 for each grid-square, with the proportion of each of the three woodland habitats provided by the derived woodland cover map. It should be noted that this approach results in a significant underestimate of total woodland cover compared with NIWT, even when bare ground, open space and clearfell are excluded. This underestimate amounts to some 25% of woodland cover, and demonstrates the difficulty of combining large-scale inventories. Although total woodland cover may be underestimated, significantly, the approach does provide a spatial representation of generic woodland habitat which is essential if the impact of management on the ability of woodland ecosystems to cope with acid inputs is to be assessed.
CALCULATION OF CRITICAL LOADS
For the calculation of critical loads for these habitats, the Simple Mass Balance (SMB) equation has been used. A steady-state approach is applied in which the temporal variation in deposition and subsequent ecosystem response are not accounted for. In this sense, the approach gives a snap-shot of conditions under ambient deposition inputs. This method has been widely used within Europe to calculate
steady state critical loads of acidity for a range of ecosystems (Posch et al., 2002). In this method, the differing sensitivities of ecosystems are incorporated by varying the critical load criteria, such as pH or the base cation (BC) (or calcium) to aluminium ratio in soil solution. The critical load (CL) is set to avoid violation of a set value of the criteria. In its simplest form, critical loads derived from the SMB are expressed as:
CLAcidity = BCDeposition + BCWeathering BCUptake ANCleaching
(1) Within this basic formulation of the critical load calculation, deposition inputs (BCDeposition) are not an attribute of an
ecosystem but relate to geographical location and mapped pollutant input. However, deposition maps do include a representation of land-cover and the enhanced scavenging of atmospheric pollutants by woodland (Fowler et al., 1989) is thus accounted for, although the difference in deposition velocity between broadleaved and coniferous woodland is not. The BCWeathering term is determined by the nature of the
soil parent material, and its derivation and application to GB empirical critical load mapping is detailed in Hornung et al., (1995). The base cation demand from vegetation (BCUptake) is dependent on tree species and the nature of
woodland management as discussed below, and summarised in Table 1. ANCleaching is the critical leaching of acid
neutralising capacity.
To account for variation in BCUptake through uptake during
tree growth and removal loss during harvesting and thinning operations, separate values for BCuptake have been calculated
for managed broadleaved (representing the broadleaved and mixed woodland habitat) and coniferous woodland based on site-specific measurements made at the ten UNECE Intensive Forest Health monitoring sites (Level II) in the UK operated by Forest Research between 1995 and the present (Durrant, 2000; De Vries et al., 2003). These plots consist of stands of oak, Scots pine and Sitka spruce with standard local management practices employed. The plots vary in planting year between 1920 and 1974 and cover a range of production classes (general yield class: GYC) from
4 to 22 m3 ha1 yr1. The minimum plot size is 0.3 ha,
including a 0.1 ha mensuration plot providing growth data. Further details of measurements carried out are given in Durrant (2000), with the principal attributes of each site summarised in Table 2.
Base cation uptake is estimated for each plot as the product of the concentration of base cations in the wood and biomass taken off site at harvest, calculated from average volume increment and wood density. Estimates of uptake are made separately for bark and wood, enabling the different chemical composition of the two components to be accounted for. All calculations use the same equation: Loss from site = average volume * basic wood *
increment density
(keq ha1 year1) (m3 ha1 year1) (g m3)
concentration in wood (keq g1)
Cumulative volume production including yield from thinnings is predicted from forest yield tables (Edwards and Christie, 1981), using mensuration data to identify the productivity class of each plot. Rotation length is based on felling at maximum mean annual increment (MAI) for the two coniferous species. In the case of oak, the rotation is extended beyond maximum MAI to 120 or 140 years to reflect current practice. Overbark (i.e. including bark) volumes (as given in the yield tables) are converted to underbark volumes using industry-accepted, species specific conversion factors (Hamilton, 1975) providing separate estimates of wood and bark volumes.
The three oak plots are thinned, while of the coniferous species, Sitka spruce is unthinned, and Scots pine thinned. The management regime applied to each species reflects a broad generalisation of forestry practice in the UK in which stands are thinned where possible to enhance the commercial value of the crop. A management regime of regular thinning is generally applied to Scots pine, while Sitka spruce is often unthinned as a result of the high risk of windthrow and windsnap in the uplands where it has traditionally been planted. The mean BCuptake values of the three broadleaved
and seven coniferous plots were then taken as representative for their respective forest categories, although no scaling was applied to reflect the relative contribution of the two coniferous species to the Forest Enterprise (FE) forest estate. However, Sitka spruce contributes some 55% to FE coniferous woodland. Thus the proportion of Scots pine to Sitka spruce across the Level II network (57% Sitka spruce) is broadly in line with the breakdown of species at a national
Table 1. Base cation and calcium uptake values for managed
coniferous and broadleaved woodland (figures in keq ha-1 yr-1).
Woodland type Base cation uptake Calcium uptake
Coniferous 0.27 0.16 Broadleaved Ca-rich soils 0.41 0.29 Broadleaved Ca-poor soils 0.315 0.195
level if Scots pine is assumed to represent all other coniferous species. The mean yield class of the two managed woodland categories (5.0 m3 ha1 yr1 broadleaved and mixed
and 15.8 m3 ha-1 yr-1 coniferous) in the Level II network are
higher than the average for the 0.9 Mha of the FE estate (3.2 and 11.6 m3 ha1 yr1 respectively), and thus uptake
values have been scaled accordingly. Data from the private sector are not available, and thus estimates of productivity at a national level are based solely on the FE sub-compartment data-base.
Species specific densities for wood and bark (Lavers, 1969; Hamilton, 1975) are used to calculate biomass. For broadleaved species, branch biomass is calculated additionally, accounting for small diameter timber taken off site for pulp and firewood.
Site-specific measured stemwood and bark nutrient concentrations together with published values of branch nutrient concentrations (Allen et al., 1974: for oak only) are then used to estimate total quantities of BC and Ca taken off site during the rotation, assuming conventional clear-fell and thinning practice. Uptake is assumed to occur at a constant rate over the course of the rotation.
In the case of Ca and BC uptake by the broadleaved and mixed woodland habitat, two of the oak sites are taken to represent calcium-rich soils, and one a calcium-poor soil. This distinction could not be made for the managed coniferous category as all these sites within the Level II network are classed as calcium-poor, largely reflecting the distribution of coniferous woodland in the UK.
For woodlands growing on mineral soils, the ANCleaching
term can be calculated by defining fluxes in relation to base cations or calcium to aluminium ratio (BC/Al or Ca/Al) respectively. Sverdrup and Warfvinge (1993) proposed a range of BC/Al ratios for different species, including trees and other ecosystems that could be extrapolated from the
studies reviewed by the authors. Cronan and Grigal (1995) critically reviewed the research base existing at that time and indicated that, for forest ecosystems, a molar ratio for Ca:Al of 1 in soil solution would result in a 50% chance of a negative impact on tree growth or nutrition. In the work reported here, a critical Ca:Al ratio of 1 has been used for all woodland habitats on mineral soils.
For woodlands growing on soils with an organic topsoil (>30 cm) overlying mineral or peat soils (>50 cm depth), a critical pH criterion has been used. For habitats associated with organic topsoils a critical pH of 4.0 has been adopted. At a European scale, UBA (1996) propose that this value equates to a critical aluminium concentration of 0.2 eq m3
which, they suggest, is damaging to forest functioning. A pH of 4.0 is also stated by Hettlingh et al., (1991) to represent the point at which the functioning of forest ecosystems is compromised, while Sverdrup (pers. comm.) suggests that plant uptake mechanisms are affected below this value. For ecosystems associated with deep peat soils, a critical pH of 4.4 has been used. The precise relationship between this value and forest ecosystem response is less clear than for mineral soils and is more difficult to support from the published literature. However, Skiba and Cresser (1989), Proctor and Maltby (1998) and Calver et al. (2003) have shown non-forest ecosystem functioning in peat soils to be adversely affected at pH levels lower than this. Furthermore, this is the default value recommended in the UNECE Mapping Manual (UBA, 1996) and can be viewed as a precautionary approach to setting a chemical criterion for protecting against adverse biological impacts.
Acid deposition inputs comprise of SOx, NOx and NHx.
Information on the spatial and temporal variation in these pollutants is collected as part of the national acid deposition network. Details of how these deposition inputs vary, together with an indication of the temporal and spatial
Table 2. Principal attributes of the ten UK Intensive Forest Condition Monitoring (Level II) sites on which estimates of BCuptake are made.
Site Grid Elevation Species Planting Planting GYC/ LYC Basal area
reference (m) year spacing (m) (m2 ha-1)
Alice Holt SU790400 80 Oak 1935 1.4 × 1.1 6 22.0 Savernake SU050880 107Oak 1950 1.0 × 1.76/4 20.0 Grizedale SD330910 115 Oak 1920 1.4 × 1.1 4/4 20.0 Thetford TL950830 20 Scots pine 19671.7 × 1.8 12/10 36.6 Sherwood SK160900 265 Scots pine 1952 1.0 × 1.2 12/9 39.3 Rannoch NN600530 470 Scots pine 1965 1.4 x 2.0 8/9 32.8 Coalburn NY690780 300 Sitka spruce 1974 1.8 x 2.2 18/18 47.1 Tummel NN740610 400 Sitka spruce 1969 1.6 × 1.8 16/1759.2 Loch Awe NM960100 40 Sitka spruce 1971 2.0 x 2.4 24/24 55.0 Llyn Brianne SN810480 450 Sitka spruce 1973 2.1 × 2.1 14/14 47.3
patterns of BCdeposition are described in DEFRA (2001).
MAPPING CRITICAL LOADS
Using the national data sets described above, the SMB equation was solved for each 1 km grid square based on the dominant soil and woodland habitat type in each square. The soil, vegetation, deposition and environmental data-sets have been established in a national critical load database and supporting Geographic Information System at CEH, Monks Wood. For mapping purposes, critical loads are represented in five classes ranging from the most sensitive class (< 0.2 keq H+ ha1 yr1) through to the least sensitive
(> 4.0 keq H+ ha1 yr1; the intervening class intervals are
0.20.5, 0.51.0 and 1.0 to 2.0 keq H+ ha1 yr1). To calculate
areas of critical load exceedance, deposition inputs have been compared to the critical load, using deposition data available at a 5 km grid basis and assuming it is constant across each grid area. Exceedance is mapped using the same categories as used for the critical loads. Critical load exceedances have been calculated using two deposition data sets: 199597 and 2010. The 2010 data are derived from the FRAME model (Dore et al., 2003), whilst the data for 199597 are based on a combination of measured and modelled data. In summary, the deposition data indicate a pollution gradient with the lowest inputs occurring in north and west Scotland. The highest input loadings occur across the Pennine hills extending into east Yorkshire, East Anglia, London and smaller areas of south-west England and south Wales. These areas reflect a combination of large inputs from power production, heavy industry, traffic movement and agriculture. Between 199597 and the forecast deposition for 2010 (based on the National Emissions Ceiling Directive) acid deposition shows a significant decline in inputs across much of the country (see DEFRA, 2001; Dore et al., 2003 for further details).
Results
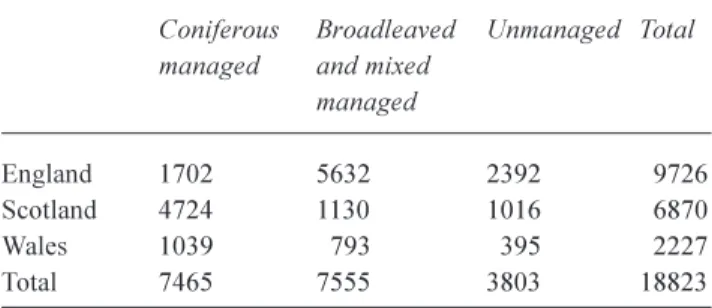
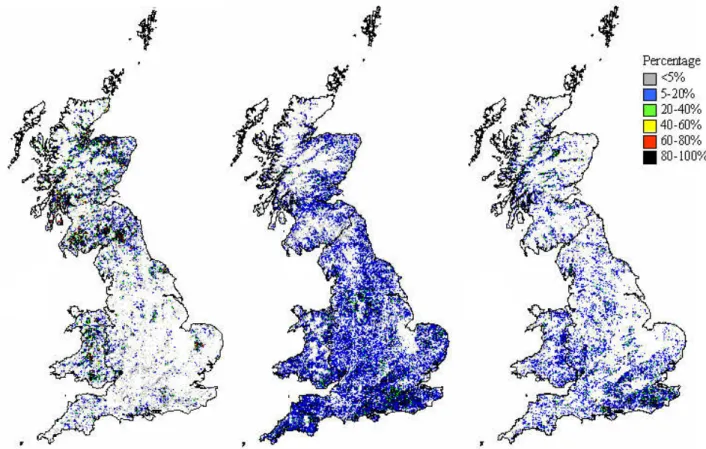
Figure 1 shows the distribution of the different woodland habitats in Great Britain. In total, these woodland habitats account for approximately 18823 km2 (8%) of the land area
and comprise 7465 km2 of managed coniferous woodland,
7555 km2 of managed broadleaved and mixed woodland
and 3803 km2 of unmanaged woodland. Details of the areas
of these woodlands on a country by country basis are given in Table 3. English woodlands are dominated (~58%) by managed broadleaved and mixed habitats, with the managed coniferous category contributing only 18%. In contrast, managed coniferous woodland is the major habitat type for Scotland and Wales (Fig. 1a) where it predominates on the
more base-poor and organic-rich soils of the uplands. The largest concentrations of this habitat occur in the North Yorkshire Moors, Mid Wales, the Scottish Borders and the Highlands. Other notable concentrations are on lowland sandy soils such as are found in East Anglia around Thetford and the Moray coastal plain in north-east Scotland. The distribution of managed broadleaved woodland (Fig. 1b) tends to favour less extreme environmental conditions with a relatively limited distribution in upland areas. Whilst there are no national clusters of high concentrations of this habitat, it is a widespread and a particularly common habitat in south-east England and, to a lesser extent, in south-west England. The distribution of unmanaged woodlands (Fig. 1c) shows a similar widespread distribution to the managed broadleaved woodlands although with a lower occurrence of this type of habitat.
Figure 2 shows the distribution of the three soil types (that are the dominant soil in each 1 km square) used to determine the different critical load criteria described in the methods section. Mineral soils show the most widespread distribution across England, Wales and eastern Scotland. Mineral soils with a deep organic top soil predominate in the western upland areas, most noticeably in Scotland and mid-Wales. There are smaller scattered distributions in England, largely on the lower hills flanking the Pennines, the Lake District, North Yorkshire and south-west England. In mid-Wales and on the ScotlandEngland border these soils are commonly under large-scale plantation forestry. Organic peat soils are more restricted in occurrence being confined largely to flat areas commonly in upland areas with large rainfall inputs. The largest expanses occur in the Outer Hebrides, northern Scotland, south-west Scotland and the Pennines. Smaller areas exist in mid-Wales.
The mean and respective ranges of critical loads together with the relative areas of the combinations of soil and habitat types are presented in Table 4. The data show the predominance of managed broadleaved and mixed and unmanaged woodland habitat on mineral soils and to a lesser extent managed coniferous habitat. Peat soils have a
Table 3. Areal coverages (km2) of woodland habitat type across
Great Britain
Coniferous Broadleaved Unmanaged Total managed and mixed
managed
England 1702 5632 2392 9726 Scotland 4724 1130 1016 6870 Wales 1039 793 395 2227 Total 7465 7555 3803 18823
Fig. 1. The distribution of three woodland habitats in Great Britain:(a) managed coniferous woodland, (b) managed broadleaved and mixed
woodland, (c) unmanaged woodland.
Fig. 2. The distribution of mineral soils, organic top soils and peat
soils for which the different critical load criteria were used (see text and Table 4).
significantly smaller spatial extent than mineral or organic top soils for all three habitat types. The critical loads show a considerable range between soil and habitat types. The highest critical loads are for all habitat types occurring on mineral soils. The most acid sensitive woodland habitats are those of managed coniferous woodland on peat soils, followed by unmanaged woodlands on peat soils.
Figure 3 illustrates the distribution of critical loads derived from the SMB equation for each of the woodland habitats. The sensitivity and distribution of managed coniferous habitats largely reflects the dominance of acid soils in areas in which productive plantations of managed forests occur in Great Britain. The same argument, although to a lesser extent, holds for managed broadleaved and mixed woodland, for which agriculturally marginal and less productive soils and steep topography are used to establish a wider variety of tree species comprising this habitat type. Taking these two habitats together suggests that a significant proportion of managed woodlands is sensitive to acidification through inputs of acid deposition and their base cation growth uptake requirements.
The extent of critical load exceedance for the three woodland habitats is given in Table 5, suggesting that for the majority of woodland in Great Britain (71%), the
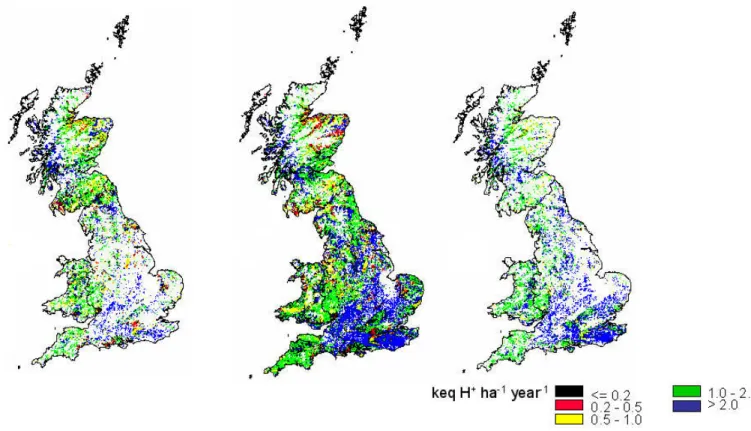
1995-97 acid deposition inputs exceed the critical load. The largest area of exceedance is for managed woodland; in contrast, the proportion of unmanaged woodland habitats exceeding the critical load for acidity is significantly smaller. Table 5 also breaks down the exceedance statistics by habitat type and geographical location, with a spatial representation given in Figs. 4 and 5. Projections for 2010, based on proposed emissions control measures being adopted, suggest that a smaller area (~46%) of the habitats will exceed the critical load for acidity as a result of lower pollutant inputs.
Figure 4 suggests that deposition inputs at 199597 levels were sufficient to result in the widespread exceedance of critical loads for large areas of woodlands across Great Britain. The areas in which the highest levels of exceedance (> 1 keq ha1 yr1, illustrated by the red and black colour
categories in Fig. 4) predominate across many of the upland areas of Great Britain. In addition, the managed woodlands of East Anglia, show high levels of exceedance. When expressed by country, England has the largest area of woodland at risk of exceedance, although in relative terms,
Table 4. Detail of critical loads for woodland habitatsoil combinations for Great Britain.
Habitat Soil type Criteria Area Critical load values (keq ha1 yr1)
km2 % Min Max Mean
managed coniferous mineral Ca:Al = 1 3469 46.5 0.1 11.6 2.1
organic pH 4.0 3146 42.1 0.3 6.5 1.7
peat pH 4.4 849 11.4 0.1 4 1.3
managed broadleaved mineral Ca:Al = 1 7106 94.1 0.1 11.72.9
organic pH 4.0 346 4.6 0.2 6.3 1.6
peat pH 4.4 102 1.4 0.1 4 2.4
unmanaged woodland mineral Ca:Al = 1 3361 88.4 0.4 12.1 1.9
organic pH 4.0 42711.2 0.3 5.8 1.8
peat pH 4.4 15 0.4 0.2 4 1.6
Fig. 3. Critical loads of acidity for three woodland habitats: (a) managed coniferous woodland, (b) managed broadleaved and mixed woodland,
Fig. 5. Critical load exceedance using modelled total acid deposition data for 2010, for: (a) managed coniferous woodland, (b) managed
broadleaved and mixed woodland and (c) unmanaged woodland.
Fig. 4. Critical load exceedance for managed coniferous woodland by total acid deposition for 1995-97, for: (a) managed coniferous
Table 5. Critical load exceedance (km2 / %) by country and woodland habitat type calculated using deposition data for 1995-97
and predicted modelled data for 2010.
AREAANDPERCENTAGEOFHABITATEXCEEDED
Managed coniferous Managed broadleaved Unmanaged woodland Total
1995-972010 1995-972010 1995-972010 1995-972010 England 1463 (86.0) 1047 (61.5) 4150 (73.7) 2996 (53.2) 1533 (64.1) 869 (36.3) 7146 (73.5) 4912 (50.5) Scotland 3025 (64.1) 1649 (34.9) 748 (66.2) 472 (41.8) 433 (42.6) 140 (13.8) 4206 (61.2) 2261 (32.9) Wales 1011 (97.3) 657 (63.3) 709 (89.4) 530 (66.9) 350 (88.6) 249 (62.9) 2070 (93.0) 1436 (64.5) Total 5499 (73.7) 3353 (44.9) 5607 (74.2) 3998 (52.9) 2316 (61.0) 1258 (33.1) 13422 (71.3) 8609 (45.7)
the situation is more serious in Wales where 93% of woodland habitat is exceeded. There are two major regions of Great Britain where exceedance is more limited: (i) central-south England running from Bristol eastwards to Suffolk/Kent and north-east to Lincolnshire and Humberside; (ii) the north-west Highlands of Scotland. For the north-west Highlands this is due to lower pollutant inputs. In contrast, the region of England with no or low exceedance largely reflects their higher critical loads resulting from the ability of soils in these areas to buffer inputs of atmospheric acidity through the release of base cations as a product of chemical weathering in the soil.
Figure 5 shows that exceedances using projected deposition for 2010 are reduced in many areas in comparison to 199597, with few 1 km × 1 km grid-squares remaining in the category of highest exceedance. Clusters of exceedance are still apparent for combinations of high deposition and sensitive soil/ecosystems such as found in parts of Wales, the Welsh borders and south-west Scotland. Comparison with Fig. 4 indicates that the relative change in deposition will give rise to exceedance being reduced for much of Scotland and eastern England, particularly for unmanaged woodland habitats. Table 5 indicates that the area of woodland exceeded in Great Britain in 2010 is predicted to be 46%, compared to ~71% in 199597. The largest reductions are for unmanaged woodlands (61to 33%), particularly in Scotland.
Discussion and conclusions
When using critical loads and exceedance as an indication of habitat at risk from inputs of atmospheric acidity, it is apparent that acid deposition provides a potential threat to the long term sustainability of woodland ecosystems in Great Britain. For Wales, the suggestion is that for all of the three woodland habitats identified, ecosystem condition could be compromised if such levels of deposition were maintained. For England and Scotland, the potential for damage is less, as a proportion of woodland habitat, than for Wales. In terms
of total habitat extent, negative impacts on managed coniferous woodland will potentially be the largest in Scotland, whereas for managed broadleaved and mixed and unmanaged woodland, the potential for damage is largest in England. This situation is a worse case scenario and the scale of such negative impacts is unlikely as the SMB from which the mapped critical loads and exceedance are calculated assumes steady state conditions. It is, however, unlikely that steady state conditions will be reached. Most of the UK is showing a downward trend in acid deposition (DEFRA, 2001), and the potential impact of this on woodland critical load exceedance for acidity has been examined using the projected deposition data for 2010. This has illustrated that if the National Emissions Ceilings Directive is reached there will be a reduction in the exceedance of critical loads.
In addition to the long-term buffering provided by chemical weathering in soils, there is the potential for cation exchange processes to buffer acid inputs over many decades. Consequently steady state conditions are not reached. Equally there will be areas in which the habitat is highly sensitive such that pollutant deposition will always be greater than the critical load and acidification will occur. A further complicating factor in this respect is the deposition of nitrogen, which is often a limiting nutrient in some ecosystems. Addition of nitrogen in these situations will lead to higher rates of tree growth and further add to the risk of depletion of the soil base cation store. These situations will require careful management and possibly the implementation of ameliorative measures to maintain productive woodland. To assist in the testing of such scenarios of varying deposition inputs and land management practices it is necessary to develop and validate dynamic bio-geochemical models.
It should also be noted that significant or widespread damage to forestry systems has not been observed in the UK, when measured using indices of productivity or crown condition. Many production forests are planted on acidic upland soils where climatic factors or nutrient availability
are the primary limiting factors to productivity (Moffat, 2003). The application of rock phosphate as part of good forestry management practice (Taylor, 1991) may provide an additional buffer and therefore reduce managed woodland habitat sensitivity to acidification. In the long-term, continuing acidic inputs could result in reduced productivity on mineral soils as a result of aluminium toxicity (Vanguelova et al., 2004) or the development of nutrient imbalances or deficiencies, particularly of base cations. While there is some information on the potential impact of low pH on non-forest ecosystems developed on organic and peaty soils, the published evidence is less clear for woodlands developed on such soils. There is an urgent need for further research to identify the nature of the link between change in chemical criteria (pH) and biological response.
Although the condition and productivity of British forests does not appear to have been affected by acid deposition to date, critical loads have been established to protect the wider forest ecosystem and not trees in isolation. Soil acidification is well known to affect soil microflora together with the fauna and flora associated with woodland (see DEFRA, 2001), and it is these elements of woodland, particularly in ancient and semi-natural woodlands (which are often managed for their biodiversity rather than timber production) which are more immediately at risk. It is, thus, important to identify the specific types of receptors within woodlands which critical loads are set to protect. Furthermore, as this work has illustrated, with reductions in acid deposition inputs there is the potential for improvement in the chemical criteria on which critical load exceedances are based. However, this does not answer the question as to whether biological recovery will follow and over what time period. Applications of steady state critical load models to national environmental data-sets can assess and identify areas sensitive to acidification at the national scale. These data could be used to provide a preliminary screening of vulnerable ecosystems or areas for more detailed investigation in relation to specific requirements. Because a steady state model has been used, there is no information concerning the timescale over which such impacts might be observed; this would require a dynamic modelling approach. However, the value of the simple, steady state approach is that data requirements are limited and national and regional assessments can be made with relative ease. Such assessments provide a screening for more intensive study in areas deemed at risk from acid deposition impacts. To optimise this screening process, it is imperative that an ongoing review of methods is in place as new data/ knowledge become available and that consistency is maintained between this approach and the application of more complex, dynamic models.
Acknowledgement
The authors gratefully acknowledge the financial support of the UK, Air Quality Division of the Department of the Environment for funding this research. The views expressed, however, are totally those of the authors.
References
Allen, S.E., Grimshaw, M., Parkinson, J.A. and Quarmby, C., 1974.
Chemical analysis of ecological materials. Blackwell Scientific
Publications, Oxford, UK.
Calver, L.J., Cresser, M.S. and Smart, R.P., 2004. Tolerance of Callunavulgaris and peatland plant communities to sulphuric acid deposition. Chemistry and Ecology, 20, 309320. Cronan, C.S. and Grigal, D.F., 1995. Use of calcium/aluminium
rations as indicators of stress in forest ecosystems. J. Environ.
Qual., 24, 209226.
DEFRA, 2001. National Expert Group on Transboundary Air Pollution: Acidification, Eutrophication and Ground-Level
Ozone in the UK. Report to Department for the Environment,
Food and Rural Affairs, Ashdown House, London SW1E 6DE. ISBN 1 870393 61 9.
DeVries, W., Reinds G.J., Posch, M, Sanz, M.J., Krause, G.H.M., Catayud, V., Renaud, J.P., Dupouey, J.L., Sterba, H., Vel, E.M., Dobbertin, M., Gundersen, P. and Voogd, J.C.H. (Eds.), 2003. Forest Intensive Monitoring Co-ordinating Institute. EC-UNECE, Brussels, Geneva, Switzerland.
Dore, A., Heywood, E., Vieno, M., Fournier, N., Smith, R., Weston, K., Hall, J. and Sutton, M., 2003. Modelling the transport and
deposition of sulphur and reduced and oxidised nitrogen in the UK. Status Report to DEFRA as a contribution to Long Range
Transport of Pollutants in the UK, July 2003.
Durrant, D., 2000. Environmental monitoring in British forests. Information Note 37. Forestry Commission, Edinburgh, UK.. Edwards, P.N. and Christie, T.M., 1981. Yield models for forest
management. Booklet No. 48. Forestry Commission, Edinburgh,
UK.
FC., 2003. National inventory of woodland and trees: Wales. Inventory Report. Forestry Commission, Edinburgh, UK. Fowler, D., Cape, J.N. and Unsworth, M.H., 1989. Deposition of
atmospheric pollutants on forests. Phil. Trans. Royal Soc., Lond.
B 324, 247265.
Fuller, R.M., Smith, G.M., Sanderson, J.M., Hill, R.A. and Thomson, A.G., 2002. The UK Land Cover Map 2000: construction of a parcel-based vector map from satellite images.
Cartographic J., 39, 1525.
Hall, J., Hornung, M., Kennedy, F., Langan, S., Reynolds, B. and Aherne, J., 2001. Investigating the uncertainties in the Simple Mass Balance equation for acidity critical loads for terrestrial ecosystems. Water Air Soil Pollut.: Focus 1, 4356.
Hall, J., Ullyett, J., Heywood, L., Broughton, R., Fawehinmi, J. and 31 UK experts., 2003. Status of UK critical loads: Critical
loads methods, data and maps. February 2003. Report to Defra
(Contract EPG 1/3/185). http://critloads.ceh.ac.uk
Hamilton, G.L., 1975. Forest Mensuration Handbook. Forestry Commission Booklet 39. HMSO, London, UK.
Hettelingh, J.-P., de Vries, W., Schoepp, W., Downing, R.J. and de Smet, P.A.M., 1991. Methods and Data. In: Mapping critical
loads for Europe, CCE Technical report No. 1, 1991, Jean-Paul
Hettelingh, Robert J Downing and Peter A.M. de Smet (Eds.), National Institute of Public Health and the Environment, Bilthoven, the Netherlands.
Hodson, M.E. and Langan, S.J., 1999. Consideration of uncertainty in setting critical loads: the role of weathering rate determination.
Environ. Pollut., 106, 7381.
Hornung, M., Bull, K., Cresser, M., Hall, J., Langan, S., Loveland, P. and Smith, C., 1995. An empirical map of critical loads for soils in Great Britain. Environ. Pollut., 90, 301310. Kennedy, F., Rowell, D., Moffat, A.J. and Singh, B., 2001. An
analysis of the structure of the simple mass balance equation: implications for testing national critical loads maps. Water Air
Soil Pollut.: Focus 1, 281298.
Langan, S.J., Sverdrup, H.U. and Coull, M., 1995. The calculation of base cation release from the chemical weathering of Scottish soils using the PROFILE model. Water Air Soil Pollut., 85, 24972502.
Lavers, G.M., 1969. The strength properties of timbers. Forest Products Research Bulletin No. 50. HMSO, London, UK. Moffat A.J., 2003. The state of British forests at the beginning of
the 21st century. Int. Forestry Rev., 4, 171183.
Nilsson, J. and Grennfelt, P., 1988. Critical loads for sulphur and
nitrogen. Report 1988:15. UNECE/Nordic Council of Ministers,
Copenhagen, Denmark
Posch, M., de Smet, P.A.M. and Hettelingh, J.-P., 1999. Critical loads and their exceedances in Europe: an overview. In:
Calculation and mapping of critical thresholds in Europe: Status report 1999, M. Posch, P.A.M. de Smet, J.-P. Hettelingh and
R.J. Downing (Eds.), Coordination Centre for Effects, National Institute for Public Health and the Environment (RIVM), Bilthoven, The Netherlands, 3-11. http://www.rivm.nl/cce
Proctor, M.C.F. and Maltby, E., 1998. Relationships between acid atmospheric deposition and the surface pH of some ombotrophic bogs in Britain. J. Ecol., 86, 329340.
Skiba, U. and Cresser, M.S., 1989. Prediction of long-term effects of rainwater acidity on peat and associated drainage water chemistry. Water Res., 23, 14771482.
Sverdrup, H. U. and Warfvinge, P., 1993, The effect of soil
acidification on the growth of trees, grass and herbs as expressed by the (Ca+Mg+K)/Al ratio. Reports in Ecology and
Environmental Engineering II, Department of Chemical Engineering, University of Lund, Sweden.
Taylor, C.M.A., 1991. Forest fertilisation in Britain. Bulletin 95. Forestry Commission, Edinburgh, UK.
UBA, 1996. Manual on methodologies and criteria for mapping
critical levels/loads and geographical areas where they are exceeded. UNECE Convention on Long-Range Transboundary
Air Pollution. Federal Environmental Agency (Umwelt-bundesamt), Berlin.
Vanguelova, E.I., Nortcliff, S., Moffat, A.J. and Kennedy, F., 2004. Morphology and nutrient status of fine roots of Scots pine (Pinus
sylvestris) as influenced by seasonal fluctuations in soil moisture