HAL Id: hal-03266586
https://hal.archives-ouvertes.fr/hal-03266586
Submitted on 21 Jun 2021HAL is a multi-disciplinary open access
archive for the deposit and dissemination of sci-entific research documents, whether they are pub-lished or not. The documents may come from teaching and research institutions in France or abroad, or from public or private research centers.
L’archive ouverte pluridisciplinaire HAL, est destinée au dépôt et à la diffusion de documents scientifiques de niveau recherche, publiés ou non, émanant des établissements d’enseignement et de recherche français ou étrangers, des laboratoires publics ou privés.
Distributed under a Creative Commons Attribution - NonCommercial - NoDerivatives| 4.0
Novel Insights into Quantitative Proteomics from an
Innovative Bottom-Up Simple Light Isotope Metabolic
(bSLIM) Labeling Data Processing Strategy
Nicolas Sénécaut, Gelio Alves, Hendrik Weisser, Laurent Lignières, Samuel
Terrier, Lilian Yang-Crosson, Pierre Poulain, Gaëlle Lelandais, Yi-Kuo Yu,
Jean-Michel Camadro
To cite this version:
Nicolas Sénécaut, Gelio Alves, Hendrik Weisser, Laurent Lignières, Samuel Terrier, et al.. Novel Insights into Quantitative Proteomics from an Innovative Bottom-Up Simple Light Isotope Metabolic (bSLIM) Labeling Data Processing Strategy. Journal of Proteome Research, American Chemical Society, 2021, 20 (3), pp.1476-1487. �10.1021/acs.jproteome.0c00478�. �hal-03266586�
ACCESS
Metrics & More Article Recommendations*
sı Supporting Information ABSTRACT: Simple light isotope metabolic labeling (SLIMlabeling) is an innovative method to quantify variations in the proteome based on an original in vivo labeling strategy. Heterotrophic cells grown in U-[12C] as the sole source of carbon synthesize U-[12C]-amino acids, which are incorporated into proteins, giving rise to U-[12C]-proteins. This results in a large increase in the intensity of the monoisotope ion of peptides and proteins, thus allowing higher identification scores and protein sequence coverage in mass spectrometry experiments. This method, initially developed for signal processing and quantification of the incorporation rate of 12C into peptides, was based on a multistep process that was difficult to implement for many laboratories. To overcome these limitations, we developed a new
theoretical background to analyze bottom-up proteomics data using SLIM-labeling (bSLIM) and established simple procedures based on open-source software, using dedicated OpenMS modules, and embedded R scripts to process the bSLIM experimental data. These new tools allow computation of both the12C abundance in peptides to follow the kinetics of protein labeling and the molar fraction of unlabeled and12C-labeled peptides in multiplexing experiments to determine the relative abundance of proteins extracted under different biological conditions. They also make it possible to consider incomplete12C labeling, such as that observed in cells with nutritional requirements for nonlabeled amino acids. These tools were validated on an experimental dataset produced using various yeast strains of Saccharomyces cerevisiae and growth conditions. The workflows are built on the implementation of appropriate calculation modules in a KNIME working environment. These new integrated tools provide a convenient framework for the wider use of the SLIM-labeling strategy.
KEYWORDS: In vivo metabolic labeling, light carbon isotope,12C, quantitative proteomics, data processing workflow, OpenMS, KNIME, yeast
■
INTRODUCTIONWe recently developed a new method to quantify protein half-lives in vivo based on an original labeling strategy, simple light isotope metabolic labeling (SLIM labeling),1derived from the pioneering work of the group of Marshall.2−4Briefly, we grew yeast cells on a synthetic medium containing glucose as the sole source of carbon (referred to as the normal carbon condition (NC): 98.93%12C, 1.07%13C) and shifted the cells to the same medium containing U-[12C]-glucose as the sole source of carbon (referred to as the12C condition: 100%12C). This allowed us to follow the incorporation of the12C-amino acids into proteins rapidly synthesized by the cells over time. SLIM labeling is, with the whole-organism heavy water labeling methodology,5,6one of the few methods that allows an integral labeling of the cellular components, without bias in functional group requirement or amino-acid composition. The SLIM-labeling strategy provides
several advantages for MS-based proteomics developments. The isotope cluster for peptides remains strictly bound to the natural monoisotopic ion, leading to a large increase in the intensity of the monoisotopic ion of peptides and proteins. This allows for better precision in the monoisotopic mass measurement, with higher identification scores and protein sequence coverage1 in mass spectrometry-based experiments. This method, initially developed for signal processing and quantifying the incorpo-ration rate of12C into peptides, was based on a multistep process
Received: June 29, 2020
Published: February 11, 2021
© 2021 The Authors. Published by
Downloaded via 78.198.29.234 on June 21, 2021 at 19:54:12 (UTC).
that was difficult to implement for many laboratories. It involved (1) extracting the intensities of isotopologues using the commercial software Progenesis QI for metabolomics, (2) aligning the“Features” files with the peptide identification files (Mascot files), (3) calculating the ratio of the monoisotope intensity to the intensity of all isotopologues (called Riso), (4) establishing the equation of the theoretical Risovalues for each peptide sequence, calculated using the MIDAs application7as a function of 12C enrichment, after determining the elemental composition of each peptide and therefore the exact number of carbons it contains, and (5) calculating the abundance of12C in each experimental peptide byfitting its experimental Risoto the closest theoretical Riso. The data were thenfiltered to eliminate outliers based on monoisotopic intensity, peptide size, and12C composition derived from the adjustment. Protein abundance was calculated on the basis of the abundance of their three most intense peptides (Top-3). The absence of an automated processing tool contributed to limiting the widespread diffusion of the method.
To overcome these limitations, we established the basis of a new theoretical background to process the experimental data in SLIM-labeling experiments and developed the appropriate procedures based on open-source resources, using, in particular, dedicated OpenMS modules8 for peptide identification in conjunction with a modified version of FeatureFinderIdentifi-cation.9This solution provides a Gaussianfit of the intensities of every isotopologue chromatographic trace (mass trace) for peptides with a validated identification, allowing extraction of the relevant information. The only experimental data required for high-quality quantification are the abundance of M0and M1, the monoisotopic ion, and the +1 isotopologue of the peptides identified with high confidence. Computation of the 12C abundance of peptides and the molar fraction of peptides from the NC and 12C conditions in multiplexing experiments is performed by implementing appropriate calculation modules in a KNIME working environment.10,11 We also present the theoretical basis for establishing appropriate filters to obtain high-quality processed data from experimental datasets. These new integrated tools provide a convenient framework that enables wider use of the bSLIM-labeling strategy.
Theoretical Basis of bSLIM-Labeling Data Processing
The isotope cluster of every peptide Pept is defined as a series of isotopologues (M0, M1, M2, ... Mn). Considering a peptide of elemental composition: CxHyNvOwSu, the isotope cluster can be described as the monoisotopic ion associated with a distribution of neutrons among the various elements present in the molecule. The intensities of the isotopologues can be estimated by the enumeration of the isotopic contributions of each element. In proteins, the elements are (12C,13C), (1H,2H), (14N,15N), (16O,17O,18O), and (32S,33S,34S,36S). Phosphorous is present only as the stable isotope31P. A classical approach combines polynomial distributions for all of the atoms in a molecule to take into account all of the possible permutations of neutrons of additional origin.12
Accordingly, the normalized intensity of the monoisotopic ion M0is given by M P X( ) i x y v w u X A i 0 , , , , C,H,N,O,S
∏
= = = (1)where P(AX) is the probability of occurrence, expressed as relative abundance, of the element X of mass number A. The normalized intensity of M1is given by the polynomial expansion
to the 13C, 2H, 15N, 17O, and 33S terms of the distribution (elements containing one extra neutron)
Ä Ç ÅÅÅÅÅ ÅÅÅÅÅ ÅÅÅÅÅ Å É Ö ÑÑÑÑÑ ÑÑÑÑÑ ÑÑÑÑÑ Ñ M i P X P X P Y ( ) ( ) ( ) X i x y v w u A i A i x y v w u Y X A i 1 C,H,N,O,S , , , , 1 1 , , , , C,H,N,O,S
∑
∏
= × × × = = − + = ≠ = (2)Although formal expressions for higher-order isotopologues have been produced,13the present method uses only the M0and M1 intensities. The developed expressions of M0 and M1are provided inSupporting File S1.
Under standard conditions,14 P(12C) = 0.9893; P(13C) = 0.0107; P(1H) = 0.999885; P(2H) = 0.000115; P(14N) = 0.99632; P(15N) = 0.00368; P(16O) = 0.99757; P(17O) = 0.00038; P(18O) = 0.00205; P(32S) = 0.9493; P(33S) = 0.0076; P(34S) = 0.0429; P(36S) = 0.0002.
The quantification of bSLIM labeling allows determination of the amount of12C present in every peptide in experiments in which the carbon isotope composition is manipulated to favor 12C incorporation. This amount is expressed as P′(12C) and the residual amount of13C as P′(13C).
For every peptide, it is possible to have experimental access to at least M0expand M
1
exp.Equations 1and2provide the theoretical values of M0and M1, with the sum of the intensity (probability) of all of the isotopologues normalized to 1.
It is therefore possible to set the equivalence
M M M M M M M M M M and n i n i 0 0exp 0 exp 1 1 exp 0 exp 1 0 1 exp 0 exp = ∑ = ∑ = > =
Equations 1and2are rearranged to set
M M x P P y P P v P P w P P u P P ( C) ( C) ( H) ( H) ( N) ( N) ( O) ( O) ( S) ( S) 1exp 0 exp 13 12 2 1 15 14 17 16 33 32 = × ′ ′ + × + × + × + × (3)
Let us define B as the sum of the terms that remain identical under the NC and12C conditions
B y P P v P P w P P u P P ( H) ( H) ( N) ( N) ( O) ( O) ( S) ( S) 2 1 15 14 17 16 33 32 = × + × + × + × Therefore M M x P P B ( C) ( C) 1exp 0 exp 13 12 = × ′ ′ + since P′( C)13 =1− ′P( C)12 then M M x P P B 1 ( C) ’( C) 1exp 0exp 12 12 = × [ − ′ ] + and P′(12C) is obtained as
P x M M x B M ( C) ( ) 12 0exp 1exp 0exp ′ = × + − × (4)
This equation makes it possible, for example, to follow the12C incorporation rate in the kinetics of SLIM labeling in vivo.
Quantitative Analysis of SLIM Labeling
When mixing given amounts of tryptic digests from the NC and 12C conditions, each peptide amount is the sum of the molar fraction of the NC peptide and the 12C peptide present in the initial samples.
Let us define the molar fractions of NC peptide (α) and the 12C peptide (1− α)
Peptexp=αPeptNC+ (1−α)Pept12C (5)
The isotope cluster of Peptexpis defined as (M0exp, M1exp, M2exp, ... Mnexp), while those of PeptNCand Pept12Care defined as (M0NC, M1NC, M2NC, ... MnNC) and (M0 12 C, M 1 12 C, M 2 12 C, ... M n 12 C), respectively, as illustrated inFigure 1.
Considering the normalized expression of M0and M1, we may write the following equalities
M M M (1 )M n i 0exp 0 exp 0 NC 0 12C α α ∑ = + − and M M M (1 )M n i 1exp 0 exp 1 NC 1 12C α α ∑ = + − Therefore M M M M M M M M M M M M (1 ) (1 ) ( ) ( ) 1 exp 0exp 1 NC 1 12C 0NC 012C 1NC 112C 112C 0NC 012C 0C 12 α α α α α α = + − + − = − + − +
The molar fractionα of nonlabeled peptide in the mixture is therefore
M M M M
M M M M M M M M
012C 1exp 0exp 112C
0exp 1NC 0exp 112C 1exp 0NC 1exp 012C
α = −
− − +
(6)
Knowing α allows us to compute the molar fraction of 12 C-labeled peptide (1− α), and the ratio
R NC 12C (1 ) α α = = −
which can be classically taken as a fold change in omics studies and analyzed as log 2(R).
Cases of Incomplete SLIM Labeling
The ideal situation described above applies only for hetero-trophic organisms for which all of the amino acids can be synthesized from a single U-[12C]-carbon source, such as U-[12C]-glucose, U-[12C]-glycerol, or U-[12C]-acetate, such as wild-type prokaryotic or eukaryotic microorganisms. However, many laboratory strains and cells of higher eukaryotes either carry mutations in genes required for the synthesis of selected amino acids or rely on exogenous essential amino acids for their growth. These amino acids must be added to the growth media and are currently not available as U-[12C]-amino acids. They will be incorporated into proteins in the NC form only. Therefore, to
Figure 1.Experimental spectra (top) of the peptide AGITVMNEIGLDPGIDHLYAVK (3+) from the protein YNR050c and the corresponding theoretical spectra (bottom), under 12C (A and D) and NC (C and F) conditions, and from the same peptide from a 1:1 mixture of total extract from the 12C and NC conditions (yeast strain S288c) (B and E).
quantify the relative abundance of the peptide originating from the NC condition and that from the 12C condition, we define a new parameter, Mi12C.max, corresponding to the maximum value of the relative intensity reached by any isotopologue under 12C-labeling conditions. To compute this parameter, the peptide sequence is split into (i) the part that may be labeled and (ii) the part that will remain nonlabeled due to the presence of NC amino acids in the growth medium. For example, in a yeast strain auxotroph for histidine, leucine, and lysine, a peptide of the sequence: TENLHQSLTGCLNDYSNAFGK will be consid-ered as (TENQSTGCNDYSNAFG) + (LHLLK), thefirst part being 100%12C-labeled under the 12C condition, whereas the second part remains NC, even under the 12C condition. To take into account both contributions to compute the Mi
12
C.max parameter, we decompose the carbon composition x of the amino acids into two fractions: Carbon-A (CA), composed of a atoms for the part of the peptide that will be fully12C-labeled in the 12C condition, and Carbon-B (CB), composed of b atoms for the part of the peptide that remains nonlabeled (thus computed as in the NC condition), with x = a + b.
Therefore M P X( ) i a b y v w u X A i 0 , , , , , C ,C ,H,N,O,SA B
∏
= = = (7) and Ä Ç ÅÅÅÅÅ ÅÅÅÅÅ ÅÅÅÅÅ ÅÅ É Ö ÑÑÑÑÑ ÑÑÑÑÑ ÑÑÑÑÑ ÑÑ M i P X P X P Y ( ) ( ) ( ) X i a b y v w u A i A i a b y v w u Y X A i 1 C ,C ,H,N,O,S , , , , , 1 1 , , , , , C ,C ,H,N,O,S A B A B∑
∏
= × × × = = − + = ≠ = (8) M0 12 C.maxand M 1 12C.maxare obtained by setting P′(12C
A) equal to 1, and P′(12CB) equal to 0.9893
The quantification of the molar fraction (α) of the peptide originating from the NC condition is therefore computed as
M M M M
M M M M M M M M
0 12C.max
1exp 0exp 112C.max
0exp 1NC 0exp 112C.max 1exp 0NC 1exp 012C.max
α = − − − + (9) Therefore P a M M a B M ( C ) ( ) 12 A 0 exp 1exp 0exp ′ = × + − ′ × (10) With B b P P B ( C ) ( C ) B 13 B 12 ′ = × ′ ′ +
However, the probability of occurrence of12C originating both from the 12C-labeled peptides and from the naturally occurring 12C from nonlabeled peptides is given by
P a P b P a b ( C)12 ( C ) ( C ) 12 A 12 B ′ = × ′ + × ′ + (11)
Further Extension of the bSLIM-Labeling Strategy. The bSLIM-labeling method described thus far takes advantage of the possibility to synthesize U-[12C]-amino acids in vivo from a single U-[12C]-source of carbon, such as glucose. It is possible to further reduce the complexity of the peptide/protein isotope clusters by combining the12C labeling with14N labeling, using a single U-[14N]-source of nitrogen, such as ammonium sulfate or another convenient compound.
The overall processing of the experimental data remains similar to that described above, except that theu P
P ( N) ( N) 15 14 × term fromeq 3is now equal to 0 when P(15N) is equal to 0 (100%14N condition).
It is therefore possible to set and process experimental data from the four different combinations of labeling: Normal Carbon/Normal Nitrogen, Normal Carbon/14N, 12C/Normal Nitrogen, and 12C/14N.
Definition of the Practical Computation Parameters
We assessed the theoretical ranges of the various parameters used to process the experimental datasets.
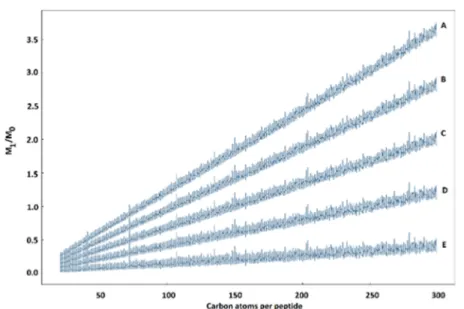
Figure 2.Relationship between the M1/M0ratios and the number of carbon atoms per peptide at various12C enrichment levels. A: 98.93%12C (NC
The relative abundance of 12C incorporated in the SLIM-labeling experiments must be in the range 0.9893≤ P′(12C)≤ 1 The molar fraction of unlabeled peptide must be in the range 0 ≤ α ≤ 1
As shown ineq 3,M
M 1exp 0
expis a linear function of the mass of the
peptide, reflected by the number of carbon atoms x and B and the contribution of the other elements in the mass of the peptide.
Figure 2shows the plot of M
M 1exp 0
exp over the number of carbon
atoms for tryptic peptides computed for various abundances of
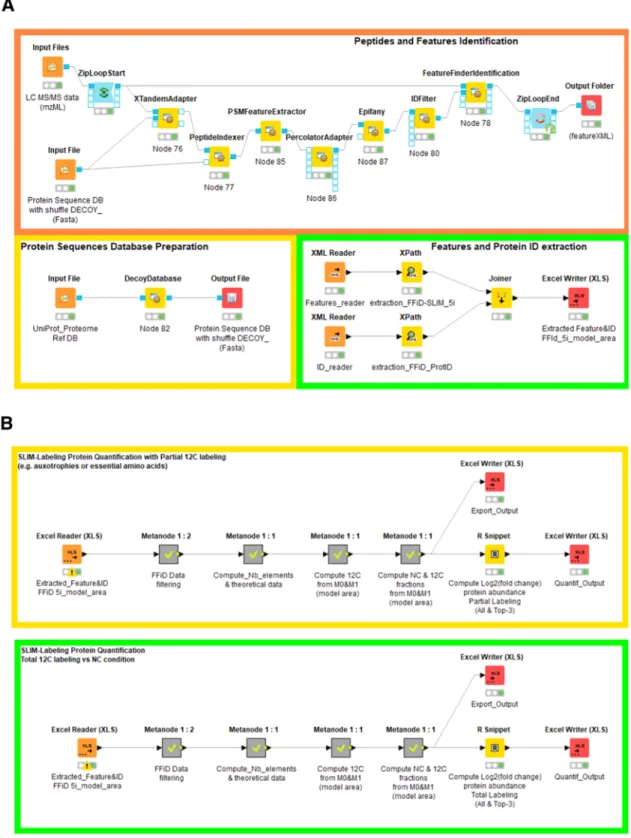
Figure 3.A. KNIME workflows for protein sequence database preparation (yellow box) for peptide identification and feature extraction (orange box) and parsing of the. featureXMLfiles and extraction of all relevant features and Protein IDs (green box). B. KNIME workflows for12C enrichment evaluation and quantitative analysis of the differential abundance of proteins in normal carbon versus 12C-labeling conditions for total labeling (green box) and partial labeling (yellow box).
total12C from the whole proteome of the yeast Saccharomyces cerevisiae, restricted to the mass range 600−6000 Da used in bottom-up proteomics experiments. This allows us to set the r a n g e o f a c c e p t a b l e e x p e r i m e n t a l M M 1exp 0 exp v a l u e s t o 0.01 M 3.6 M 1exp 0exp ≤ ≤
Implementation of the Experimental Data Processing Workflow
The workflow is composed of two distinct components for (i) peptide identification and feature extraction (Figure 3A) and (ii) computation of P′(12C) and log
2(R) (Figure 3B).
Peptide Identification and Feature Extraction. This pipeline is based on OpenMS (v2.6.0) plug-in nodes used inside the KNIME (v4.2.2) environment.
Experimental mass spectrometry .rawfiles were converted to mzMLfiles using the MS-convert tool from Proteowizard.15,16 The S. cerevisiae protein sequence database consisted of the UniProt UP000002311 reference proteome augmented with shuffled entries produced using the DecoyDatabase node of OpenMS,
In the present workflow, we use X!Tandem17as a protein sequence database search engine, with XTandemAdapter linked to the PeptideIndexer, peptide spectrum matches (PSM) Feature extractor, PercolatorAdapter, and Epifany18 for FDR filtering and IDFilter OpenMS nodes. The X!Tandem E-value threshold was set to 0.001 and FDRs were computed at 1%, both at the peptide and protein level, using the posterior error probability (PEP) scores of the peptide spectrum matches (PSMs). The resulting idXMLfile was processed, together with the initial mzML file, using a modified version of the FeatureFinderIdentification (FFId) node.9
This version allows modeling the mass trace of every isotopologue by applying a Gaussian fit (or Exponential Modified Gaussian fit) to its chromatographic elution profile. This allowed extraction of the features (height of the peak, area, and detailed statistics) offive isotopologues on every isotope cluster, associated with quality scores. These data were retrieved from the FFId outputfiles in featureXML format. We then used XPath to generate two. tsv files, one containing all of the features associated with every identification, the second containing the corresponding protein ID and accession number. To process batches of experimental files, we made use of KNIME’s ZipLoopStart and ZipLoodEnd nodes.
Computation ofP′(12C) and log
2(R). The features- and “ProtID”-containing files were joined to restore the association between the peptide and protein identifications.
We defined a first KNIME “metanode” with a series of filters to select the peptides with high-quality modeled features,flagged as “0(valid)” by FFId for M0 and M1. The other filters are database search engine-specific and can be easily edited depending on the preferred peptide identification strategy. In the present workflow, based on XTandemAdapter, we trans-formed certain post-translational modifications into a custom one-letter code: “(oxidation)” as O, “(acetyl)” as B, and “(phospho)” as Z. We included filters to remove the peptides with the“(Gln->pyro-Glu)” and “(Glu->pyro-Glu)” modifica-tions, since FeatureFinderIdentification tended to attribute the value 0 to M0 from the peptides identified with these modifications.
We also set twofilters to remove small (<800 Da) and low-intensity peptides (M0_model_area <1E6 in our experiments).
The second metanode computes the amino-acid composition of each peptide and therefore their elemental composition, including the elements present in the post-translational modifications. We used the Unimod19elemental composition of oxidation: O, acetylation: H(2)C(2)O, and phosphorylation: HO(3)P.
In cases of incomplete labeling, we introduced specific nodes to compute the number of nonlabeled residues in the peptide sequence (auxotrophies, H, L, and K in the example above) and the number of carbon atoms associated with these residues. As described above, these atoms are therefore referred to as Carbon-B (CB) in the rest of the“partial labeling workflow”. The settings can be easily modified in the configuration dialog box associated with these nodes to adjust for the actual experiments. The elemental composition of each peptide is used to calculate the theoretical M0and M1values at the natural 12C abundance (98.93%) and when12C is 100%. In partial labeling experiments, we compute M0
12
C.max and M 1
12
C.max, taking into account the fraction of carbon atoms (CA) that can be labeled, and the fraction (CB) not labeled.
The third metanode calculates the experimentalM
M 1exp 0exp
ratio and filters the data according to the maximum theoretical ratio in the mass range considered (0−6000 Da). The next node computes the abundance of12C according toeq 4.
The last metanode determines the molar fractions of normal carbon (NC) and12C-labeled peptides in multiplexing experi-ments by implementingeq 6. Next, the ratio NC
12C is calculated and log 2-transformed.
Integration of bSLIM-Labeling Quantification Data at the Protein Level. To edit variations of protein abundance, we integrated an R script into the workflow through the KNIME R-snippet node. This script allows the grouping of peptides per protein and calculation of the mean and median of the log 2 of theNC
C
12 ratios, both for all of the quantified peptides and using
only the three peptides with the highest M0_model_area intensity (Top-3).
The final results are written into an Excel file for further biological interpretation.
The overall SLIM-labeling data processing workflow is presented inFigure 2A,B. When processing a 1.53 Gb mzML file with the S. cerevisiae protein sequence database, the overall process from peptide identification to protein quantification is executed in an average of 1355 s perfile of experimental data (on Intel Xeon Gold 6134, 8 Cores, 3.2−3.7 GHz Turbo, 24.75 Mo Cache and 16 Go 2666 MHz DDR4 RAM). Most of this time was dedicated to the peptide identification and filtering steps including Percolator and Epifany (343 s), FFId (305 s), and features and protein ID extraction (707 s).
The complete workflows are provided as Executable files E1 and E2. Thefiles can be directly imported into a valid KNIME instance and run as provided, with the appropriate adjustments of certain parameters (protein sequence database, ion intensity threshold, auxotrophies) specific to the user’s experimental conditions. The complete list of the parameters used for each node of the pipelines is provided inSupporting Files S2 and S3.
■
EXPERIMENTAL PROCEDURESStrains and Growth Conditions
S. cerevisiae strains S288c (MATα SUC2 gal2 mal2 mel flo1 flo8-1 hapflo8-1 ho bioflo8-1 bio6)20 and its isogenic derivative BY4742
(MATα his3Δ1 leu2Δ0 lys2Δ0 ura3Δ0)21,22
were used throughout this work. S288c cells were grown on a defined synthetic medium (Yeast Nitrogen Base, with ammonium sulfate, without amino acids, Difco BD Life) with glucose (0.5% w/v) as the sole source of carbon. BY4742 cells were grown under the same conditions, withfilter-sterilizedL-Histidine, L-Leucine,L-Lysine, and Uracil having 20, 100, 50, and 20 mg/L final concentrations, respectively. We ran two types of cultures using either regular glucose (N-Glc) or glucose containing only 12C carbon atoms (U-[12C]-glucose, Euriso-Top, Saint-Aubin, France;filter-sterilized;12C-Glc). The carbon isotopic compo-sition of N-Glc is 98.93%12C/1.07%13C. Cell cultures (100 mL) were inoculated at an initial OD600of 0.03 with liquid pre-cultures (10 mL of the same medium inoculated at an OD600of 0.03 with colonies freshly grown on YPD agar plates) and incubated in an orbital shaker at 30°C. The cells were collected by centrifugation for 5 min at 1200g. The cell pellet was resuspended in 10 vol/g cells of lysis buffer pH 7.5 consisting of 20 mM Tris HCl, 140 mM NaCl, 5 mM MgCl2, 1 mM DTE, and one tablet of protease inhibitor cocktail 2X Sigma fast/10 mL lysis buffer. The cell extracts were prepared by vortexing the cell suspension for six cycles of 2 min in the presence of a 2 vol/vol cell suspension of acid-washed glass beads (0.45−0.5 mm Ø). The cell lysate was diluted twice in the same buffer and large cell debris removed by centrifugation for 10 min at 1200g. The supernatant, referred to hereafter as the cell homogenate, was rapidly frozen in 5 mg protein/mL aliquots and stored at−80 °C. After a BCA protein assay, specific amounts of protein extracts from12C-Glc and N-Glc cultures were mixed for liquid chromatography with tandem mass spectrometry (LC-MS/MS) processing.
LC-MS/MS Acquisition
Protein extracts (40μg) were precipitated with acetone at −20 °C. The protein pellets were collected by centrifugation. The acetone supernatant was carefully removed and the protein pellet resuspended in 20 μL 25 mM NH4HCO3 containing sequencing-grade trypsin (0.2μg/μL aliquots, Promega) and incubated overnight at 37 °C. The resulting peptides were desalted using ZipTip μ-C18 pipette tips (Pierce, Thermo Fisher Scientific) and analyzed on a Q Exactive Plus coupled to a Nano-LC Proxeon 1000 equipped with an Easy Spray ion source (all from Thermo Scientific). Peptides were separated by chromatography with the following parameters: Acclaim PepMap100 C18 pre-column (2 cm, 75 μm i.d., 3 μm, 100 Å), LC EASY-Spray C18 column (50 cm, 75μm i.d., 2 μm bead size, 100 Å pore size) operated at 55°C, 300 nL/min flow rate,
gradient from 95% solvent A (water, 0.1% formic acid) to 35% solvent B (100% acetonitrile, 0.1% formic acid) over a period of 97 min, followed by column regeneration for 23 min, giving a total run time of 2 h. Peptides were analyzed in the Orbitrap cell, in full ion scan mode, at a resolution of 70 000 (at m/z 200), with a mass range of m/z 375−1500 and an Automatic Gain Control (AGC) target of 3× 10⁶. Fragments were obtained by higher-energy C-trap dissociation (HCD) activation with a collisional energy of 30%, and a quadrupole isolation window of 1.4 Da. MS/MS data were acquired in the Orbitrap cell in Top20 mode, at a resolution of 17 500 with an AGC target of 2× 10⁵, with a dynamic exclusion of 30 s. MS/MS spectra of the most intense precursors were acquired first. Peptides with an unassigned charge state or those that were singly charged were excluded from the MS/MS acquisition. The maximum ion accumulation times were set to 50 ms for MS acquisition and 45 ms for MS/MS acquisition.
Experimental Validation of the Bottom-Up Quantification Pipeline
We collected experimental datasets using the cell extracts from the yeast cultures grown under NC or 12C conditions to test and validate our data processing pipelines.
Thefirst two datasets consisted of a series of samples of (i) S288c and (ii) BY4742 peptides. In both cases, peptides were analyzed as 1:0, 0.75:0.25, 0.5:0.5, 0.25:0.75, and 0:1 vol/vol mixtures of identical amounts of total protein extracts prepared from the NC and 12C conditions, respectively. For BY4742, we expected lower12C incorporation rates, as the His, Leu, and Lys residues remain unlabeled.
The third dataset consisted of an analysis of 1:1 mixtures of identical amounts of protein from S288c and BY4742 extracts prepared under the 12C or NC condition (S288C-12C vs BY4742-NC and S288c-NC vs BY4742-12C, with biological duplicates and technical replicates). This allowed quantitative analysis of proteome differences between two yeast strains, often referred to as“wild-type” strains, in a very stringent condition, as only a few proteins are expected to vary significantly. The quantitative results obtained were analyzed using a non-supervised Bayesian clustering algorithm [email protected],24 The information content of the various classes was evaluated using the Saccharomyces Genome Database25(SGD) annotation files and GO-term analysis tools (SGD and BiNGO26
).
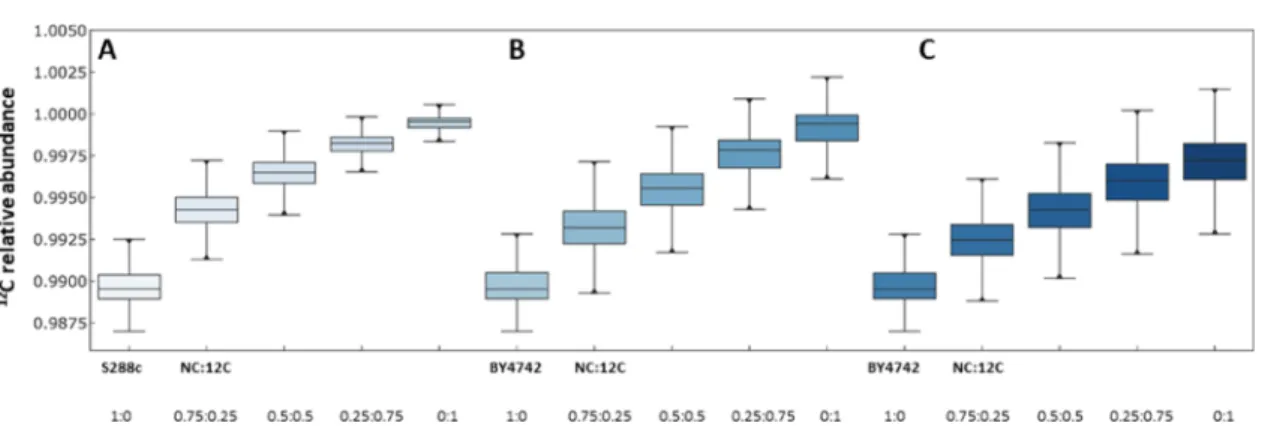
Figure 4 shows the inferred 12C abundance in the various
samples as box plots and the correlation with the theoretical values expected from an incomplete labeling of the peptides, due to the presence of nonlabeled amino acids in the growth media.
Figure 4.12C incorporation levels in the peptides from the experimental standard curves made of mixtures of known amounts of12C-labeled and
nonlabeled peptides (100% NC, 75% NC-25% 12C, 50% NC-50% 12C, 25% NC-75% 12C, and 100% 12C) from (A) the prototrophic yeast strain S288c (n = 4) and (B) the auxotrophic yeast strain BY4742 (n = 4). (C) Corresponding total12C incorporation into proteins from BY4742.
■
RESULTS AND DISCUSSIONHere, we describe an easy-to-use and straightforward workflow to process bSLIM-labeling quantitative proteomics data. The workflow (Figure 4A,B) is implemented in the KNIME environment and uses open-source resources from the OpenMS suite and dedicated R scripts.
The workflow integrates a series of nodes for peptide identification through a database search engine, the calculation of appropriate FDR metrics, feature detection for high-confidence identified peptides, and extraction of the intensity of every isotopologue in every isotope cluster of these peptides. Although we used X!Tandem in this study, other search engines are supported by OpenMS, such as MS-GF+, Mascot, or OMSSA. These search engines may be used with ad hoc parameters and produce the idXMLfiles required for feature detection. Typically, we identified approximately 25 000 peptides with X!Tandem E-values better than 1E-3 at a 1% FDR. A key node in this workflow is OpenMS FeatureFinder-Identification (FFId). This node was originally developed for label-free quantitative proteomics, with an efficient algorithm to extract the raw data (m/z and intensity) of peptides at the MS1 level,find chromatographic peaks (features), and model peptide elution by a Gaussianfit. A control algorithm provides a quality score for each feature. Here, we used a modified version of FFId that allows extraction of the data (raw and modeled) from every isotopologue trace of each identified peptide isotope cluster. All of the analyses were performed using the“Model Area” values, a metric commonly used in modern label-free quantification software.27 Since most of the developments of the SLIM-labeling quantification method presented here rely on accurate M0and M1intensity measurements, we selected only the data that passed the quality control step (flagged as “0 = valid”) for further processing. Applying this stringentfilter reduces the total number of entries to an average of 14−16 000.
All of the datasets were acquired using an Orbitrap Q-Exactive Plus mass spectrometer. Although this instrument is remarkable in terms of mass accuracy, there may be some concerns about the precision of ion intensity measurements in isotope clusters28−30using the Orbitrap as a mass detector, with errors above 20% in the M1 intensity measurement for low-abundance ions. We attempted to overcome this limitation by running samples at different AGC target values (from 1E5 to 5E6) and
different resolutions (from 7.5 to 120 K) in the MS1 acquisition step. However, this did not significantly improve the output of the analysis workflow. The datasets obtained in our standard conditions were nonetheless considered to be of sufficient quality to validate the methods and workflows.
These experimental uncertainties have important consequen-ces when computing the incorporation of12C in SLIM-labeling experiments and the fraction of nonlabeled peptides in quantitative experiments. Indeed, we use the experimental M0 and M1 data with reference to the corresponding theoretical values computed both under the NC condition and under 100% enrichment in the 12C condition, together with the elemental composition of the peptides. Under ideal conditions, the P′(12C) value should be in the range of 0.9893−1, and the nonlabeled peptide fractionα between 0 and 1. However, when running our workflow to compute these factors, we found a large fraction of peptides (3−4 000) with α values (as an example) between 1.005 and 1.007 instead of 1, or between−0.008 and −0.009 instead of 0. We chose to correct the value of these outliers to 1 or 0, respectively. After these corrections, the average number of high-quality data points to process was 11− 12 000 per dataset.
Figure 4A, computed usingeq 4, shows the12C incorporation
levels in the peptides from the experimental standard curves, composed of mixtures of known amounts of12C-labeled- and nonlabeled peptides (100% NC, 75% 25% 12C, 50% NC-50% 12C, 25% NC-75% 12C, and 100% 12C) from the yeast strain S288c.Equation 4states that the variation of12C levels follows an equilateral hyperbola, as observed in the experimental data.
The SLIM-labeling and protein quantification strategy is well adapted to prototroph organisms, such as wild-type micro-organisms that can grow using glucose as the sole source of carbon to sustain all amino-acid biosynthesis. However, incomplete labeling is likely to occur in most biological studies involving laboratory strains with growth dependence for specific amino acids, used as selection markers, or in cell cultures requiring essential amino acids, such as human cell lines. We adapted the SLIM-labeling data processing to these situations by enumerating the amino-acid residues that cannot be12C labeled in every peptide sequence and calculating the number of associated carbon atoms. We therefore defined a new element
Figure 5.(A) Molar fraction of the nonlabeled peptides in proteins of the prototrophic yeast strain S288c from the experimental standard curves made of mixtures of known amounts of12C-labeled and nonlabeled peptides (100% NC, 75% NC-25% 12C, 50% NC-50% 12C, 25% NC-75% 12C, and 100% 12C) (n = 4). (B) Molar fraction of the nonlabeled peptides in proteins of the auxotrophic yeast strain BY4742 from the experimental standard curves made of mixtures of known amounts of12C-labeled and nonlabeled peptides (100% NC, 75% NC-25% 12C, 50% NC-50% 12C, 25% NC-75%
(referred to as“carbon-B”) in the elemental composition, which represents the isotope distribution of natural carbon. This element is incorporated intoeqs 4and7with the same status as hydrogen, nitrogen, oxygen, and sulfur, which have an isotope distribution that remains invariant under full 12C-labeling conditions. We numerically tested this approach using MIDAs (on the command line), in which we added this new element with the features of regular carbon. The numerical simulations showed that eq 9 indeed allowed us to quantify only the exclusive contribution of the NC peptide from the NC condition but not that related to the NC part of the peptides (auxotrophies) from the 12C condition.
Analogous toFigure 4A,B, computed usingeq 10, shows the 12C incorporation levels in the peptides from the experimental standard curves for the yeast strain BY4742, which requires exogenous histidine, leucine, and lysine for growth. These residues cannot therefore be labeled in the 12C condition. The experimental data show that the incorporation in12C is similar to that measured in the extracts from the S288c strain, meaning that the SLIM-labeling strategy allows accurate analysis of12C incorporation rates, even when there is some heterogeneity in the distribution of nonlabeled amino acids in the identified peptides. In a typical experiment with 10 950 peptides (average length: 16 residues), the content of H, L, and K represented from 0 to 62% of the peptide composition, with a mean value of
16.5% (average size of the peptides: 16 residues). However, since a part of the peptides could not incorporate extra12C due to auxotrophy, the total amount of12C calculated usingeq 11
remained lower (Figure 4C), with a broader distribution of12C at each point.
We obtained a linear relationship between the NC fraction and the expected amount of the NC:12C peptides for the points of the standard curve, both under conditions of full labeling (S288c,Figure 5A) and conditions of partial labeling (BY4742,
Figure 5B).
Although the standard curves were established by mixing controlled amounts of peptides from the same strain, grown in the same medium but with different glucose source (NC and 12C conditions), it is still possible to calculate the fold change (FC) for each peptide, defined as the ratio of the ion count from the 12C sample to that from the original NC sample calculated using the bSLIM-labeling quantification. The log 2(FC)s were indeed centered on 0 in the 1:1 mix (50% of each sample) and varied according to the expected ratio, both with the S288c (total labeling) and BY4742 (partial labeling) samples (Figure 6).
The variability under the extreme conditions (1:0 and 0:1, NC:12C) reflects that one of the terms of the ratio tends to 0, and thus the ratio tends to infinity.
Figure 6.Log 2 transform of the NC/12C ratios at the peptide level from the experimental standard curves made of mixtures of known amounts of12
C-labeled and nonC-labeled peptides (100% NC, 75% NC-25% 12C, 50% NC-50% 12C, 25% NC-75% 12C, and 100% 12C) from the S288c and BY4742 strains.
Figure 7.Left: Distribution of12C incorporation in protein samples from 1:1 mixtures of the S288c-12C and BY4742-NC conditions (left), from the
BY4742 -12C and S288c-NC conditions (center), and total12C calculated for the later sample (right). Right: Distribution of the log 2 transform of the NC/12C ratios at the protein level from the 1:1 sample mixtures from the S288c-12C and BY4742-NC conditions (left) and the BY4742-12C and S288c-NC conditions (right).
Overall, these results underscore the soundness of the theoretical grounds for the data processing in SLIM-labeling quantification.
We tested the specificity and sensitivity of the SLIM-labeling quantitative strategy by comparing the differences in protein abundance at the proteome level between the two yeast strains S288c and its isogenic derivative BY4742, the latter strain carrying null alleles for the URA3, HIS3, LEU2, and LYS2 genes. These strains are considered to be prototypical “wild-type” laboratory strains. We performed a label swap to compare the quantitative data of 12C-labeled S288c versus NC BY4742 extracts and BY4742 12C labeling (giving rise to partial labeling) versus NC S288c extracts. The distributions of 12C incorpo-ration (Figure 7A) and of the log 2(FC) (Figure 7B) were similar to those expected from samples of closely related proteome composition and abundance.
The overall analysis allowed us to identify 4162 proteins. However, the quantification was performed on only the 3354 proteins identified by at least eight peptides in the eight samples resulting from two biological and two technical replicates.
The proteins encoded by the genes used as auxotrophic markers (Ura3, Leu2, Lys2, His3) exhibited an average log 2(FC), ranging from 3 to 6 for strain S288c. His3 is a protein not easy to detect and quantify, since it is a low-abundance protein in wild-type cells.31Here, the quantification and the measured FC for the auxotrophy-related proteins clearly showed the sole contribution of the S288c proteins when observed in the S288c-NC vs BY4742-12C condition, indicating the power of the bSLIM method.
Several unexpected differences were also uncovered by this analysis. Two classes of 13 and 22 proteins were overexpressed more than 3- and 2-fold, respectively, in the S288c genetic background (SupportingFigure 1). A third class, consisting of 50 proteins, were underexpressed more than 2-fold in S288c. Among the overexpressed proteins in S288c, the samples were representatives of the three pathways for glutamate synthesis (Gdh1, Gdh3, Gln1, Glt1). Gln1 is known to be regulated by nitrogen source and amino-acid limitation. As all of the amino acids in S288c are synthesized endogenously from glucose, this result suggests that their synthesis may be sufficient to sustain growth but sufficiently limited to trigger specific regulation pathways. A number of proteins involved in mitochondrial functions were also more abundant in S288c than BY4742 (e.g., Cox5A, Cox9, Cox12, Cox13, Cox2, Tim11, Aco1, Aco2, and many subunits of the F0−F1ATPases). This is consistent with the data of Young and Court32and Dimitrov et al.,33showing the importance of the genetic background on mtDNA stability and respiratory competence in yeast. Although the S288c strain was selected based on its auxotrophy for biotin due to bio1 and bio6 mutations, other proteins of the biotin biosynthesis pathway (Bio4, Bio2, Bio3) were specifically found to be more highly produced by S288c than BY4742. These proteins are involved in the de novo biotin synthesis from 7-keto-8-aminopelargonate, a precursor derived from alanine metabolism (for a recent review, see Perli et al.34).
Among the proteins overexpressed in BY4742, many appear to be related to the main pathways involved in the synthesis of histidine, leucine, and lysine, the amino acids added to the BY4742 growth media to supplement the genetic auxotrophy present in this strain. The leu2 mutation affects not only the penultimate step of leucine biosynthesis (3-Isopropylmalate to (2S)-2-Isopropyl-3-oxosuccinate reaction) but also an early step of the valine and isoleucine biosynthesis pathways at the
2-oxobutanoate production reaction. Our data show that certain compensatory mechanisms were activated in BY4742, as the Ilv2,3,5 proteins were overexpressed, as well as Leu1,4,5,9 and Bat1,2, which are directly involved in terminal reactions of leucine and valine biosynthesis. We made a similar observation concerning the histidine regulon, in which His1, 4, 7, and 2 were more abundant in the BY4742 genetic context. However, the extent of the differences in protein synthesis was less than that observed for the leucine regulon. Analysis of the proteins of the lysine biosynthesis pathway showed a general increase in the abundance of proteins involved in lysine biosynthesis in the S288c context in our dataset, presumably caused by the absence of the Lys5 target protein Lys2. Surprisingly, most of the proteins involved in arginine biosynthesis (Arg4, 8, 5, 6, 1, 7) were also more abundant in the BY4742 context. This may be related to the observed decreased in mitochondrial function, which affects the arginine biosynthesis pathway.35
The global analysis of these differences in protein abundance is presented in Supporting Data (AutoClass classification), in which the proteins with similar expression profiles are found in well-defined clusters. Not surprisingly, most proteins exhibited similar abundance in S288c and BY4742. The detail of certain representative clusters is presented in SupportingFigure 1, in which protein abundance varying by a factor >2 are shown. Most of the proteins discussed above are found in these clusters.
■
CONCLUSIONSHere, we present an original and highly efficient workflow to process bSLIM-labeling data based on open-source resources. The overall data analysis process is rapid, i.e., less than 20 min from raw data to protein quantification, and the input and output use standardfile formats (mzML, .tsv, Excel files). The workflows are robust and well adapted to processing data in experiments in which proteins are fully labeled with12C, as well as in experiments in which proteins are only partially labeled, due to the requirement of essential amino acids not yet available as U-[12C]-AA. The workflows are easy to edit for adaptation for specific experiments. It is possible to extend them with new functionalities and to add additional tools and features to the analysis. For example, we used X!Tandem as a database search engine for peptide identification in the present workflow, but it is possible to add other search engines and combine the results files in a single idXML file for feature extraction. The sensitivity of the quantification method allowed us to compare the proteome of two isogenic yeast strains that theoretically differ solely by the absence of four proteins that are missing due to their corresponding gene deletion. Indeed, we were able to demonstrate their absence, but we also revealed a number of other differences, showing that the overall physiology of these strains is different, especially in terms of their mitochondrial function and the amino-acid metabolism. This has important consequences for all studies based on comparative genomics in the yeast S. cerevisiae. These factors should all help us to promote dissemination of the bSLIM-labeling quantitative proteomics approach as a cost-effective method, with great potential for applications both for bottom-up and top-down analyses.
■
ASSOCIATED CONTENT*
sı Supporting InformationThe Supporting Information is available free of charge at
analysis of a 1:1 mixture of proteins from the prototrophic yeast strain S288c and the auxotrophic yeast strain BY4742 in label-swap experiments (data from technical duplicates of biological replicates; n = 4). The partial labeling condition on the left columns corresponds to BY4742 grown on12C-glucose, while the right columns correspond to the 12C-glucose labeling of S288c Executable file E1 (.zip format). KNIME workflows (.knwf file) for protein sequence database preparation, peptide identification, and feature extraction and parsing of the. featureXML files, and extraction of all relevant features and Protein IDs. File name: bSLIM_5i_w_mo-del_area_Identification_FFId. Executable file E2 (.zip format). KNIME workflows (.knwf file) for 12C enrich-ment evaluation and quantitative analysis of the di ffer-ential abundance of proteins in normal carbon versus12 C-labeling conditions for total C-labeling or partial C-labeling. File name: bSLIM_5i_w_model_area_R-snippet_Quan-tif_Prot_total_partial_labeling (PDF)
Supplemental File S2_(Parameter_Knime4.2.2Work-flow_Nov2020) (XLSX)
S u p p l e m e n t a l F i l e S 4 _ ( A u t o C l a s s _ S 2 8 8 c v s -BY4742_12C_NC&Glc_swap.cdt) (ZIP)
E1_K4.2.2_Oms2.6.0_Identification_FFId_(model 5i) _Nov2020 (ZIP) E2_K4.2.2_Oms2.6.0_FFiD_5i_w_model_area_R- snippets_Quantif_Prot_total&partial_labeling_-Nov2020 (ZIP)
■
AUTHOR INFORMATION Corresponding AuthorJean-Michel Camadro− ≪ Mitochondria, Metals, and Oxidative Stress≫ Group, Université de ParisCNRS, Institut Jacques Monod, 75013 Paris, France; ProteoSeine@IJM, Université de ParisCNRS, Institut Jacques Monod, 75013 Paris, France; orcid.org/0000-0002-8549-2707; Email:[email protected]
Authors
Nicolas Sénécaut− ≪ Mitochondria, Metals, and Oxidative Stress≫ Group, Université de ParisCNRS, Institut Jacques Monod, 75013 Paris, France; orcid.org/0000-0001-7948-6776
Gelio Alves− National Center for Biotechnology Information, NLM, NIH, Bethesda, Maryland 20894, United States Hendrik Weisser− STORM Therapeutics Limited, Cambridge
CB22 3AT, U.K
Laurent Lignières − ProteoSeine@IJM, Université de Paris CNRS, Institut Jacques Monod, 75013 Paris, France
orcid.org/0000-0002-6213-7665
Complete contact information is available at:
https://pubs.acs.org/10.1021/acs.jproteome.0c00478
Author Contributions
N.S., G.A., P.P., Y.-K.Y., and J.-M.C. conceptualized the method. N.S., H.W., L.Y.-C., P.P., G.L., and J.-M.C. contributed to the development of the post-processing algorithms. N.S. and J.-M.C. designed and implemented the post-processing algorithms. N.S., L.L., and S.T. performed the experiments. N.S., G.L., and J.-M.C. analyzed the data. N.S. and J.-M.C. wrote the manuscript with input from all of the authors.
Notes
The authors declare no competingfinancial interest.
The mass spectrometry proteomics data have been deposited to the ProteomeXchange Consortium via the PRIDE36 partner repository with the dataset identifier PXD021329. A training set with. mzmlfiles from partial labeling, and total labeling data have been deposited to the ProteomeXchange Consortium via the PRIDE partner repository with the dataset identifier PXD021502.
■
ACKNOWLEDGMENTSThis work was supported in part by Agence Nationale de la Recherche grant ANR-18-CE44-0014. NS received a thesis grant-in-aid from the Center for Interdisciplinary Research (CRI-Paris). The English text was edited by Alex Edelman & Associates.
■
REFERENCES(1) Léger, T.; Garcia, C.; Collomb, L.; Camadro, J. M. A Simple Light Isotope Metabolic Labeling (SLIM-labeling) Strategy: A Powerful Tool to Address the Dynamics of Proteome Variations In Vivo. Mol. Cell. Proteomics 2017, 16, 2017−2031.
(2) Marshall, A. G.; Senko, M. W.; Li, W. Q.; Li, M.; Dillon, S.; Guan, S. H.; Logan, T. M. Protein molecular mass to 1 Da by C-13, N-15 double-depletion and FT-ICR mass spectrometry. J. Am. Chem. Soc. 1997, 119, 433−434.
(3) Shi, S. D.; Hendrickson, C. L.; Marshall, A. G. Counting individual sulfur atoms in a protein by ultrahigh-resolution Fourier transform ion cyclotron resonance mass spectrometry: experimental resolution of isotopic fine structure in proteins. Proc. Natl. Acad. Sci. U.S.A. 1998, 95, 11532−11537.
(4) Rodgers, R. P.; Blumer, E. N.; Hendrickson, C. L.; Marshall, A. G. Stable isotope incorporation triples the upper mass limit for determination of elemental composition by accurate mass measure-ment. J. Am. Soc. Mass Spectrom. 2000, 11, 835−840.
(5) Wang, D.; Liem, D. A.; Lau, E.; Ng, D. C.; Bleakley, B. J.; Cadeiras, M.; Deng, M. C.; Lam, M. P.; Ping, P. Characterization of human plasma proteome dynamics using deuterium oxide. Proteomics - Clin. Appl. 2014, 8, 610−619.
(6) Borzou, A.; Sadygov, V. R.; Zhang, W.; Sadygov, R. G. Proteome Dynamics from Heavy Water Metabolic Labeling and Peptide Tandem Mass Spectrometry. Int. J. Mass Spectrom. 2019, 445, No. 116194.
(7) Alves, G.; Ogurtsov, A. Y.; Yu, Y. K. Molecular Isotopic Distribution Analysis (MIDAs) with adjustable mass accuracy. J. Am. Soc. Mass Spectrom. 2014, 25, 57−70.
(8) Röst, H. L.; Sachsenberg, T.; Aiche, S.; Bielow, C.; Weisser, H.; Aicheler, F.; Andreotti, S.; Ehrlich, H. C.; Gutenbrunner, P.; Kenar, E.; Liang, X.; Nahnsen, S.; Nilse, L.; Pfeuffer, J.; Rosenberger, G.; Rurik, M.; Schmitt, U.; Veit, J.; Walzer, M.; Wojnar, D.; Wolski, W. E.; Schilling, O.; Choudhary, J. S.; Malmstrom, L.; Aebersold, R.; Reinert, K.; Kohlbacher, O. OpenMS: a flexible open-source software platform for mass spectrometry data analysis. Nat. Methods 2016, 13, 741−748. (9) Weisser, H.; Choudhary, J. S. Targeted Feature Detection for Data-Dependent Shotgun Proteomics. J. Proteome Res. 2017, 16, 2964− 2974.
(10) Warr, W. A. Scientific workflow systems: Pipeline Pilot and KNIME. J. Comput.-Aided Mol. Des. 2012, 26, 801−804.
(11) Fillbrunn, A.; Dietz, C.; Pfeuffer, J.; Rahn, R.; Landrum, G. A.; Berthold, M. R. KNIME for reproducible cross-domain analysis of life science data. J. Biotechnol. 2017, 261, 149−156.
(12) Yergey, J. A. A general-approach to calculating isotoic distributions for mass spectrometry. J. Mass Spectrom. 2020, 52, 337− 349.
(13) Wang, B.; Sun, G.; Anderson, D. R.; Jia, M.; Previs, S.; Anderson, V. E. Isotopologue distributions of peptide product ions by tandem mass spectrometry: quantitation of low levels of deuterium incorporation. Anal. Biochem. 2007, 367, 40−48.
(14) Audi, G.; Wapstra, A. H. The 1993 Atomic Mass Evaluation. 1. Atomic Mass Table. Nucl. Phys. A 1993, 565, 1−65.
(15) Holman, J. D.; Tabb, D. L.; Mallick, P. Employing ProteoWizard to Convert Raw Mass Spectrometry Data. Curr. Protoc. Bioinf. 2014, 46, 13−24.
(16) Kessner, D.; Chambers, M.; Burke, R.; Agus, D.; Mallick, P. ProteoWizard: open source software for rapid proteomics tools development. Bioinformatics 2008, 24, 2534−2536.
(17) Duncan, D. T.; Craig, R.; Link, A. J. Parallel tandem: a program for parallel processing of tandem mass spectra using PVM or MPI and X!Tandem. J. Proteome Res. 2005, 4, 1842−1847.
(18) Pfeuffer, J.; Sachsenberg, T.; Dijkstra, T. M. H.; Serang, O.; Reinert, K.; Kohlbacher, O. EPIFANY: A Method for Efficient High-Confidence Protein Inference. J. Proteome Res. 2020, 19, 1060−1072.
(19) Creasy, D. M.; Cottrell, J. S. Unimod: Protein modifications for mass spectrometry. Proteomics 2004, 4, 1534−1536.
(20) Mortimer, R. K.; Johnston, J. R. Genealogy of principal strains of the yeast genetic stock center. Genetics 1986, 113, 35−43.
(21) Brachmann, C. B.; Davies, A.; Cost, G. J.; Caputo, E.; Li, J.; Hieter, P.; Boeke, J. D. Designer deletion strains derived from Saccharomyces cerevisiae S288C: a useful set of strains and plasmids for PCR-mediated gene disruption and other applications. Yeast 1998, 14, 115−132.
(22) Winston, F.; Dollard, C.; Ricupero-Hovasse, S. L. Construction of a set of convenient Saccharomyces cerevisiae strains that are isogenic to S288C. Yeast 1995, 11, 53−55.
(23) Achcar, F.; Camadro, J. M.; Mestivier, D. AutoClass@IJM: a powerful tool for Bayesian classification of heterogeneous data in biology. Nucleic Acids Res. 2009, 37, W63−W67.
(24) Camadro, J.-M.; Poulain, P. AutoClassWrapper: a Python wrapper for AutoClass C classification. J. Open Science Software 2019, 4, 1390−1392.
(25) Cherry, J. M.; Hong, E. L.; Amundsen, C.; Balakrishnan, R.; Binkley, G.; Chan, E. T.; Christie, K. R.; Costanzo, M. C.; Dwight, S. S.; Engel, S. R.; Fisk, D. G.; Hirschman, J. E.; Hitz, B. C.; Karra, K.; Krieger, C. J.; Miyasato, S. R.; Nash, R. S.; Park, J.; Skrzypek, M. S.; Simison, M.; Weng, S.; Wong, E. D. Saccharomyces Genome Database: the genomics resource of budding yeast. Nucleic Acids Res. 2012, 40, D700−D705.
(26) Maere, S.; Heymans, K.; Kuiper, M. BiNGO: a Cytoscape plugin to assess overrepresentation of gene ontology categories in biological networks. Bioinformatics 2005, 21, 3448−3449.
(27) Al Shweiki, M. R.; Monchgesang, S.; Majovsky, P.; Thieme, D.; Trutschel, D.; Hoehenwarter, W. Assessment of Label-Free Quantifi-cation in Discovery Proteomics and Impact of Technological Factors and Natural Variability of Protein Abundance. J. Proteome Res. 2017, 16, 1410−1424.
(28) Erve, J. C.; Gu, M.; Wang, Y.; DeMaio, W.; Talaat, R. E. Spectral accuracy of molecular ions in an LTQ/Orbitrap mass spectrometer and implications for elemental composition determination. J. Am. Soc. Mass Spectrom. 2009, 20, 2058−2069.
(29) Xu, Y.; Heilier, J. F.; Madalinski, G.; Genin, E.; Ezan, E.; Tabet, J. C.; Junot, C. Evaluation of accurate mass and relative isotopic abundance measurements in the LTQ-orbitrap mass spectrometer for further metabolomics database building. Anal. Chem. 2010, 82, 5490− 5501.
(30) Weber, R. J.; Southam, A. D.; Sommer, U.; Viant, M. R. Characterization of isotopic abundance measurements in high resolution FT-ICR and Orbitrap mass spectra for improved confidence of metabolite identification. Anal. Chem. 2011, 83, 3737−3743.
(31) Ho, B.; Baryshnikova, A.; Brown, G. W. Unification of Protein Abundance Datasets Yields a Quantitative Saccharomyces cerevisiae Proteome. Cell Syst. 2018, 6, 192−205 e3.
(32) Young, M. J.; Court, D. A. Effects of the S288c genetic background and common auxotrophic markers on mitochondrial DNA function in Saccharomyces cerevisiae. Yeast 2008, 25, 903−912.
(33) Dimitrov, L. N.; Brem, R. B.; Kruglyak, L.; Gottschling, D. E. Polymorphisms in multiple genes contribute to the spontaneous mitochondrial genome instability of Saccharomyces cerevisiae S288C strains. Genetics 2009, 183, 365−383.
(34) Perli, T.; Wronska, A. K.; Ortiz-Merino, R. A.; Pronk, J. T.; Daran, J. M. Vitamin requirements and biosynthesis in Saccharomyces cerevisiae. Yeast 2020, 37, 283−304.
(35) Braun, R. J.; Sommer, C.; Leibiger, C.; Gentier, R. J.; Dumit, V. I.; Paduch, K.; Eisenberg, T.; Habernig, L.; Trausinger, G.; Magnes, C.; Pieber, T.; Sinner, F.; Dengjel, J.; van Leeuwen, F. W.; Kroemer, G.; Madeo, F. Accumulation of Basic Amino Acids at Mitochondria Dictates the Cytotoxicity of Aberrant Ubiquitin. Cell Rep. 2015, 10, 1557−1571.
(36) Perez-Riverol, Y.; Csordas, A.; Bai, J.; Bernal-Llinares, M.; Hewapathirana, S.; Kundu, D. J.; Inuganti, A.; Griss, J.; Mayer, G.; Eisenacher, M.; Perez, E.; Uszkoreit, J.; Pfeuffer, J.; Sachsenberg, T.; Yilmaz, S.; Tiwary, S.; Cox, J.; Audain, E.; Walzer, M.; Jarnuczak, A. F.; Ternent, T.; Brazma, A.; Vizcaino, J. A. The PRIDE database and related tools and resources in 2019: improving support for quantification data. Nucleic Acids Res. 2019, 47, D442−D450.