n° 20
••••
April 2010
GETTING CARBON VALUE OUT OF THE FORESTRY AND WOOD SECTOR
IN ANNEX I COUNTRIES: THE FRENCH EXAMPLE
Mariana Deheza
1and Valentin Bellassen
23This study examines the possibilities to monetize on carbon markets four types of actions through which the forestry and wood sector can mitigate climate change:
- Increasing the carbon stock in the forest - Increasing the carbon stock in wood products
- Using wood as a substitute for fossil fuels (wood for energy)
- Using wood as a substitute for materials more energy intensive (wood as a material)
Actions of the "stock increase" type can theoretically be valued on the voluntary carbon markets. Developments are nevertheless necessary to make these valuations operational. Mechanisms of the "substitution" type can be valued only on the compliance market. They are currently valued at the level of the user (electric power generation, heating etc.); the forestry and timber industry can only participate in this system via agreements such as "supply contracts".
- This report analyses three project types that could be carried out to activate these mechanisms:
- Reforestation / Avoided deforestation - Improved forest management - Optimized utilization of products
On the basis of seven hypothetical projects, this study identifies a strong carbon sink potential in France (several million metric tons of CO2), including afforestation, the conversion of coppice forest into high forest and the changes in the uses of harvested wood.
Carbon certification is expensive and makes sense only above a critical size that enables project developers to recover their expenses. For reforestation projects in metropolitan France, for example, we estimate this size to be around 100 hectares.
Several certification programs coexist on the voluntary carbon market. Their pertinence to the seven hypothetical projects is also analyzed, together with the conditions for carbon credits generated in the French forestry and wood sector to be monetized on carbon markets. To achieve this, two conditions need to be met: methodologies approved by standards should be developed, and the forestry and wood sector should implement a proper organization.
1
Mariana Deheza is a researcher at CDC Climat Research. Her fields of research include project mechanisms, in particular those linked to voluntary offsets and forest projects. mariana.deheza@cdcclimat.com + 33 1 58 50 99 85
2
Valentin Bellassen is a researcher at CDC Climat Research and a Ph.D student at the Laboratoire des Sciences du Climat et de l’Environnement. With CDC Climat Research his main research topics are voluntary offsetting and the forestry sector. valentin.bellassen@cdcclimat.com + 33 1 58 50 19 75
3
A
CKNOWLEDGMENTS
The authors would like to thank all those who assisted in the preparation of this report,
including Erik Anderson (Practerra), Yves André (CDC Climat), Fahrudin Bajric (FCBA),
Olivier Bouyer et Clément Chenost (ONF International), Fredéric Dinguirard (Andal
Conseil), Sebastien Drouineau (CRPF Aquitaine), Pierre Guigon (Bluenext), Damien Kuhn
(Kinomé), Elias Izquierdo (Expertos Forestales Agrupados), Sebastiaan Luyssaert (LSCE),
Christian Pineaudeau (SySSO), Pablo Rodriguez-Noriega (Agresta Sociedad Cooperativa),
Marianne Rubio (ONF), Amelie Seguret (Carbone 4), Silvia Stefannelli (Autonomous
Region of Friuli Venezia Giulia, Italy), Eric Toppan (FPF) and Moriz Vohrer (Carbon Fix
Standard), for their careful review of the text and their constructive criticism.
They also wish to thank Dominique Bureau (CEDD), Stéphane de Cara (INRA) and
Pierre-Alain Jayet (INRA) for their precious remarks and suggestions.
T
ABLE OFC
ONTENTSI
NTRODUCTION4
I.
FRENCH FOREST AND CARBON CREDITS4
A. A young, fragmented and under-exploited forest 4
B. The forestry sector: murky areas in Kyoto accounting 7
C. Voluntary offsets: complementary to the Kyoto Protocol 10
II.
T
HE POTENTIAL OF FRENCH SEQUESTRATION PROJECTS14
A. Afforestation or reforestation projects 14
B. Improved forest management projects 19
C. "Wood products" projects 26
D. How much carbon in 25 years? 29
III.
C
ERTIFICATION PROSPECTS31
A. Forestry projects and the "carbon" certification criteria 31
B. Which standard for which project? 33
C. Example of a cost benefit analysis of a project to be certified by a voluntary standard 34
IV.
C
ONCLUSIONS36
V.
A
BBREVIATIONS37
A
NNEX1 -
C
ALCULATIONS PERFORMED FOR EACH PROJECT38
A
NNEX2–
E
STIMATION OF THE NUMBER OF CARBON CREDITS GENERATED41
A
NNEX3
–
C
ALCULATIONS OF THE NATIONAL AFFORESTATION POTENTIAL42
A
NNEX4
-
A
SSUMPTIONS MADE FOR THE ECONOMIC ASSESMENT43
R
EFERENCES45
I
NTRODUCTIONIn France, the regulatory framework that resulted from the Kyoto Protocol makes it possible to value only emissions reductions linked to the utilization of wood energy. On the other hand, it does not currently provide any incentive to increase the sequestration of CO2 in forests or wood products.
While the majority of the participants in the French forestry and wood industry wonder about their opportunities in carbon markets, and in particular about getting carbon value for the increase of carbon sinks such as forests and wood products, the sector remains unfamiliar with carbon markets and their operational requirements.
After a description of the forestry sector and its position in existing carbon pricing frameworks, this study focuses on the extent to which "voluntary" carbon markets might make it possible to value the sequestration of CO2 in forestry and timber projects carried out in French territory. With an eye towards practical application, it is based on seven hypothetical projects that could apply for carbon certification in the voluntary markets. The study estimates the sequestration potential of these projects and the number of carbon credits they could generate. A cost benefit analysis is also developed for one of these projects.
I. F
RENCH FOREST AND CARBON CREDITSA. A young, fragmented and under-exploited forest
Increasing area and stocks
The French forest occupies 16 million hectares4, more than one-quarter of the land area of Metropolitan France5. Representing almost one-half of the country's farmland, France’s forest area puts this country in fourth place in the EU25 behind Sweden (30.9 million hectares), Finland and Spain (23.3 million hectares each).
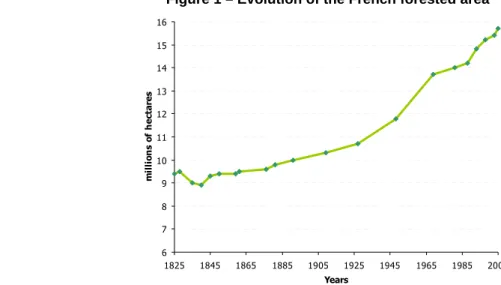
Since the mid 19th Century, the loss of farmland, the development of alternative energies other than wood and flood erosion control programs and voluntary efforts of forestry owners have contributed to an increase in the forested area in France, which grew at the rate of +40,000 hectares/year between 1993 and 2004 (Agreste). A forest takes between 50 and 200 years to reach maturity for harvesting. A good part of the current forested area in France is still "young" and growing: estimates of the French Ministry of Agriculture and the National Forest Inventory (IFN) indicate an annual growth of 103 Mm3 (Figure 1). At maturity, a temperate forest, which is representative of the majority of French forests, can store between 550 and 1,200 metric tons of CO2 per hectare (tCO2/ha) in its above-ground and underground biomass6. Although a large part of the carbon stored in a forest ecosystem, as in the majority of ecosystems, lies in soil, it has been overlooked in most of our calculations, because soil carbon measurement is difficult, time-consuming and expensive to measure.
4
IFN estimations using the FAO forest’s definition - Land areas covering a minimum of 0.5 hectares with tree crown cover of more than 5 meters and a crown density of more than 10%, or with trees capable of reaching a height of more than 20 m.
5
Adding forests of overseas departments, France’s total forest surface reaches more than 23 millions ha which results as approximately 35% of the territory (IFN).
6
Figure 1 – Evolution of the French forested area 6 7 8 9 10 11 12 13 14 15 16 1825 1845 1865 1885 1905 1925 1945 1965 1985 2005 Years m il li o n s o f h e c ta re s
Forested area began to increase in 1850. After the Second World War, this growth was significantly accelerated with the creation of the Fonds Forestier National (FFN), which subsidized forest plantations intended for industrial production. The forested area has continued to increase by 1.7 million hectares over the past two decades, especially in the Mediterranean and Southwestern regions.
Source: MAP, IFN 2005.
French forests are largely privately owned and fragmented
The French forest belongs largely to private owners. Only 26% of the area is publicly owned, 40% of which is owned by the State and the rest by communes. This distribution of ownership varies greatly by region. There is practically no publicly owned forest in the Southwest, although publicly owned forests represent almost one-half of the forested area in the Northeast.
Figure 2 – Structure of private forest ownership
745 1396 1565 2641 2 361 (0,32 ha) 674 (2 ha) 256 (6 ha) 119 (15 ha) 58 (46 ha) 11 (229 ha) 2493 1757 0 500 1 000 1 500 2 000 2 500 3 000 0 to 1 1 to 4 4 to 10 10 to 25 25 to 100 100 and over P ro p e rt y s iz e ( h a )
No. of owners (in 1000s) Area (in 1000s of ha)
As Figure 2 depicts, privately owned forest is quite heterogeneous: only 25% is owned by individuals or institutions that own more than 100 ha, 83% of the owners own less than 10 ha, 444,000 owners own 77% of the area. Because the exploitation of a forest covering less than 4 ha is seldom profitable, 20% of the privately owned forest is highly fragmented7. The fragmentation and young age of the forest explain to a large extent the gap between growth and harvest, although other technical and financial factors such as the difficulty of exploiting certain mountain forests, the shortage of lumberjacks, and the limited production capacity of sawmills also explain part of it.
* The average area per sample is indicated in parentheses.
Source: CDC Climat Research on the basis of the Structure of Private Forest Ownership Survey, 1999.
7
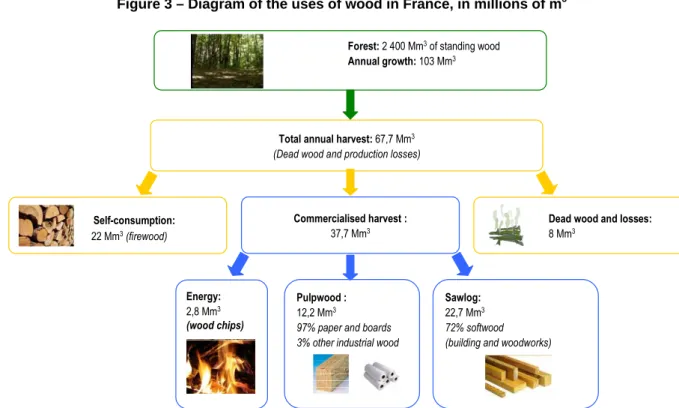
Forest: 2 400 Mm3of standing wood
Annual growth: 103 Mm3
Total annual harvest: 67,7 Mm3
(Dead wood and production losses)
Dead wood and losses: 8 Mm3 Self-consumption: 22 Mm3(firewood) Commercialised harvest : 37,7 Mm3 Sawlog: 22,7 Mm3 72% softwood (building and woodworks) Energy:
2,8 Mm3
(wood chips)
Pulpwood : 12,2 Mm3
97% paper and boards 3% other industrial wood
The forestry and timber industry
The forestry and timber industry, from forest management to paper manufacturers, cabinetmakers and other users of the wood, represents a significant economic sector with 33,287 companies8, some 300,000 jobs and total sales of 51.6 billion euros before taxes. By way of comparison, this sales volume is equivalent to 60% of the sales of French automakers and almost 4 times greater than the sales of the winemaking sector. Figure 3 illustrates the different uses of this resource by producers and downstream industries for the primary and secondary transformation processes.
Upstream, the level of the harvest has remained stable in recent decades, although the production of forests is increasing, which generates a net annual growth of approximately 40 Mm3. This unexploited increase is partly contextual: the old plantings made in the framework of the Fonds Forestier National (FFN) in the second half of the 20th century are only beginning to reach an exploitable age. Moreover, some of this unexploited increase lies in forests with strong structural barriers to exploitation, e.g. forests on steep slopes, inadequate transport etc.
When a forest stand is harvested, approximately 10% of the wood (branches, dead wood etc.) remains in the forest. One-third is "self-consumed" by the owners in the form of wood for heating. Only 55% of the exploited volume harvested is sold, essentially as sawlog wood destined to carpenters and furniture makers, and pulpwood which is used for paper and panelling manufacture.
Figure 3 – Diagram of the uses of wood in France, in millions of m3
60% of the wood harvested is used by the paneling and paper industries and for energy purposes. The remaining 40% is used for the manufacture of veneer or sold in the form of solid wood. Wood used as domestic heating represents the largest utilization of energy wood (22 Mm3).
Source: CDC Climat Research based on data from the MAP, IFN, INSEE and CNPPF.
This description of the forestry and timber industry points out three possible ways of mitigating climate change: (1) increasing or maintaining the carbon sinks in the forest, which can be done either by reforestation, by avoided deforestation, or by improving forest management practices, (2) increasing the carbon stocks in wood products and (3) reducing carbon emissions in other economic sectors by substitution, such as the utilization of wood energy in place of home heating oil or wood as a replacement for steel in construction.
B. The forestry sector: murky areas in Kyoto accounting
To understand how to provide incentives to the forestry and wood industry to optimize its contribution to climate change mitigation, we first have to understand its current position in the French declination of the Kyoto accounting framework. The Kyoto Protocol accounting rules for the forestry and wood industry in fact determine the type of "carbon incentive” that can be provided.
The French forest absorbs 72.3 million tons of CO2 a year
In 2007, French emissions of greenhouse gases represented 531 million metric tons of CO2 equivalent (CO2e) without taking into consideration the emissions and absorptions of CO2 due to changes in land use and forests. With 141 MtCO2e, the transportation sector is the largest emitter, followed by manufacturing and agriculture. Changes in land use and forest growth generated a net sequestration of 72 MtCO2, i.e. 13% of French annual emissions.
Figure 4 – French greenhouse gas emissions by sector in 2007 in MtCO2e
(total excluding UTCF: 531 MtCO2e)
142,5 102,2 110,1 71,8 104,7 10,6
Source: CITEPA / SECTEN Inventory.
The “Kyoto forestry credits” received by France: 3.2 MtCO2/year
In the framework of the Kyoto Protocol, signed in 1997, 40 industrialized countries including France have committed to stabilize or reduce their anthropogenic emissions of greenhouse gases. These developed countries, so called “Annex I countries”, receive a number of carbon credits - Assigned Amount Units or AAU - corresponding to their emissions objective over the 2008-2012 period. Each year these countries also submit to the United Nations Framework Convention on Climate Change (UNFCCC) an inventory of their emissions of greenhouse gases and are required to ensure that they surrender as many AAUs as the emissions reported in their inventory. To comply, they can reduce the emissions within their borders, purchase AAUs from other countries or invest in emissions reduction projects in the framework of the flexibility mechanisms available under the Protocol. Under certain conditions they can also be awarded another type of carbon credits, namely Removal Units (RMU), which are issued for their forestry and timber sector.
Rules for awarding forestry carbon credits (RMU) for Annex I countries
The rules for the awarding of credits related to Land Use, Land Use Change and Forestry (LULUCF) are set forth in Article 3.3 and 3.4 of the Kyoto Protocol. Article 3.3 applies to afforestation, reforestation and deforestation, and Article 3.4 relates to land that kept being forested since 1990, including clear-cuts followed by regeneration.
Transportation
Institutional and commercial buildings Industry
Energy generation Agriculture Waste treatment
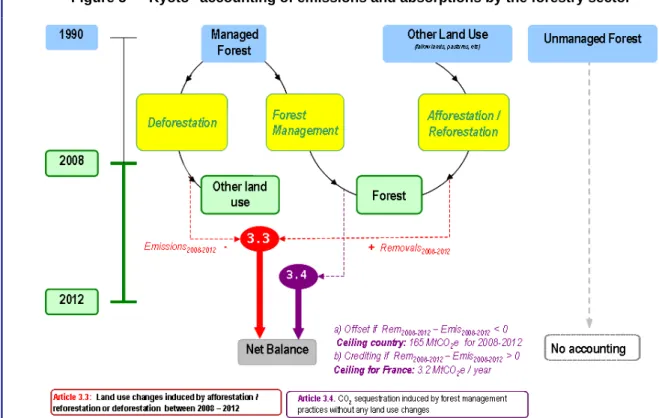
Figure 5 – "Kyoto" accounting of emissions and absorptions by the forestry sector
Source: CDC Climat Research.
Managed forest (optional accounting)
Article 3.4 of the Kyoto Protocol allows Annex I countries to optionally include in their national inventories the carbon emissions and sequestration related to the management of forests9. In practice, this includes all changes in the carbon stocks of lands that have been forests since 1990. To factor out effects linked to the normal aging of forests and the acceleration of their growth because of climate change, the Kyoto Protocol caps the quantity of RMUs that a country can receive from a positive "3.4 budget".
Over 2008-2012, France, which has opted for the accounting of its "forest management", will therefore receive as many RMUs as it has tons of CO2e in its "3.4 budget" up to a cap of 3.2 million tons of CO2 per year10. In 2007, the French "3.4 budget" was approximately 80 million tons of CO2e, i.e. significantly more than the creditable cap. Because this figure is not likely to change significantly over the period 2008-2012, the French State does not have any incentive to impulse the improvement of forest management neither in public nor in private forests. A project that would increase the amount of carbon sequestered in French forests would not increase the 3.2 million RMUs France will receive each year under the terms of Article 3.4.
Afforestation/reforestation/deforestation (mandatory accounting)
Article 3.3 of the Kyoto Protocol requires an accounting for emissions and sinks linked to afforestation, reforestation and deforestation operations resulting in land use changes. The net variation between 2008 and 2012 of the carbon stock of these lands, the use of which has changed since 1990, constitutes the "3.3 budget". For the year 2006, the national inventory shows a slightly positive budget (0.3 MtCO2e/year, Source: MAP-IFN). This actual budget over result 2008-2012 may be different, especially in the event of unforeseen deforestation or changes in the inventory methodology. If the budget becomes negative, France is authorized to offset the deficit using the "inexhaustible" surplus produced by Article 3.4 up to a certain cap limited to 9 MtCO2e/year.
9
Definition of forest management (Decision 11/COP7): a system of practices for stewardship and use of forest land aimed at fulfilling relevant ecological (including biological diversity), economic and social functions of the forest in a sustainable manner.
10
An afforestation project that would reduce such a deficit would therefore not have any incidence on the State's "carbon" accounts, which would remain at zero. This risk explains the difficulty of conveying the carbon incentive to forest owners, because such a mechanism would require the State to deliver carbon credits to individual reforestation projects.
Similarly, in the event of a negative balance under Article 3.3, the State would not receive any RMU and therefore could not deliver any units to owners who afforested their land.
Figure 6 – "Kyoto" balances of the French forest in 2006
Balance of changes in land use Removals (Afforestation / Reforestation) Emissions (Deforestation) Net source of removals (0.276 MtCO2e) Balance of Forest Management Removals (Growth) Net source of removals (79.97 MtCO2e) 0 No lose target * Article 3.3 Article 3.4 Plafond 3.2 MtCO2e/yr
* Thanks to the large Article 3.4 surplus
The Article 3.3 balance between reforestation and deforestation activities leaves France with a small surplus. A slight increase in deforestation could change this result before 2012, in which case France would move to a zero balance under Article 3.3. With regard to "forest management", France will receive a maximum of 3.2 million tons of credits annually, significantly less than the "Article 3.4 budget" of 72.6 MtCO2e/year.
Source: CDC Climat Research based on CITEPA data (2006 Inventory).
It is worth pointing out that the numbers described above for France’s 3.3 and 3.4 budget positions are aggregated on the national level and conceal regional disparities. Some regions have a high level of net afforestation (Provence/Alpes-Côte d'Azur, Rhône-Alpes). Other regions report net deforestation, such as Guyana, which by itself accounts for 35% of the national emissions from deforestation. Aquitaine is a special region where afforestation and deforestation emissions are balanced, each representing approximately 10% of the nation’s total.
The existing incentives for the forestry and wood sector
Sequestration in harvested wood products
The sequestration of carbon in harvested wood products is not taken into consideration in the Kyoto Protocol. All the carbon of harvested wood is considered to be re-emitted immediately.
Wood as a replacement for other energy sources and materials
Another manner in which the forest products industry contributes to climate change mitigation is the use of wood as a lower-emission alternative, either as a fuel for energy generation or as a material to replace concrete or steel in the construction sector.
In both cases, the "carbon" incentive to substitute other materials or fuels with the use of wood is already in place at the national level: a reduction of emissions from the energy or construction materials sector is automatically reported in the French national inventory and consequently releases AAUs.
• The largest industrial power generation and construction materials production installations are subject to the European Union Emissions Trading Scheme (EU ETS)11 for CO2. At the level of power generation, the EU ETS has in fact driven some power plants to substitute wood for some of the coal they burn. The emissions of the major producers of steel beams are therefore capped, which theoretically gives a competitive advantage to producers of wooden beams. However, it is possible that this “carbon incentive” remains at the level of the producer of the steel beams, if his production of carbon diminishes because of an increase of wood use, he can benefit from exceeding quotas to trade at the market.
• Small installations that are not subject to the EU ETS can develop a domestic offset project12 to reduce their emissions. This is the case in particular for small heat generating installations. In this framework, the State issues carbon credits (ERU) corresponding to the reduced emissions to the project developer, which are therefore been removed from the national account. The various eligible methods include the use of woody biomass as a replacement for a fossil fuel for the generation of heat. This approach has been operational in France since 2007 and recently three projects of this type have been accepted by the French State which correspond to a total of 0.9 MtCO2 for the period 2008-2012.
The complexity of these accounting rules does not facilitate the creation of mechanisms that correctly value the contribution of the forest products sector to climate change mitigation. Only substitution (wood as an energy source and wood as a substitute for other materials) benefits from two mechanisms derived from the Kyoto protocol. Additional economic incentives may nevertheless be found in the framework of voluntary offsets.
C. Voluntary offsets: complementary to the Kyoto Protocol
More flexible and less developed than Kyoto offsets
Simultaneously to the implementation of the regulatory mechanisms of the Kyoto Protocol, an increasing number of individuals, businesses or public institutions that are not subject to mandatory emission reduction requirements have voluntarily committed to offset their greenhouse gas emissions. These commitments create a demand for "carbon offsets". Carbon offsetting consists in compensating for some or all of a company's emissions by purchasing carbon credits (emissions reduction units or carbon sequestration units generated by carbon projects).
The “voluntary” segment of this market is still relatively small although it is growing rapidly. In 2008, 54 million tons of CO2 equivalent were traded, 17% of which originated from forestry projects
13
. The average price per ton was close to 4 euros, although the price varied significantly as a function of the perceived quality of the project and the image value that accrued to the buyers. These are modest figures compared to the 600 million tons of CO2 equivalent traded on the compliance segment of the market coming from mandatory emissions caps, i.e. projects developed within the Kyoto framework (CDM and JI14), at the higher average price of 15 euros per ton. Nonetheless, the evolution of the voluntary market depends to some extent on the outcome of the international negotiations which will define the post-Kyoto rules and the emergence of other compliance markets around the globe.
11
Directive 2003/87/EC, establishing the system which, since 2005, covers 11,000 industrial sites in Europe.
12
Decree 2006-622 of the French Ministry of Ecology and Sustainable Development, issued March 2, 2007.
13
Source: Hamilton et at. (2009)
14
CDM: Clean Development Mechanism which enables Annex 1 countries to obtain emissions credits by investing in reduction projects or projects that prevent greenhouse gas emissions in a developing country. JI: The Joint Implementation mechanism makes possible trades between Annex 1 countries, based on the investment in projects in another Annex 1 country or on the basis of national rules, such as in France, in the context of domestic offset projects.
Forest carbon projects: the major quality principles
The development of the voluntary market has raised concerns on account of scandals reported by the press in which fake offset projects were sold, thereby undermining the credibility of the entire sector. To limit such fraud, quality certification standards have been created in the voluntary market.
Their objective is to guarantee the environmental integrity of the projects they certify, i.e. to ensure that the tons of carbon traded on the voluntary market actually correspond to real emissions reductions. The three principal certification criteria are:
• Additionality: All the voluntary standards follow the United Nations guidelines of additionality. The project developer must demonstrate that the project creates environmental benefits - additional sequestration of carbon compared to a baseline - and that these benefits could not have been achieved in the absence of carbon credits: a project that would have been profitable without obtaining credits is generally ineligible. However, under some conditions this financial demonstration of additionality can be replaced by a demonstration of the existence of technological or cultural barriers to the execution of the project. Certain certification programs also allow the establishment of a performance benchmark as a criterion for the additionality assessment. Proof must be provided that the project goes beyond the regulatory recommendations of the host country.
• Permanence: to cater for the risks of fires or storms and thus the re-emission of the tons of carbon sequestered in the forest, an insurance system has been established by most standards. In the case of the Voluntary Carbon Standard (VCS), an insurance pool, common to all forestry projects, is fed by a buffer that is a percentage of the credits generated by each project. The size of this buffer is determined on a project basis by a risk assessment procedure. If a project is confronted with a natural disaster - fire, disease etc. - the credits that have already been sold are replaced by the credits accumulated in the buffer by other forestry projects already in place, thereby guaranteeing credit buyers the permanence of their offsets.
• Double counting: The ability to track the carbon units traded on the voluntary markets is a necessary condition to ensure credibility of these markets. The standards therefore require that the carbon credits they are certifying have not already been counted in the national inventories of the Annex 1 countries or are not included or utilized in another emissions trading scheme such as the EU ETS. If that was the case, the same emissions reduction would be counted twice: once in the national inventory of the host country and once as a voluntary carbon "credit". To eliminate this risk, proper to countries that have in place reduction commitments, the standards require that the tons that correspond to credits issued for a project be removed from the national inventory. This criterion is very important since it will be the one allowing the sale of voluntary forestry credits.
The different voluntary offset certification programs
Around ten quality certification programs currently coexist on the voluntary offset market. This report concentrates on those that allow forestry projects in the Annex I countries: Voluntary Carbon Standard, Carbon Fix Standard, Climate Community and Biodiversity Standard, as well as the Chicago Climate Exchange Standard, which is included for methodological reasons.
Voluntary Carbon Standard (VCS)
The Voluntary Carbon Standard (www.v-c-s.org) was developed in 2006 by the Climate Group Association, the International Emissions Trading Association and the World Economic Forum Global Greenhouse Register. The VCS created its own carbon credit - the Voluntary Carbon Unit (VCU). VCS aspires to become the reference certification for the voluntary market and is already used by a majority of forest carbon project developers. In 2008, VCS credits were trading at around 4€15.
15
Chicago Climate Exchange (CCX)
The Chicago Climate Exchange (www.chicagoclimatex.com), created in 2003, is a market that functions as a stock exchange where CO2 units are traded along with five other greenhouse gases among the entities who are voluntarily involved in the system. In cases of forestry projects, the trading asset is called an Exchange Forestry Offset (XFO).
So far, thirteen forestry projects have been registered with the CCX and verified16. CCX requirements are generally more flexible than those for VCS or CDM projects, and between 2007 and during the first semester of 2009, its credits were trading between 0.4€ and 4.9€ per metric ton of CO2
17 .
Initially limited to projects originating in countries that were not signatories to the Kyoto Protocol, this market was expanded in 2008 to include greenhouse gas emissions reduction projects anywhere in the world, except for countries that are subject to emissions reduction commitments and that have established an emissions trading mechanism18. Although French projects are therefore not eligible, we nevertheless include this standard because of its accounting methodology for carbon in Long Lived Wood Products used in the "Projects" section.
Carbon Fix
The Carbon Fix Standard (www.carbonfix.info) was developed by international scientists specialized in forestry, environment and climate change. This organization sets criteria for afforestation/reforestation projects which are verified by third party certifiers. Projects certified according to the Carbon Fix Standard can gain VER (Voluntary Emission Reductions) credits. This standard is distinguished by the simplicity of its methodologies, which can easily be used by foresters who are not specialists in "carbon" issues. In 2008, these credits traded at around 13 €19, although the market seems relatively small.
Climate, Community and Biodiversity Standard (CCBS)
The Climate, Community and Biodiversity Standard (www.climate-standards.org) was created by the Climate, Community and Biodiversity Alliance in cooperation with scientific experts and NGOs. The first version of the standard was published in May 2005. The objective of this label is to promote forestry projects (afforestation, avoided deforestation, improved forest management) that combat climate change while benefiting local communities and biodiversity. In contrast to the other three standards, this program certifies a project in its entirety as "good for the climate" but does not issue credits corresponding to a specific quantity of tons of carbon sequestered. Therefore, it is in general used in conjunction with one of the above certification programs.
16 Until January 2010. 17 Hamilton et al. (2010). 18 http://theccx.com/info/advisories/2008/2008-01.pdf 19 Hamilton et al. (2009).
Table 1 – Snapshot of the standards that certify forestry projects in Annex 1 countries S o u r c e : C D C C l i m a t R e s e a r c h .
Source : CDC Climat Research. Labels Voluntary Carbon
Standard Chicago Climate Exchange Carbon Fix Standard
Climate, Community and Biodiversity Standard
Credit units Voluntary Carbon Unit (VCU)
Exchange Forestry Offsets (XFO)
Verified Emission Reduction (VER)
No credits issued, but a dual certification is possible (with CFS or VCS, for example) Types of forestry projects accepted Afforestation-Reforestation / Avoided deforestation Improved forest management Sequestration in harvested wood products Afforestation -Reforestation / Avoided deforestation Improved forest management Sequestration in harvested wood products Afforestation/Reforestation
Forest projects sequestering carbon that simultaneously produce benefits in terms of biodiversity and sustainable development of local communities
Demonstration: Sample demonstration: Demonstration: Demonstration:
Additionality
• Improvement with respect to existing regulations
• Existence of barriers to the implementation of the project (financial related to investment capacity, technical, institutional or those which are related to the uncertainties of the market for wood for example)
• Proof that their environmental practices equal or exceed those commonly considered a minimum standard among similar landowners in the area
• Improvement with respect to existing regulations
• Existence of barriers to the implementation of the project (financial, institutional, cultural)
• Improvement with respect to existing regulations
• Projects are designed with a long-term perspective
• The project must demonstrate that it would not be viable in the absence of the income generated by the sale of credits.
• Improvement with respect to existing regulations
• Existence of barriers to the implementation of the project (financial, institutional, cultural)
Permanence
Insurance with a Non-Permanence Risk Analysis and Buffer Determination (between 5 and 60%, depending on the risk analysis)
Insurance with buffering of 20% of the credits
Insurance with buffering of 30% of the credits for all the projects
The project identifies the potential risks and takes measures to offset them.
Double counting
Present proof that the credits are not already counted in the national inventory
Projects in Annex 1 countries are not accepted.
The standard is verified with the public authorities of the country where the project is developed so that it can be removed from the national inventory.
The project developer must specify why there is no double counting.
Nature and method of credit
calculation
Ex-post credits: credits are delivered once the carbon sequestration is verified.
Ex-post credits: credits are delivered once the carbon sequestration is verified.
In its new version, CFS enables project developers to sell their credits in advance (ex ante) and ex post.
No credits
Timetable and details on the awarding of credits
Credits after each verification (at least once every 5 years). The share of the credits placed in the buffer may be reduced with each verification if a project has demonstrated its sustainability and ability to mitigate risks
The total of all the credits that will be placed on the market must not exceed the cumulative average of the benefits inventory during the forest rotation period.
80% of the credits received after each annual
verification. The 20% placed in reserve are released after the commitment period.
70% of the credits received after certification of the project. The 30% placed in reserve will be returned following subsequent verifications.
No credits
Other pertinent information
The VCS also requires an assessment of the positive and negative impacts that can result from the execution of the project. Projects can and in general search to do joined certification with the CCBS standard.
The projects must have duration of at least 20 years.
Project duration must be higher than 30 years. Projects can do joined certification according to the CCBS and the Forest Stewardship Council (FSC) and do not require double documentation.
The projects must generate positive social and economic impacts.
The projects are subject to a period of 21 days of public consultation
II. T
HE POTENTIAL OF FRENCH SEQUESTRATION PROJECTSThis section presents seven theoretical projects that could qualify as offset projects that sequester, destroy or reduce GHG emissions in the forest and timber sector: two afforestation projects, three improved forest management projects and two projects related to the use of wood. These project ideas emerged from the literature and from initiatives that have been or are projected by representatives of the forestry and wood sector.
For each project, we present:
1) The technical characteristics of the project and the baseline adopted, i.e. the situation that would exist if the project were not carried out;
2) An estimate of the quantities of carbon sequestered or the quantities of the greenhouse gas emissions, in the standard project and in the baseline, over time and over the lifespan of the project; 3) A balance sheet of the carbon sequestration or the reduced emissions at the end of the project; 4) An estimate of the number of credits generated by the project, based on existing VCS methodologies for forest stocks and wood products20.
The additional carbon sequestration achieved by each project is estimated on the basis of a conservative baseline for the following three compartments: the carbon stock in the forest, the carbon stock in wood products and greenhouse gas emissions avoided by the substitution of the wood for fuels or construction materials that emit greater quantities of greenhouse gases. The coefficients and assumptions used to calculate the sequestration figures are described in detail in Annex 1.
With an eye towards the certification of these tons of sequestered CO2e 21
, which will be explored in Part IV, two compartments of a given project will not necessarily be certified by the same standard. An afforestation project certified by the VCS may produce wood-energy which is valued via domestic offset projects. Finally, the "national potential" of some of these projects is estimated as a function of the land available at the national level (e.g. on the basis of the total area of coppice forest for the coppice forest improvement project).
A. Afforestation or reforestation projects
Definitions of the forest and forestry activities can differ greatly from one country to another. The certification programs for the voluntary market frequently refer to the harmonized definitions adopted in the negotiations for the Kyoto Protocol. Afforestation means "the direct human-induced conversion of land that has not been forested for a period of at least 50 years". Reforestation is "the direct human-induced conversion of non-forested land to forested land on lands that did not contain forest on December 31, 1989"22.
Interestingly, this rule has some exceptions for the Carbon Fix standard, which in cases of force majeure (forest fires, storms, etc) accepts recently lost forests as eligible for reforestation projects.
Two afforestation projects are studied here: a mature stand of wood to be used for sawlogs and a very short rotation coppice plantation to produce energy wood.
20
VCS was chosen because according to Hamilton et al. (2010) it has been historically the third party standard most widely used (44% of all forestry projects) solely or alongside other third party standards.
21
Conversion: 1 metric ton of wood = 2 m3 of wood and 1 m3 of wood = 1 metric ton of CO2
22
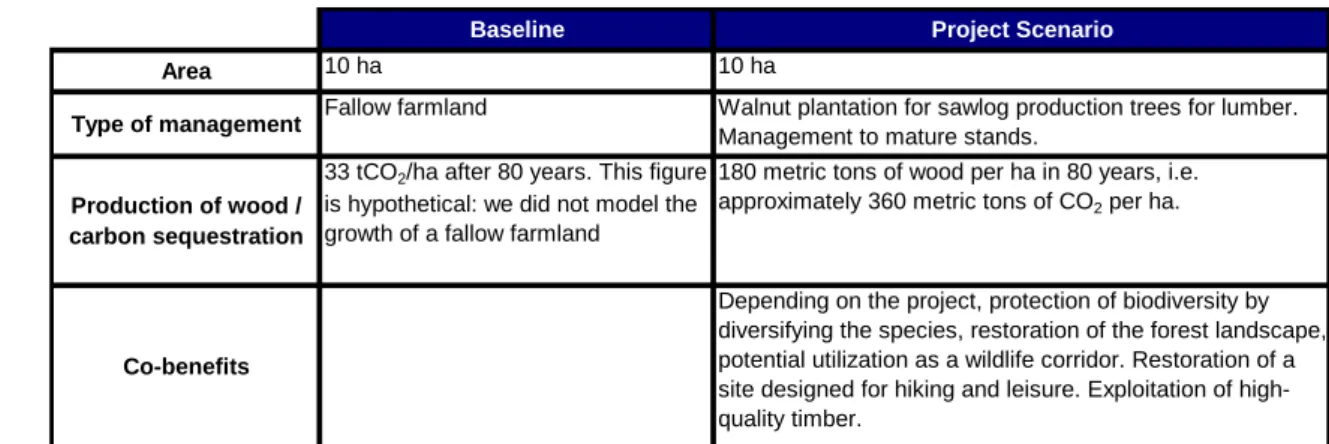
Example 1: Afforestation project for hardwood sawlog production
An environmental association is looking for partners to transform fallow farmlands into forest in the PACA (Provence - Alpes - Côte d'Azur) region. The general characteristics of the project are presented in Table 2.
Table 2 – Scenarios of the sawlog afforestation project
Baseline Project Scenario
Area 10 ha 10 ha
Type of management Fallow farmland Walnut plantation for sawlog production trees for lumber. Management to mature stands.
Production of wood / carbon sequestration
33 tCO2/ha after 80 years. This figure is hypothetical: we did not model the growth of a fallow farmland
180 metric tons of wood per ha in 80 years, i.e. approximately 360 metric tons of CO2 per ha.
Co-benefits
Depending on the project, protection of biodiversity by diversifying the species, restoration of the forest landscape, potential utilization as a wildlife corridor. Restoration of a site designed for hiking and leisure. Exploitation of high-quality timber.
Source: CDC Climat Research, after Reverchon (2006).
The calculations of carbon sequestration in the forest and in the wood products in the project cycle, as well as the substitution effects, are presented in the Annexes. A graphic representation of the evolution of these effects over time is shown in Figure 7.
Figure 7 - Carbon sequestration for the sawlog afforestation project
Source: CDC Climat Research.
The estimation of the number of VCU credits generated by the project (see Annex 2) is presented in Figure 8.
The figure shows that beginning in Year 35 the number of credits generated from carbon sequestration (in the forest and harvested wood products) stops increasing. According to VCS guidelines, a project cannot generate more credits than the temporal average of the net sequestration during the rotation period, and this value is reached for this particular project in Year 35. At the end of 40 years the project generates 2,200 VCUs considering the buffer discount.
tC O tC O tC O tC O2222 e (c um ul at iv e) e (c um ul at iv e) e (c um ul at iv e) e (c um ul at iv e) Time/Age (years) Time/Age (years) Time/Age (years) Time/Age (years)
Project (Materials substitution) Project (Materials substitution) Project (Materials substitution) Project (Materials substitution) Project (Stocks in Wood Products) Project (Stocks in Wood Products) Project (Stocks in Wood Products) Project (Stocks in Wood Products) Baseline (Stocks in Biomass) Baseline (Stocks in Biomass) Baseline (Stocks in Biomass) Baseline (Stocks in Biomass)
Project ( Project ( Project (
Project (EnergyEnergyEnergyEnergy substitut substitut substitut substitution) ion) ion) ion) Project (
Project ( Project (
Figure 8 - Number of VCUs generated by the afforestation project 10 30% 15% 5 2438,6 5,8 Creditable Sequestration rate
(tCO2e)/ha/yr* Project size (ha) Buffer (%) Release (%)
Verification periodicity (Years) Temporal average of the net carbon sequestration during the rotation period (tCO2e)
* computed on a 35 year basis
Source: CDC Climat Research.
Example 2: Industrial Afforestation project for energy production
The project is developed by a major energy sector company that wants to produce wood for the wood energy sector. The characteristics of the project are presented in Table 3.
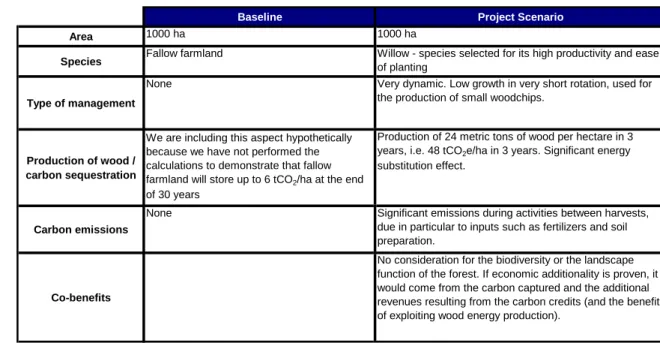
Table 3 – Scenarios of the industrial energy afforestation project
Baseline Project Scenario
Area 1000 ha 1000 ha
Species Fallow farmland Willow - species selected for its high productivity and ease of planting
Type of management
None Very dynamic. Low growth in very short rotation, used for the production of small woodchips.
Production of wood / carbon sequestration
We are including this aspect hypothetically because we have not performed the calculations to demonstrate that fallow farmland will store up to 6 tCO2/ha at the end of 30 years
Production of 24 metric tons of wood per hectare in 3 years, i.e. 48 tCO2e/ha in 3 years. Significant energy substitution effect.
Carbon emissions
None Significant emissions during activities between harvests, due in particular to inputs such as fertilizers and soil preparation.
Co-benefits
No consideration for the biodiversity or the landscape function of the forest. If economic additionality is proven, it would come from the carbon captured and the additional revenues resulting from the carbon credits (and the benefit of exploiting wood energy production).
Source: CDC Climat Research.
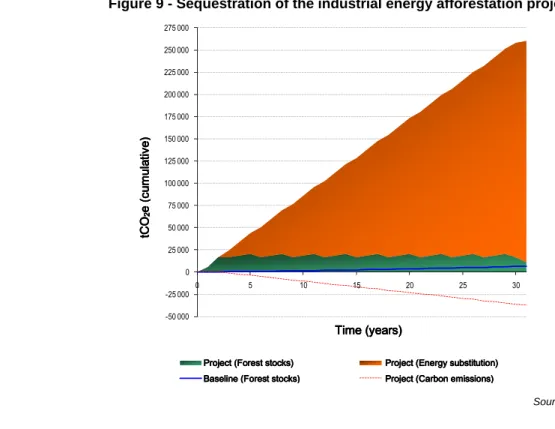
As shown in Figure 9, the frequency of harvests leaves little forest stocks standing in spite of the large size of the project (1000 ha). The energy substitution effect, on the other hand, is significant.
The project cannot generate VCU credits because, according to our estimations, from the 15th year, greenhouse gas emissions due to fertilization and other forestry operations cancel out the credits that could be generated in the forest stocks. Nevertheless, the substitution effects could be valued under a compliance mechanism but not under a voluntary standard because of the double counting criteria.
Figure 9 - Sequestration of the industrial energy afforestation project -50 000 -25 000 0 25 000 50 000 75 000 100 000 125 000 150 000 175 000 200 000 225 000 250 000 275 000 0 5 10 15 20 25 30 tC O2 e (c u m u lé e s ) Temps (ans)
Projet (stock forêt) Projet (Substitution énergétique) Scénario de Référence Fuites de carbone
P PP
Projectrojectrojectroject ( ( ( (Forest stocksForest stocksForest stocksForest stocks)))) Base
BaseBase
Baseline (line (line (line (Forest stocksForest stocksForest stocks)))) Forest stocks
P PP
Projectrojectrojectroject ( ( ( (Energy substitutionEnergy substitutionEnergy substitutionEnergy substitution)))) P
PP
Projectrojectrojectroject ( ( ( (Carbon emissionsCarbon emissionsCarbon emissionsCarbon emissions))))
TTTTimeimeimeime ( ( ( (years)years)years)years)
tC O tC O tC O tC O2222eeee (c um ul at iv e) (c um ul at iv e) (c um ul at iv e) (c um ul at iv e)
Source: CDC Climat Research
National potential for afforestation projects
Four scenarios of national afforestation objectives are analyzed. Their realism is tested against the total area available for afforestation. Their implication in terms of carbon sequestration is then quantified23.
• Pol1 = 10 000 ha/an • Pol3 = 30 000 ha/an • Pol5 = 50 000 ha/an • Pol8 = 80 000 ha/an
Policy Pol3 corresponds to an objective set in 2000 by the National Program for Tackling Climate Change – Programme National de Lutte contre le Changement Climatique (PNLCCC) for the development of carbon sequestration in the forest, via a boost to the policy of afforestation of fallow farmlands (doubling the annual pace of afforestation up to a level of 30,000 ha/year). Barthod (2001) also indicates that this pace of doubling afforestation is necessary to guarantee the availability of this resource for industrial purposes.
More optimistic policies (Pol5 and Pol8) are also tested, as was done by INRA (2002), as well as a very pessimistic one, Pol1 which considers a pace of only 10,000 ha.
To test the realism of these 4 scenarios, we estimate the quantity of land available for afforestation. This quantity, broken down by region, makes it possible to estimate the regional distribution of the national potential.
The land available for afforestation is determined on the basis of data from Teruti-Lucas, which records land use in France:
• unused fallow farmland
• Grassland not used for livestock or infrastructure purposes.
23
Table 4 – Estimate of afforestable areas (in hectares)
Among the different eligible types of land we have not included areas that are used in agricultural, industrial, urban development, infrastructure activities and zones of special ecological interest. Our estimates do not take agricultural land set aside into consideration because the plantings that are in direct competition with agricultural uses are generally not eligible for voluntary offset certification, and because it is difficult to make a distinction between land that has been abandoned and that which is part of an agricultural production system.
Source: CDC Climat Research on the basis of SCESS data (TERUTI 2008 Survey).
A distinction is then made between two estimates: "Optimistic" and "Conservative". The "optimistic" estimate considers all land types previously identified. The "conservative" estimate eliminates all of the "fallow land" in the Mediterranean and mountainous regions (Languedoc-Roussillon, Provence-Alpes-Côte d'Azur, Corsica and Rhône-Alpes). In these regions, the terms "fallow land" or "garigues" are applied to many different types of land that cannot physically grow trees and therefore cannot be afforested.
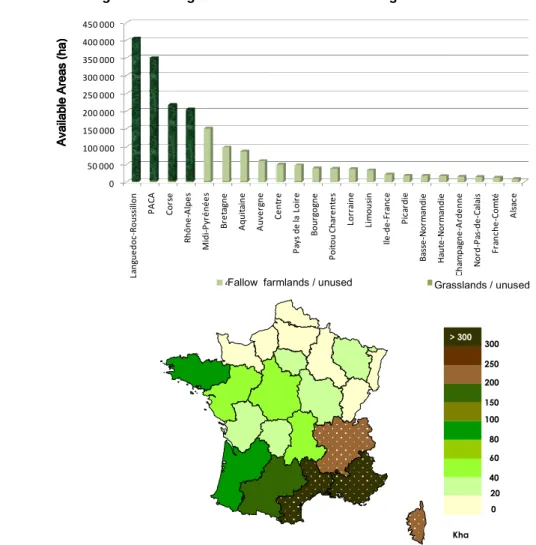
Figure 10 – Regional distribution of areas eligible for afforestation projects
0 50 000 100 000 150 000 200 000 250 000 300 000 350 000 400 000 450 000 L a n g u e d o c -R o u ss il lo n P A C A C o rs e R h ô n e -A lp e s M id i-P y ré n é e s B re ta g n e A q u it a in e A u v e rg n e C e n tr e P a y s d e la L o ir e B o u rg o g n e P o it o u C h a re n te s L o rr a in e L im o u si n Il e -d e -F ra n c e P ic a rd ie B a ss e -N o rm a n d ie H a u te -N o rm a n d ie C h a m p a g n e -A rd e n n e N o rd -P a s-d e -C a la is F ra n c h e -C o m té A ls a c e S u rf a ce D is p o n ib le s (h a )
40 Landes friches maquis garrigues / sans usage Fallow farmlands / unused 25 STH / sans usageGrasslands / unused
AAAAv ai la bl va ila bl va ila bl va ila bl e e e e Ar ea s (h a) Ar ea s (h a) Ar ea s (h a) Ar ea s (h a) > 300 250 300 150 200 80 100 40 60 20 0 Kha > 300
In the histogram, the darker regions correspond to the four regions in which "fallow lands" are excluded for the "conservative" estimate, which are dotted in the map
Source: CDC Climat Research on the basis of SCESS data (TERUTI 2008 Survey).
Physical categories / unused Metropolitan France (in ha)
Surfaces always planted (except mountain pastures) / unused 39,885
Permanent productive grassland 11,847
Permanent unproductive grassland 28,038
Scrub land (maquis, garigue) / unused 1,909,958
Fallow land, scrubland, maquis, garigue, savannah 1,617,023
Naturally planted areas, unused 292,935
The national afforestation potential is therefore estimated at between 770,000 ha (conservative) and 1,930,000 ha (optimistic). In Table 5 the realism of the afforestation scenarios (Pol1 etc.) is estimated via the number of years after which the scenario achieves the quantity of land available for afforestation. The two most ambitious scenarios (Pol5 and Pol8) seem to be rapidly limited by the quantity of land available, which makes them doubtfully realistic in the long term.
Table 5 – Limit implementation periods of the afforestation scenarios (years)
Afforestation Policies Optimistic Scenario Conservative Scenario Pol1 10 000 ha/an 195 77 Pol3 30 000 ha/an 64 26 Pol5 50 000 ha/an 39 15 Pol8 80 000 ha/an 24 10
Source: CDC Climat Research
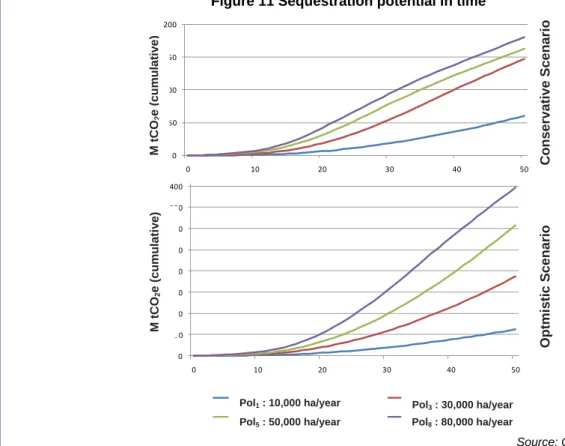
Figure 11 illustrates the national afforestation potential in tonnes of CO2 that could be sequestered. It is determined using the current age-dependent growth rates of European forests, preserving the ratio between softwood and hardwood species in each region. Our computations show a potential sequestration of 5 million metric tons of CO2 in 20 years for the most conservative scenario, i.e. 1% of the country's annual emissions. More details on the computations as well as the results are available in Annex 3.
Figure 11 Sequestration potential in time
0 50 100 150 200 0 10 20 30 40 50 0 50 100 150 200 250 300 350 400 0 10 20 30 40 50 M tC O2 e ( a cc u m u lé e s)
Pol1 10 000 ha/an Pol2 30 000 ha/an Pol3 50 000 ha/an Pol4 80 000 ha/an
Source: CDC Climat Research.
B. Improved forest management projects
The objective of forest management projects is to increase the stock of carbon in a managed forest. The carbon benefit of a project is in fact measured jointly to include the inventory of carbon in the forest and products. To use the Kyoto terminology, these types of projects are those implemented in "forests that remain forests". C o n s e rv a ti v e Sc e n a ri o O p tm is ti c Sc e n a ri o M t C O2 e ( c u m u la ti v e ) M t C O2 e ( c u m u la ti v e )
Pol1 : 10,000 ha/year Pol3 : 30,000 ha/year
Several types of forest management projects can be considered: substitution of species, modification of rotation length, densification of stands, conversion of a coppice into an uneven-aged high forest stand, phosphorus fertilization, etc. These projects have an impact on the productivity of forests and therefore on the sequestration capacity in the ecosystem. Three sample projects are analyzed: the conversion of a coppice into an uneven-aged high stand, the densification of a pine plantation and the substitution of species.
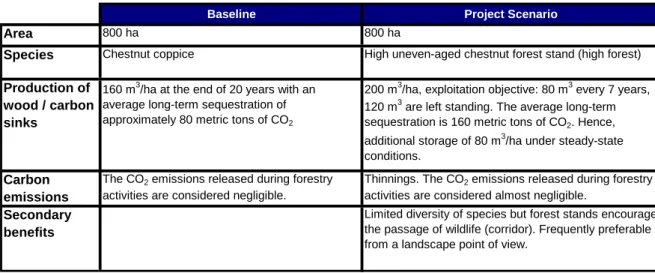
Example 3: Conversion of a chestnut coppice into an uneven-aged forest stand
The project consists of moving from a coppice system into an uneven-aged high stand which bears 200 m3 of wood per hectare. The exploitation objective is set at 80 m3/ha approximately every 7 years, so that 120 m3 are left standing. This management practice makes it possible to produce more wood than by managing the stand as a coppice (210 m3/ha in 21 years instead of 160 m3/ha in 20 years) while preserving a higher forest stock than in the baseline. It is nevertheless more expensive because it requires more frequent and more technical forestry intervention.
Because the wood produced by the "project" scenario has an average diameter greater than the baseline, the project provides more sawlog wood that sequesters more carbon in time.
Table 6 – Project scenarios - conversion of chestnut coppice into an uneven-aged high stand
Baseline Project Scenario
Area 800 ha 800 ha
Species Chestnut coppice High uneven-aged chestnut forest stand (high forest) Production of
wood / carbon sinks
160 m3/ha at the end of 20 years with an average long-term sequestration of approximately 80 metric tons of CO2
200 m3/ha, exploitation objective: 80 m3 every 7 years, 120 m3 are left standing. The average long-term sequestration is 160 metric tons of CO2. Hence,
additional storage of 80 m3/ha under steady-state conditions.
Carbon emissions
The CO2 emissions released during forestry
activities are considered negligible.
Thinnings. The CO2 emissions released during forestry
activities are considered almost negligible. Secondary
benefits
Limited diversity of species but forest stands encourage the passage of wildlife (corridor). Frequently preferable from a landscape point of view.
Source: CDC Climat Research.
The calculations are performed for the sequestration in the standing wood (forest stocks), the extended carbon storage in wood products and the substitution of materials.
As shown in Figure 12, the forest stock is increased in the project scenario as well as in the wood products stocks. The material substitution effect is taken into consideration for purposes of illustration in the project scenario, because in practice, the chestnut tree is seldom used for the production of beams. Harvested wood from the coppice baseline is considered to be mainly pulpwood not qualified for this purpose.
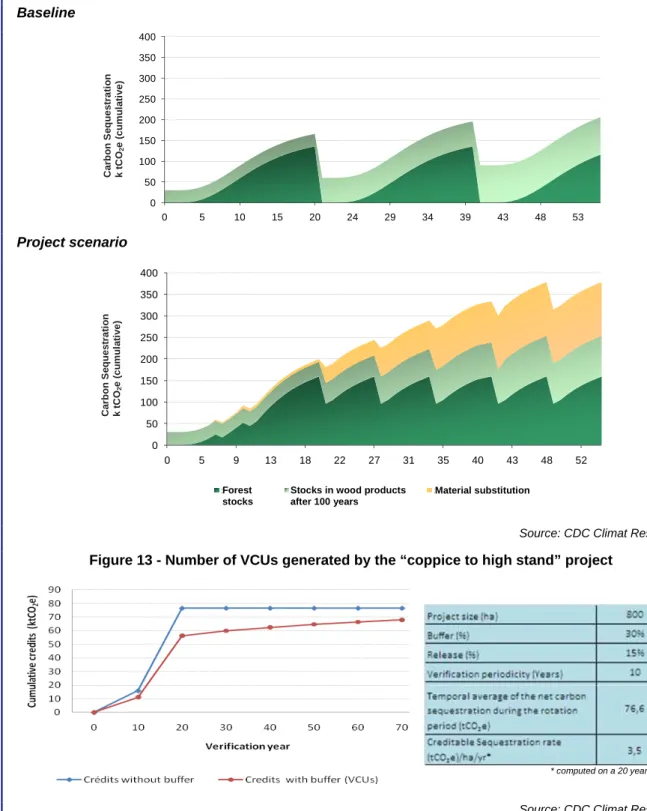
Figure 13 illustrates the quantity of VCS credits generated by the project, which stops increasing at the 20th year, for the same reason as project 1. By year 20, the number of generated credits reaches 56,000 VCUs, once the credits placed in the buffer have been discounted. Moreover, if further verifications take place, confirming that the project’s risks have been controlled, the project can earn up to 62,500 VCUs at the end of the 40th year once credits in the buffer have been released.
Climate Report No. 20 - Getting carbon value out of the forestry and wood sector in Annex I countries: the French example
Figure 12 – Evolution of carbon sequestration of the “coppice to high stand” project
Baseline 0 50 100 150 200 250 300 350 400 0 5 10 15 20 24 29 34 39 43 48 53 S é q u e s tr a ti o n C a rb o n e (k tC O2 e ) C a rb o n S e q u e s tr a ti o n k t C O2 e ( c u m u la ti v e ) Project scenario 0 50 100 150 200 250 300 350 400 0 5 9 13 18 22 27 31 35 40 43 48 52 S é q u e s tr a ti o n C a rb o n e (k tC O2 e ) C a rb o n S e q u e s tr a ti o n k t C O2 e ( c u m u la ti v e )
Stock Forêt Stock produits bois à 100 ansStocks in wood products Substitution Matériaux after 100 years
Material substitution Forest
stocks
Source: CDC Climat Research.
Figure 13 - Number of VCUs generated by the “coppice to high stand” project
* computed on a 20 year basis
Source: CDC Climat Research.
Example 4: Energy densification project
This forest management technique intends to increase the production of energy wood during the initial growth phase of the stand. This theoretical project imagines a partnership between a large power company and a forestry cooperative. The objective is to increase the productivity of maritime pine plantation by adding one row of pines to the planting at the initial stage, which will be cut after eight years to supply the wood-energy industry. More details on the project are provided in Table 7.
Table 7 – Scenarios of the energy densification project
Baseline Project Scenario
Area 1000 ha 1000 ha
Species Maritime pine Maritime pine
Type of management Maritime pine plantation Overstocked maritime pine plantation (during young ages)
Production of wood / carbon sink
Sequestration in the forest by the planting of conifers until clear cutting. Total production of 622 m3 of wood throughout the project cycle.
Production of 622 m3 of wood throughout the project cycle, plus 14 m3 wood/ha at the end of eight years, i.e. 14 t of CO2/ha.
Carbon emissions Forestry work (negligible) Forestry work (negligible)
Secondary benefits None
Source: CDC Climat Research.
Figure 14 illustrates the evolution of carbon sequestration in the different compartments for the baseline and for the project scenario. We observe a slight increase of the forest stocks as well as a small boost of the energy substitution slot.
Figure 14 – Carbon sequestration in the overstocking project
Baseline
Project scenario
Source: CDC Climat Research.
Figure 15 illustrates the estimated credits generated by project under the hypothesis that the verifications are performed every 5 years. The overall project will generate a total of 700 VCUs (taking into consideration the number of discounted credits placed in the buffer) over a period of 40 years.
Figure 15 – Number of VCUs generated by the densification project 1000 30% 15% 5 760,1 0,1 Creditable Sequestration rate
(tCO2e)/ha/yr* Project size (ha) Buffer (%) Release (%)
Verification periodicity (Years) Temporal average of the net carbon sequestration during the rotation period (tCO2e)
*computed on a 5 year basis
Source: CDC Climat Research. Example 5: Species change project
In forestry, one of the measures to adapt to climate change will be related to a change in the choice of species. Beech, for example, risks being replaced by oak in the majority of its territory. However, the choice of species can also impact the carbon sequestration capacity of a stand by means of the following factors: 1) Growth speed, 2) Density of the wood, 3) Rooting pattern, 4) Life expectancy and 5) Vulnerability to natural factors.
The hypothetical project scenario here consists of the use of a more productive variety of maritime pine than the one used in the baseline. This substitution of species increases both the forest and wood product stocks, by increasing the amount of saw log wood.
Table 8 – Scenarios of the species change project
Baseline Project scenario
Area 100 ha 100 ha
Species M aritime pine M o re(genetic impro vement)pro ductive maritime pine
Type of m anagem ent Ro tatio n o ver 40 years Ro tatio n o ver 40 years
Production of w ood / carbon sink
Lumber o bjective: 250 trees/ha
250 m3/ha in 40 years, i.e. 250 tCO 2/ha
Lumber o bjective: 300 trees/ha
350 m3/ha in 35 years, i.e. 350 t CO 2/ha
Carbon em issions Co nsidered negligible. Co nsidered negligible.
Co-benefits No ne
Source: CDC Climat Research
Figure 16 illustrates the quantity of CO2 sequestered by the project in the different compartments. Figure 16 – Carbon sequestration in the species change project
Figure 17 illustrates the evolution of the quantity of VCUs generated by the project. At the end of 40 years, the project generates 3,400 VCUs once the credits placed in the buffer have been discounted.
Figure 17 - Number of VCUs generated by the species change project
Source: CDC Climat Research.
National potential for forest management projects
Our estimate of the national potential for the conversion of coppice systems into uneven-aged stands is based on figures by Barthod (Table 9). The categories in question are coppice systems to be transformed, i.e. those that require clear-cutting followed by replanting, and the coppice forests to be improved, i.e. those that can be transformed without clear-cutting.
Table 9 – Areas eligible for upgrading by conversion, transformation and improvement of forest management
Forestry inter-regions, used by Barthod (2001) and identified by the public authorities and industry federations: Massif central and Northern Alps (Limousin, Auvergne and Rhône Alpes), Northeast (Champagne-Ardenne, Lorraine, Alsace, Bourgogne and Franche Comté) Northwest (Haute Normandie, Basse Normandie, Bretagne, Poitou Charentes, Centre, Nord-Pas de Calais, Picardie and Île de France), Southeast (Provence-Alpes-Côte d’Azur and Languedoc - Roussillon) and Southwest (Aquitaine and Midi-Pyrénées).
Source: CDC Climat Research based on data: (1) Results of Departmental Forestry Inventories between 1989 and 2004 centralized by the IFN and (2) Barthod (2001). According to Barthod (2001), 3.64 million hectares of forests can be improved via projects that convert and improve coppices and coppice with standard, i.e. 27% of French forests. These estimates are consistent with the potential of 30% of the French forest found by De Galbert (2007). The annual objectives for the transformation and improvement of coppice given by Barthod (Table 10) do not seem unrealistic considering this large potential (Table 11).
Areas in France (1) in hectares
Areas in coppice forests to be improved, in hectares (2) Forestry Inter-region Hardwood forest stands (A) Coniferous forest stands (B) Hardwood coppice (C) Mixture of hardwood forest stands and coppice (D) Mixture of coniferous forest stands and coppice (E) Total (A) + (B) + (C) + (D) + (E) Conversion to forest stands (C) + (D) + (E) % conv. Improv. by planting (C) + (D) + (E) % Impr. % total Massif central and Northern Alps 578 425 976 505 414 632 377 071 172 277 2 518 911 140 000 15% 250 000 26% 15% Northeast 964 934 768 947 175 057 1 399 383 74 022 3 382 343 340 000 21% 1 130 000 69% 43% Northwest 925 016 444 790 421 382 904 108 138 744 2 834 040 260 000 18% 860 000 59% 40% Southeast 223 393 877 358 602 969 68 368 227 120 1 999 208 50 000 6% 130 000 14% 9% Southwest 632 951 1 093 107 450 964 513 829 139 285 2 830 137 350 000 32% 130 000 12% 17% Metropolitan France 3 324 719 4 160 708 2 065 004 3 262 760 751 448 13 564 638 1 140 000 19% 2 500 000 41% 27%