HAL Id: hal-02556703
https://hal.uca.fr/hal-02556703
Submitted on 20 May 2020
HAL is a multi-disciplinary open access
archive for the deposit and dissemination of
sci-entific research documents, whether they are
pub-lished or not. The documents may come from
teaching and research institutions in France or
abroad, or from public or private research centers.
L’archive ouverte pluridisciplinaire HAL, est
destinée au dépôt et à la diffusion de documents
scientifiques de niveau recherche, publiés ou non,
émanant des établissements d’enseignement et de
recherche français ou étrangers, des laboratoires
publics ou privés.
Distributed under a Creative Commons Attribution - NonCommercial - NoDerivatives| 4.0
Brain Stimulation in Movement Disorders
Dorian Vogel, Ashesh Shah, Jerome Coste, Jean-Jacques Lemaire, Karin
Wårdell, Simone Hemm
To cite this version:
Dorian Vogel, Ashesh Shah, Jerome Coste, Jean-Jacques Lemaire, Karin Wårdell, et al.. Anatomical
Brain Structures Normalization for Deep Brain Stimulation in Movement Disorders.
Neuroimage-Clinical, Elsevier, 2020, 27, pp.102271. �10.1016/j.nicl.2020.102271�. �hal-02556703�
Contents lists available atScienceDirect
NeuroImage: Clinical
journal homepage:www.elsevier.com/locate/ynicl
Anatomical brain structures normalization for deep brain stimulation in
movement disorders
Dorian Vogel
a,b,⁎, Ashesh Shah
a, Jérôme Coste
c,d, Jean-Jacques Lemaire
c,d, Karin Wårdell
b,
Simone Hemm
a,baInstitute for Medical Engineering and Medical Informatics, School of Life Sciences, University of Applied Sciences and Arts Northwestern Switzerland, Hofackerstrasse 30,
4132 Muttenz, Switzerland
bDepartment of Biomedical Engineering, Linköping University, SE-581 85 Linköping, Sweden
cUniversité Clermont Auvergne, CNRS, SIGMA Clermont, Institut Pascal, F-63000 Clermont-Ferrand, France
dService de Neurochirurgie, Hôpital Gabriel-Montpied, Centre Hospitalier Universitaire de Clermont-Ferrand, 58 rue Montalembert, F-63003 Clermont-Ferrand Cedex 1,
France
A R T I C L E I N F O
Keywords:
Deep brain stimulation (DBS) Patient normalization Template Group analysis Image registration Thalamus Atlas A B S T R A C T
Deep brain stimulation (DBS) therapy requires extensive patient-specific planning prior to implantation to achieve optimal clinical outcomes. Collective analysis of patient’s brain images is promising in order to provide more systematic planning assistance. In this paper the design of a normalization pipeline using a group specific multi-modality iterative template creation process is presented. The focus was to compare the performance of a selection of freely available registration tools and select the best combination. The workflow was applied on 19 DBS patients with T1 and WAIR modality images available. Non-linear registrations were computed with ANTS, FNIRT and DRAMMS, using several settings from the literature. Registration accuracy was measured using single-expert labels of thalamic and subthalamic structures and their agreement across the group. The best performance was provided by ANTS using the High Variance settings published elsewhere. Neither FNIRT nor DRAMMS reached the level of performance of ANTS. The resulting normalized definition of anatomical struc-tures were used to propose an atlas of the diencephalon region defining 58 strucstruc-tures using data from 19 pa-tients.
1. Introduction
Deep brain stimulation (DBS) is established for routine therapy of movement disorders such as Parkinson’s disease (PD), essential tremor (ET) and dystonia (Coubes et al., 2002). Over the years, new brain targets for stimulation have been proposed by observing the modula-tion of symptoms and new condimodula-tions are explored with DBS (Hariz et al., 2013). Thereby different hypotheses on the mechanisms of action were suggested (Herrington et al., 2015), but none of them provides rationale for all the multiple phenomena observed in the clinic (Hariz, 2017; Hemm and Wårdell, 2010). Lastly, the introduction of new sti-mulation devices with increased number of contacts for stisti-mulation participated to make surgical planning more complex.
A source of information to provide assistance during surgical plan-ning is group analysis of brain images from patients. The goal is to draw
conclusions that can be generalized and applied to new patients i.e. for planning of surgeries. An important point in this process is the possi-bility to analyze the data from different patients in the same anatomical space. Anatomical atlases based on histology (Morel, 2007; Schaltenbrand, 1977; Talairach and Tournoux, 1988) have been used for a long time as assistance during planning as they provide outlines of the different structures of the deep brain. Because of their creation methodology (trimming, small number of specimen), they are not sui-table to proceed to anatomical normalization of patients. Magnetic re-sonance imaging (MRI) is a way to circumvent this issue and allows the creation of structural brain templates from large cohorts. The works at the Montreal Neurological Institute are a good example: the templates produced over the years present iterative improvement in methodology (Fonov et al., 2009; Grabner et al., 2006; Mazziotta et al., 2001) as well as focus on specific populations (Fonov et al., 2011; Xiao et al., 2017).
https://doi.org/10.1016/j.nicl.2020.102271
Received 14 January 2020; Received in revised form 9 April 2020; Accepted 20 April 2020
⁎Corresponding author at: Institute for Medical Engineering and Medical Informatics, School of Life Sciences, University of Applied Sciences and Arts Northwestern
Switzerland, Hofackerstrasse 30, 4132 Muttenz, Switzerland.
E-mail addresses:dorian.vogel@fhnw.ch(D. Vogel),asheshashah@gmail.com(A. Shah),jerome.coste@uca.fr(J. Coste), jjlemaire@chu-clermontferrand.fr(J.-J. Lemaire),karin.wardell@liu.se(K. Wårdell),simone.hemm@fhnw.ch(S. Hemm).
NeuroImage: Clinical 27 (2020) 102271
Available online 25 April 2020
2213-1582/ © 2020 Published by Elsevier Inc. This is an open access article under the CC BY-NC-ND license (http://creativecommons.org/licenses/BY-NC-ND/4.0/).
However, the commonly available MRI-based anatomical atlases base their segmentation on histology atlases, especially for structures in the deep brain. Furthermore, large numbers of patients introduce several difficulties regarding the homogeneity of image data across the cohort (Ou et al., 2014) and the sharpness in the center of the brain. Those shortcomings are the important reasons that make anatomical analysis of collections of patient images difficult.
The major burden in the creation of an anatomical template of the thalamus and sub-thalamic areas is certainly the difficulty to identify those structures from anatomical MRI, and to obtain accurate seg-mentation of those structures. Within the present study, the availability of extensive manual segmentation of anatomical labels (Lemaire et al., 2010; Zerroug et al., 2016) allows the assessment of the performance of image-based non-linear registration tools in the deep brain. The aim of this study was to evaluate a selection of existing image registration implementations with the task of normalizing the anatomy of the deep brain to setup a workflow to normalize the deep brain anatomy of 19 patients operated on with DBS. The manually segmented deep brain structures were used as control to measure registration accuracy.
2. Materials and methods
2.1. Patients
The data presented in this study was obtained from the Department of Neurosurgery, University Hospital of Clermont-Ferrand, France. The patient group consists of 19 patients (age: 50–84) who underwent DBS surgery and gave written informed consent (ethics approval: 2011-A00774-34/AU905). It consists of 13 patients admitted for PD and six for ET. All received bilateral DBS implantation.
Two of the PD patients were implanted in the ventro-intermediate nucleus (VIM) and 11 in the subthalamic nucleus (STN). All six ET patients were implanted in VIM.
2.2. Imaging, labeling and DBS surgery protocol
The implantation of a DBS lead is done in a two-day procedure. On the first day, the stereotactic frame (Leksell G frame, Elekta AB, Sweden) is attached to the patient’s skull under local anesthesia. The frame is anchored using fiber-glass rods positioned on the surface of the skull with blind holes (Re-positioning kit, Elekta AB, Sweden). The fiducial box is then mounted on the frame (Fiducial box, Elekta AB, Sweden) for the acquisition of ste-reotactic T1 MRI (0.63 mm × 0.63 mm × 1.30 mm) and steste-reotactic white matter attenuated inversion recovery imaging (WAIR, 0.53 mm × 0.53 mm × 2.00 mm) (Lemaire et al., 2007; Magnotta et al., 2000) (Sonata, 1.5T, Siemens, Germany). The frame is removed, and the DBS lead implantation is planned using iPlan Stereotaxy 3.0 (Brainlab AG, Munich, Germany). This routinely includes the manual delineation and labeling of substructures of the thalamic and subthalamic areas (between 26 and 37 per patient) based on the MR images. All procedures were performed by the same neurosurgeon (JJL).Fig. 1shows a visualization of the MR image set, superimposed with the expert-labeled deep brain structures and the trajectory defined by entry and target points for an in-dividual patient. The list of deep brain structures segmented by the expert across the patient group and their corresponding names and occurrence in this specific data-set is provided inTable 1. On the following day and under local anesthesia, the stereotactic frame is re-positioned and pre-operative stereotactic computer tomography (CT, 0.59 mm × 0.59 mm × 1.25 mm) is acquired. Prior to implantation, different electrode positions are eval-uated with the help of micro-electrode recording (MER) (Alpha Omega Engineering, Nazareth, Israel) and intraoperative test stimulation revealing the efficacy of stimulation on the symptoms and side effects. Based on these results, the lead (Medtronic 3389, Medtronic, USA) is implanted at the most suitable position. The final placement of this lead along the trajectory is checked with projection X-ray (MPS64, General Electrics, Boston USA). Once the electrodes have been implanted and the scalp sutured,
post-operative stereotactic CT is acquired in order to verify the position of the electrode and the absence of any bleeding. Extensive description of the protocol can be found inVassal et al. (2012).
2.3. Normalization workflow of deep brain anatomy
The workflow (Fig. 2) starts with the export from the planning software and preparation of the data (Fig. 2A). A linear registration of all images to a common reference system (Fig. 2B) is necessary as a starting point before non-linear registration. This step is needed to minimize the displacement to be done by the non-linear registration algorithm (Fig. 2C), which allows finer anatomical details to be re-tained. The three registration tools selected were ANTS (Avants et al., Fig. 1. Result of the planning for a DBS implantation. A slice of the WAIR anatomical image is presented together with the 3D representation of the deep brain structures manually segmented by the neurosurgeons used to decide on the trajectories for the stereotactic implantation (blue). (For interpretation of the references to colour in this figure legend, the reader is referred to the web version of this article.)
Table 1
List of the deep brain structures labeled in the dataset and their occurrences in the left and right hemispheres.
Structure name Count left Count right Corpus geniculatum Lateral 19 18 Corpus geniculatum Medial 18 2
Fields of Forel 18 12 Medial Leminiscus 17 18 Mamillothalamic Tract 12 19 Mammillary Body 11 18 Anterolateral Nucleus 11 8 Peripeduncular Nucleus 11 11 Red Nucleus 11 11 Substancia Nigra 11 11
Fascicle Q of Sano (Lemaire et al., 2019) 11 11
Subthalamic Nucleus 11 11 Arquate Nucleus 11 11 Zona Incerta 8 11 Pre-Leminiscal Radiation 8 7 Anterolateral Thalamus 8 11 Anteromedial Thalamus 8 8 Dorsolateral Thalamus 8 8 Dorsomedial Thalamus 8 8 Intermediolateral Thalamus 8 8 Center Median Thalamus 8 8
Oral Thalamus 8 1
Parafascicular Thalamus 8 8
Medial Thalmus 8 8
Pulvinar Thalamus 8 8
Ventrocaudal lateral Thalamus 8 8 Ventrocaudal medial Thalamus 7 8 Ventrointermediate Thalamus 2 8
2010a), FNIRT (Andersson et al., 2007) and DRAMMS (Ou et al., 2011). The results produced by each of them were compared (Fig. 2D) using the labeled anatomical structures as metric. The different steps are described in detail in the following sections and were implemented with the help of the nipype Python module (Gorgolewski et al., 2011).
2.3.1. Data export and preparation
For each patient, images, labels of the deep brain structures, entry and target points were exported (Fig. 2A) from the iPlan Cranial (ver-sion 2.0, Brainlab AG, Munich, Germany) software planning station. This was done using the OpenIGTLink network protocol (Tokuda et al., 2009) implemented in the SlicerIGT (Ungi et al., 2016) plug-in for 3DSlicer (slicer.org, v4.8.1, Fedorov et al., 2012). The labels corre-sponding to the manual segmentation of deep brain structures by the neurosurgeon were extracted as binary images (masks). The size of each mask corresponds to the smallest box, which encloses the label (bounding box); the voxel dimensions are the same as in the WAIR image. To ensure homogeneous naming of structures across patients
and organization of the dataset, the exported labels were validated based on the metadata obtained from the planning station. This pre-processing was done with Python (python.org) scripts and the Sim-pleITK module (SimSim-pleITK, Insight Software, USA).
2.3.2. Linear atlas creation
The MNI152 6th generation nonlinear T1 group atlas (0.5 mm × 0.5 mm × 0.5 mm) (Grabner et al., 2006) was used as reference for linear registrations (Fig. 2B).Fig. 3presents the linear atlas creation method. T1 images (i ∈ [0,18]) were first skull-stripped using FSL’s Brain Extraction Tool (BET) and registered using FSL’s FLIRT to the skull-stripped MNI152 template using 12 degrees of freedom (dof) registration. To create an anatomical T1-led (the T1 contrast drives the registration) T1 Linear template and a T1-led WAIR Linear template of the group, the transformed anatomical images were averaged. Cumulative definition for each anatomical structure was created by normalizing intensities and summing across patients in template space. The transformed skull-stripped images were cropped to Fig. 2. Top-level workflow description of the group normalization procedure. After preparation of the surgery on the planning station by the neurosurgeon, the data is exported and prepared (A). Data is first aligned on the MNI152 template with linear registration based on the T1 contrast (B). Aligned images are then non-linearly warped with three different tools (C) in order to compare the results achieved in the deep brain region by each tool (D).
the bounding box of the T1 linear atlas. This reduced the size of images, and in turn the processing times in the following steps.
2.3.3. Non-linear atlas creation
With the goal to produce an optimal average brain anatomy (Fig. 2C) for a group of patients, a method based onAvants et al., (2010b)and depicted inFig. 4was used. It was implemented in a two-step, multi-modality, deep brain focused pipeline (Fig. 4A). The single-modality iterative template creation method (Fig. 4B) minimizes bias of the final anatomical atlas toward any registration reference external to the group by creating a new reference image iteratively. Each iteration (Fig. 4) of the registration uses one image modality to lead the regis-tration (active image set) to a reference. An affine (12 dof) regisregis-tration followed by a non-linear registration are determined. The warped images are then averaged to create a temporary template of the group. The affine transforms and warp fields obtained for each patient are averaged across patients, inverted, scaled, combined and applied to the temporary template, resulting in an updated template (Fig. 4D). The updated template is then used as the new reference for the next itera-tion. By repeating this process four times (Fig. 4B), using each refreshed template as reference for the next iteration, the method converges to-ward an optimal template of the group.
In our case, the first reference provided was the linear T1 template previously created as described in 2.3.2. T1 image data-sets from all patients were successively used as active images for creating a T1-led
template. This was repeated four times and resulted in a template for each modality after each iteration denoted T1T1
0→3and WAIRT10→3and the
associated labels denoted LabelsT1 0→3.
In the last template space created, the volume of interest (VOI) enclosing the labels from all structures was selected and extended by 50% to avoid border effects. Patient image data-sets were cropped to the VOI and the iterative template creation was repeated, using WAIRT1
3
as first registration reference, and the cropped WAIR volumes as active image data-sets. The method was iterated four times (Fig. 4B), resulting in four WAIR-led non-linear templates (Fig. 4A) per modality denoted T1WAIR
0→3 and WAIRWAIR0→3 and their associated labels, LabelsWAIR0→3.
All the processing was run on a 32-core AMD 2990WX 3.80 GHz workstation equipped with 128 GB of RAM running Debian Linux (debian.org). All the tools and software were setup in a docker en-vironment based on the NeuroDocker project (https://github.com/ kaczmarj/neurodocker). Most of the normalization processing time was spent in this non-linear atlas creation step. Time required to run the non-linear normalization step (Fig. 4C) was collected for each run and used as a comparison metric between the tools and settings.
2.3.4. Registration tools and parameters selection
The normalization methodology was applied with three different non-linear registration tools to compare performance for the specific registration scenario of normalizing the deep part of the brain.
Among the different registration tools evaluated in the reports from Fig. 3. Linear patient registration as a prealignment for the non-linear registrations. The skullstripped T1 image from each patient is registered to the skullstripped MNI152 template using FLIRT with 12 degrees of freedom (dof). The resulting transformation matrix is then applied to the WAIR image and each anatomical structure label. Transformed anatomical images are then averaged for each modality to create a T1 and a WAIR linear atlas, while the labels are summed for each structure to create cumulative definitions of the labels.
Klein et al. (2009),Ou et al. (2011)andKeszei et al. (2016), ANTS, FNIRT and DRAMMS were selected for evaluation.
•
ANTS (Avants et al., 2010a) provides an implementation of the Symmetric Normalization method. It uses diffeomorphic transfor-mations that preserve topology, even when transfortransfor-mations are composed. A linear penalty is applied to those deformations during optimization, making both small and large deformation possible. Moreover, the components of the transformations are split in two parts dependent on the two images to be registered, resulting in a symmetric optimization toward a midway solution.•
FNIRT (Andersson et al., 2007) uses a Cubic B-spline deformation model and optimizes the Sum of Squared Differences (SSD) of image intensities in order to compute a transformation.•
DRAMMS (Ou et al., 2011) uses texture information with Gabor filters applied on moving and reference images in different or-ientations and with central frequencies to measure the similarity between images. The set of Gabor filters used in fine during the re-gistration is optimized in order to use only the most appropriate set of filters, enabling multi-modality registration. Mutual-Saliency is used to weight the volume based on the similarity metric. This al-lows to relax the optimization in areas where differences are more important e.g. lesions, tumor, missing tissue, cysts.For each of the tools under test, the default settings were evaluated. For ANTS, the setting used in the MultiModalityTemplateContruction2 (Avants et al., 2010b) script were considered as the default settings as none are set by default in the registration program. For FNIRT and DRAMMS the settings documented in their respective help command were used. When applicable, the settings fromKlein et al. (2009)i.e. only ANTS and FNIRT were used. To this selection we added the two best performing settings for ANTS fromEwert et al. (2019)called “Low Variance” and “High Variance”. The interpolation methods for all transformations was set to BSpline interpolation, after comparison by the expert of the anatomical templates created with trilinear and BSpline interpolation. The resulting calls to each registration software are summarized in Appendix A1. Structure labels were transformed using trilinear interpolation after observing Runge’s phenomenon when using BSpline interpolation due to the binary nature of those images.
2.4. Normalization comparison
In order to quantitatively evaluate the precision of each of the se-lected registration tools in a comparative way, intra-atlas assessment was conducted. The comparisons were done in 3D using the Dice coefficient (DC) (Dice, 1945) and Mean Surface Distance (MSD). The Dice coefficient aims to measure the overlap between two volumes (A Fig. 4. Non-linear atlas creation workflow: A. The template is created in a two-step iterative registration process. In the first step, the T1 images lead the registration (active image set) while the WAIR and label images are passively transformed in the new reference system. After this step, a volume of interest centered on the deep brain region is selected. In the second step, the WAIR images are used as active set and the T1 and label images are passively transformed. B. Each of these two iterative template creations consists in registering the active anatomical images from each patient to a reference. The first reference for the T1-led non-linear normalization is the Linear template (Fig. 3). C. Each registration iteration uses the selected active image to register it to the current reference. D. The resulting warped active images are averaged to create a temporary template. The latter is warped with the inverse average affine transform composed with the inverse average non-linear warp to create the updated template. All the transforms are composed to create a transform for each patient from the original images to the updated template that allows transforming the passive images to the updated template space.
and B) and is defined as: = + DC vol A B vol A vol B 2 ( ) ( ) ( ) (1)
A DC value of 1 corresponds to an exact overlap of the two labels, and a value of 0 corresponds to an absence of overlap. The MSD was used as additional metric in order to have information about the re-lative position of the surfaces of the volumes compared (structure de-finitions). The MSD is the mean of the shortest distance from each point on the contour of one structure to any point of the contour of the other.
= + MSD A B min dist a b 1 ( , ) a A b B, (2)
After transformation to template space, the labels for each structure were compared in a cross-validation fashion. For each patient, each structure was compared to the definition of the same structure in each of the other patients.
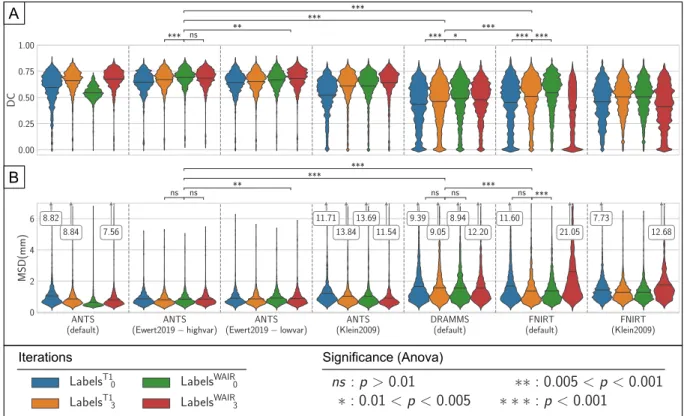
Violin plots (Hintze and Nelson, 1998) were used to present the distribution of DC and MSD of the labeled structures from all patients (Table 1) for the three registration tools with the different settings. In short, the profile of the violin plots are histograms smoothed with a Gaussian kernel. A kernel bandwidth of 0.05 and 0.1 was used for DC and MSD plot, respectively. The violin plots were used to compare the tools and their respective settings in order to identify the best combi-nation. Only a subset of the labels available was considered, namely only the largest and most visible labels in order to minimize the effects of individual variability and smoothing during the registration steps and thus make it easier to detect differences in the visualization be-tween samples. The structures are the following: the Anterolateral Thalamus, the Dorsolateral Thalamus, the Medial Thalamus, the Pul-vinar Thalamus, the Anterolateral Nucleus, the Corpus Geniculatum Lateral, the Mammillary Body, the Red Nucleus, Substancia Nigra and the Sub-Thalamic Nucleus.
One-way Anova testing was employed to compare DC and MSD between the different iterations of the atlas creation process for each non-linear registration tool to estimate the significance of the difference observed in the violin plots. Significance of the one-way Anova testing is presented above the violin plots. We present the significance for the test:
•
for the best iteration with the best setting for each tool and the previous iteration (LabelsT13) as well as the last iteration (LabelsWAIR3 )
•
across the best iterations of the best setting for each tool•
between the best iteration with ANTS with the high variance set-tings and the best iteration with the low variance setset-tings In order to provide insights in the influence of the high disparity in contrast profile from the structures in the deep brain, the performance of the registration for the best normalization result identified was compared across all structures, namely ANTS with the “high variance” setting at the first iteration of the normalization with the WAIR mod-ality. The results are presented again as violin plots with the same bandwidth settings as previously.Lastly, in order to provide a more visual and qualitative re-presentation of the normalization results, the cumulative definition of structures is overlaid to the anatomical template images. The cumula-tive definition of several anatomical structures are however difficult to visualize at the same time, because of the number of structures in this dataset, and the overlap of the heatmaps in their peripheral parts. To make this visualization possible, the cumulative definitions are resolved into binary labels using a relative threshold set to 50% of the max in-tensity in each heatmap. This is equivalent to majority voting across patients on the inclusion of a voxel in a label class.
3. Results
Results for each registration tool with their respective settings and the successive iterations of the normalization process are presented in this section.
3.1. Quantitative evaluation
Fig. 5presents the results of intra-atlas assessment for each com-bination of registration tool and settings tested as violin plots for a subset of all the anatomical structures. The mean in each sample is marked with a black horizontal line. For ANTS, the two best performing settings are the settings fromEwert et al. (2019). The high variance settings present the best result after the first iteration using the WAIR modality (LabelsWAIR
0 ) with a DC of 0.691 and MSD of 0.831 mm. The
results exhibit changes of strong significance (p < 0.001) in DC and no significance in MSD with the previous iteration (LabelsT1
3) but no
sig-nificant changes (p > 0.01) in neither DC nor MSD with the last iteration (LabelsWAIR
3 ). The results from the low variance settings reach
their maximum after the last (fourth) iteration using the WAIR modality (LabelsWAIR
3 ) with DC and MSD of 0.682 and 0.880 mm respectively. The
difference between the best iterations of those two results have differ-ences of medium significance (0.005 < p < 0.001) in both DC and MSD. Neither the Default nor the Klein settings (Klein et al., 2009) reach the performance of the settings fromEwert et al. (2019), while they surpass both FNIRT and DRAMMS in DC and MSD results. With the settings from Klein, the mean DC values produced by ANTS only im-prove from 0.521 to 0.642 between the first and the last iteration of the normalization.
With FNIRT, mean DC values decrease after the first iteration using the WAIR modality for both settings (Default: 0.544 to 0.377, Klein: 0.505 to 0.413). The best result for FNIRT is reach with the default settings, after the first WAIR iteration, with a DC and MSD of 0.544 and 1.371 mm. The difference has strong significance (p < 0.001) in DC and no significance (p > 0.01) in MSD with the previous iteration (LabelT1
3) and high significance (p < 0.001) in both DC and MSD with
the last iteration (LabelWAIR
3 ). Finally, DRAMMS, used with the default
settings is the least performing. The best result is LabelsWAIR 0 ,with an
average DC of 0.491 and average MSD of 1.554 mm. The change in DC with the previous iteration (LabelT1
3 ) are of high significance
(p < 0.001) and are of low significance (0.005 < p < 0.01) with the last iteration (LabelsWAIR
3 ). Changes in MSD are not significant
(p > 0.01) for the same iterations.
The best normalization produced by each tool is thus:
•
ANTS high variance settings, LabelsWAIR0
•
FNIRT default settings, LabelsWAIR 0•
DRAMMS default settings, LabelsWAIR 0Differences across these three results show strong significance (p < 0.001) in both DC and MSD.
Fig. 6presents the DC and MSD values for the best combination of tool, setting and iteration (ANTS, Ewert’s high variance settings,
La-belsWAIR
0 ) as violin plots for all structures present in the data-set. The
structures are ordered on the horizontal axis by descending average DC value. Structures visible on contrast such as Substancia Nigra, Red Nucleus, the Sub-thalamic Nucleus, the Antero-lateral Nucleus and the Mammillary body present high DC values (average DC > 0.6) and low MSD (average MSD < 1 mm). Larger structures such as Medial tha-lamus, the Dorso-lateral Thalamus and the Antero-lateral Thalamus also reach high agreement especially for the MSD. The more elongated structures such as Zona Incerta, Center Median Thalamus, Fields of Forel, Intermedio-lateral Thalmus, Ventro-caudal lateral Thalamus or the Mammillothalamic tract provide intermediate DC and MSD values. Lastly, the worst results are those from the smallest and least visible structures, such as the Arquate Nucleus, Preliminiscal Radiations (PLR),
Ventro-oral Thalamus, Fascicle Q of Sano, Dorso-medial Thalamus (DM), Parafascicular Thalamus (LaPf), Ventro-intermediate Thalamus (VIM) and the Medial Leminiscus (LemMed), where mean DC values are below 0.4 and most of the MSD values above 1 mm, for those small structures that are in the order of a few millimeters in size. Moreover, for both DC and MSD, the spread of the values is important. Lastly a large number of values at 0 of DC for PLR, DM, LaPf, VIM and LemMed expressing the lack of any agreement between patients on the location of those structures can be observed.
3.2. Qualitative evaluation
For visual comparison purposes, a coronal slice from the original WAIR dataset from one PD patient is presented inFig. 7, together with slices of each of the best templates at the location of the largest cross-section of the STN for ANTS, FNIRT and DRAMMS. The three template images (Fig. 7, ANTS, FNIRT, DRAMMS) present much smoother con-trast than the individual patient’s image. Compared to ANTS, both FNIRT and DRAMMS are smoother and present less contrast dynamic, resulting in increased difficulty to identify intensity differences. The superior quality of the template created by ANTS compared to the two others was confirmed by the neurosurgeon after inspection of each volume data-set. The cumulative definition of STN is different across templates, ANTS and FNIRT both have maximum cumulative value of 11, while DRAMMS has 10. The heatmaps differ in their spread in area as well as their intensity profile. The heatmap from ANTS has the highest intensity gradient. This results in a larger volume at higher confidence level compared to FNIRT and DRAMMS. As a result, the areas of low confidence level (yellow) are more important with these tools.
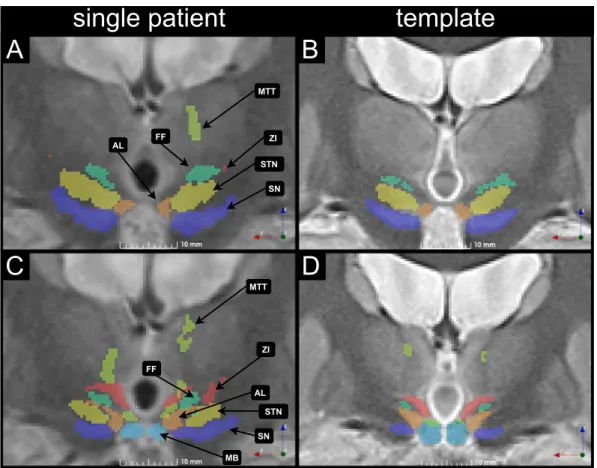
Fig. 8presents a slice of the WAIR image from the same patient as in Fig. 7 transformed in the template space created with ANTS and is presented with the anatomical structures labeled by the expert (Fig. 8A, C). The right side of the figure (Fig. 8B, D) is a representation of a slice
of the anatomical template of the group taken at the same location. Anatomical structures in the template are presented with a confidence level of 50%. Two different coronal positions are presented: the first one (Fig. 8A, B) is located at the slice of largest cross-section of STN, and the second (Fig. 8C, D) at the slice that presents ZI, the FF, the AL nucleus, SN and the MB. Comparatively to the structures defined for a single patient (Fig. 8A, C), the structures in the atlas have smaller vo-lume and as a result the contours of structures have greater distance between each other (Fig. 8B, D). Some voxels associated to a structure in this specific patient are not part of the structure in the final template: for example the most superior part of the left Mammillothalamic tract is much smaller in the template (Fig. 8B, D) than in the patient (Fig. 8A, C). Similarly, voxels in the lateral part of ZI in the patient (Fig. 8C) are absent of the structure in the template (Fig. 8D). Lastly in the case of STN, the second slice (Fig. 8C) shows the occurrence of that structure in this patient, however in the final template (Fig. 8D) this structure is not present, meaning that the patient was an outlier in that regard.
3.3. Processing time
In addition to the qualitative results of the different methods, run times have been recorded (Table 2). For ANTS, both settings fromEwert et al. (2019)were the fastest to proceed to all the 152 registrations with only 15 min of difference between the two settings. However, since the high variance setting reached the best result after the first WAIR iteration and the low variance did after 4 iterations, the result was faster to obtain with the high variance setting. The default settings and those fromKlein et al. (2009)were both slower. FNIRT presented the highest variability with settings, with those from Klein being 9.7 times faster than the default settings. Lastly, DRAMMS in the default settings was slower than the settings fromEwert et al. (2019)but faster than both default settings and settings fromKlein et al. (2009)for ANTS. Fig. 5. Presentation of the results of the normalization using ANTS, FNIRT and DRAMMS. Registration accuracy was measured using the Dice coefficient (DC) (A) and Mean Surface Distance (MSD) (B) between the definition of each structure for each patient and the cumulative definition of the structure in the template. Kernel density estimation bandwidth: DC:0.05, MSD:0.1. p-values for the one-way Anova test results between selected iterations are presented above each plot.
4. Discussion
This study presents the design of a multi-scale, multi-modality iterative non-linear template creation pipeline used to normalize anatomy from patients with focus on DBS. The non-linear component of the pipeline was duplicated in order to compare three different im-plementations and different parameters for those. To compare the performance of the registration tools selected, expert labels were used as silver-standard and the spatial overlap and surface distance of the labels with their group definition were used as metric.
4.1. Group template creation
Several researcher have proposed group templates created from different input data and approaches.Nowinski et al. (2005)normalized MRI from 168 patients who underwent bilateral STN implantation based on Nowinski’s Fast Talairach transformation method. The result was a probabilistic functional atlas of the STN. However, the use of linear transformations as opposed to non-linear transformations is de-scribed as a limitation by the authors of the study. Shattuck et al. (2008)presented the creation of an anatomical template based on T1 images from 40 patients, comparing AIR, FNIRT and SPM5. The study was focused on cortical structures labeled by two different experts and not on the deep brain. The approach only consisted in a single regis-tration of each patient with each regisregis-tration tool under test, to a dif-ferent reference for each tool. Klein et al. (2009) focused on the
performance of non-linear registrations and provided a comparison of 14 non-linear registration tools for patient-to-template registration using cortical structures to measure registration performance. Lalys et al. (2010) created an anatomical template for use in deep brain sti-mulation based on 22 scans from the same individual. They used custom designed registration method, which limit the comparability of their results.Qiu et al. (2010)created a probabilistic definition of 6 subthalamic structures based on the manual segmentation using their own implementation of the registration and shape optimization method.Ewert et al. (2017)created their atlas of the deep brain by semi-automatically segmenting a subset of the structures in the region of interest on 4 modalities simultaneously (T1, T2, Proton Density, and T2 relaxometry) applying a region growing method, with the seeds placed by experts. For the structures indiscernible on any modality, the histological atlas fromChakravarty et al. (2006), after conversion to a pseudo-MRI image, was warped to the previous template, providing a definition of the missing structures. Very recently,Ewert et al. (2019) compared ANTS, FNIRT, SPM12 and the “linear threestep” method implemented in Lead-DBS (Horn et al., 2019). Their comparison was conducted for the task of registering patients to an existing template. The manual segmentation by two different experts of two structures (STN and GPi) per hemisphere served to measure registration accuracy. In contrast to the studies described above, our work describes the creation of a group specific template based on multi-modality non-linear registration using coherent data from a single center and expert (Lemaire et al., 2010), using an imaging modality (WAIR) specially Fig. 6. Results of the normalization with ANTS and the High Variance settings after the first WAIR-based registration. Results for each anatomical structure are presented for both the Dice coefficient (A) and the Mean Surface Distance (B).
designed to enhance contrast in the region of interest of DBS. The method is completely automatic and scalable. The focus was to exploit the richness of the input data, resulting in the definition of 58 structures of the thalamus and basal ganglia together with a structural template of the region of interest for each of the imaging modalities available.
4.2. Registration tool selection
In the present work, we compared the performance of ANTS, FSL’s FNIRT and DRAMMS for the task of creating group-specific templates of the deep brain. The study fromKlein et al. (2009)describes ANTS as the best performer. Based on this conclusion many studies used ANTS and for that same reason, we included it in the comparison. The second tool selected was FSL’s FNIRT considering the popularity of the software package FSL, and lastly, the DRAMMS tool was added as fewer in-formation about its performance could be found. The registration tools were evaluated in their default settings as well as those fromKlein et al. (2009)andEwert et al. (2019) when applicable. The well-established Statistical Parametric Mapping toolbox (SPM, (Ashburner and Friston, 1999)) registration, used in several other studies (e.g. (Ewert et al., 2019; Klein et al., 2009)) was however not used in this work. SPM registration using the “DARTEL” and “Normalize” functions takes a significantly different approach and requires the application of the “NewSegment” function first, which creates a segmentation of the dif-ferent tissues based on a Tissue Probability Map (TPM). The default TPM shipped with the toolbox only defines the white matter, gray matter and CSF areas, which makes registration of the subthalamic area ambitious.Lorio et al. (2016)andEwert et al. (2017)proposed different refined TPM focused on the subthalamic and basal ganglia areas, however defining only a small subset of the anatomical structures available in our dataset. Moreover, the use of this method requires prior information of the subthalamic/basal ganglia area in the form of this
TPM, which makes it difficult to compare with the tools used in the present study in a fair way. However, the result from our study could be an interesting starting point for a TPM defining up to 29 structures in each hemisphere. This TPM would be based exclusively on single expert labeling.
4.3. Registration tool comparison
The results in the intra-atlas assessment presented inFig. 5show that for ANTS, the best setting was the “High Variance” setting from Ewert et al. (2019). The “Low Variance” settings from the same authors produced competing but inferior results. This is in opposition with the results from the same authors who postulated that the “excessive freedom” for the warp field in the high variance setting results in worst performance due to the lack of contrast in the deep brain. On the other hand, the low variance setting leaves “less freedom” for the warp field to allow the influence of the more visible nearby structures to improve the registration of the deep brain area. In our case however, it seems that using the WAIR modality after T1 provides additional information (compared to T1 and T2 used inEwert et al. (2019)) and allows the high variance setting to perform better than the low variance setting, thus, our conclusions are similar to those from Ewert and colleagues.
As expected, the settings fromEwert et al. (2019)surpass both the default settings and the settings fromKlein et al. (2009)none of those two being optimized for multi-modality registration, nor for registra-tion of the deep brain. Moreover, ANTS out-performed FNIRT as well as DRAMMS in all comparisons. This confirms the conclusions fromKlein et al. (2009) and contradicts the conclusions fromOu et al. (2014) presenting DRAMMS as an alternative to ANTS.
A visual comparison of the results of the best settings for each re-gistration tool (Fig. 7) is challenging from an anatomical point of view without highly trained knowledge of the anatomy. The general Fig. 7. Anatomical normalization results. An image from an individual patient is presented for comparison purposes together with the ANTS template withEwert et al. (2019)– high variance settings and one step of WAIR refinement, the FNIRT template created with the default settings and a single WAIR refinement and the atlas created with DRAMMS using the default settings and one WAIR refinement step. Each template slice is presented with the heatmap of the left subthalamic nucleus overlaid. Slices were taken at the largest cross-section of STN.
characteristics of the images are however quite simple to agree on: the normalization process objectively improved the image when compared to the original slice of a single patient. Template images provide higher signal to noise ratio thanks to the inclusion of several samples as op-posed to a single sample for each voxel of the image volumes. They also provide smoother transitions due to the number of samples considered, inter-patient variability, and smoothing steps implicated in each of the registration methods. The most noticeable difference between the templates are the contrast and the anatomical fidelity. Differences in the cumulative definition of structures are easier to interpret; the high gradient for STN in the results from ANTS shows that the tool was successful in matching the structure across patients, and that the re-sulting outline of the structure will be less impacted when increasing the confidence level than in the case of FNIRT and DRAMMS. The result is that for the same confidence level, the definition of STN will be bigger with ANTS than with FNIRT, which will be larger than the de-finition of the structure with DRAMMS.
4.4. Anatomical analysis
Agreement scores for the anatomical structures (Fig. 6) are trasted. Without surprise, the structures that present the highest con-trast on structural images are the ones that present the best scores, as the quantity of information for the registration algorithm to work with is important. In the case of structures that do not present strong con-trasts, they provide intermediate results: bigger structures provide better MSD values, since their shape (more spheric) is more tolerant to small variations due to remaining registration mismatch as well as in-dividual variability. Inversely, the structures with a more elongated shape are more impacted. The smallest and least visible structures provided the worst results in our study due to the lack of information in the image, and the small size of the structures representing a small number of voxels. An interesting example, however, is the Zona Incerta. Despite its lack of contrast on the images, the results are superior to other structures that do exhibit contrast. We attribute this to the loca-tion of the structure, near the internal capsula, which provides dis-tinctive contrast helping ANTS in matching the area across patients.
The definition of STN proposed by ANTS is supported inFig. 8 through its adjacency with FF and SN with no overlap. This is in agreement with the structural architecture of the brain in those regions, where gray matter nuclei are interconnected with white matter fibers, making the transition from one structure to another challenging to define even on histology slices.
For smaller, less visible or more elongated structures, it was ob-served that parts of the structures are missing in the template when compared to the structures from a specific patient. We consider this to be the result of a small number of samples in the atlas creation process. Fig. 8. Two WAIR slices together with anatomical structures from a single patient, transformed in the space of the best template created with ANTS are presented in A and C. The corresponding slices in the WAIR template of the group, with the cumulative definition of the structures with a 50% confidence level are presented in B and D. The Fields of Forel (FF), sub-thalamic nucleus (STN), substrancia nigra (SN), antero-lateral nucleus (AL), Mammillary body (MB) and Mammillothalamic tract are marked for anatomical reference.
Table 2
Run times for the three tools under test with different settings.
Registration tool Setting Time
ANTS Default 33 h 40 min 14 s
Klein 2009 26 h 44 min 11 s Ewert 2019 Low Variance 20 h 23 min 12 s Ewert 2019 High Variance 20 h 0 min 8 s
FNIRT Default 91 h 1 min 3 s
Klein 2009 9 h 22 min 13 s DRAMMS Default 25 h 45 min 47 s
4.5. Processing time
The time required to generate the templates was recorded, even if it was not a crucial criterion in our study. Run times for ANTS and DRAMMS were between 20 and 34 h which is well below the time between two surgeries in most centers, giving the opportunity to update a template with larger groups between two surgeries. FNIRT showed the most heterogeneous run-times, with a 10-fold increase of the time needed to create a template with the default settings compared to the settings fromKlein et al. (2009). The reason observed is that FNIRT does not seem to take advantage of multi-processor systems. Parallel registrations were thus limited by the memory available and as a result, only 8 of the 64 threads were used for 8 parallel registrations. While the time required to generate a template from a group is dependent on the number of patients, the computing resources used in this work remain desktop-grade resources and transferring this methodology to a cluster environment is possible.
4.6. Limitations
Expert labeled structures are often subject of discussion due to variations from one labeling session to another especially because of inter-rater variability. Nevertheless, in absence of a gold standard for anatomy based on MR and CT images applicable to each and every patient, expert labeling can be considered as a compromise and as the best silver-standard when available. Throughout the present study, the labels used to measure the accuracy of the registration applied on the image data sets were the anatomical structures delineated routinely and exclusively by the same experienced neurosurgeon (301 surgeries be-tween 1995 and 2019). In consequence, inter-rater variability was avoided.
To convert cumulative label definitions to binary outlines, a fixed threshold was used. However, for anatomically realistic visualization of the deep brain structures or for atlas-based segmentation of the ana-tomical structures, this method might not be the most appropriate since it relies on a constant threshold over a space that has been non-linearly transformed. There is a lack of literature describing details about this necessary step and further research is needed.
The present study uses the entirety of a group of patients available at the time of the study design and identifies the best registration tool for the specific data and pipeline used. However, the influence of the number of patients on the quality of the result on the template has not been investigated in the present study. In consequence, the next step will be to start a follow-up project to study the template variability in relation to the number of patients and to estimate the amount of data required to converge to a stable anatomy. Several parameters of this pipeline should be explored in more details, namely the number of iterations in the atlas creation (currently 4 with T1, 4 with WAIR) and the scaling of the warp field during the update of the template.
We did not present the comparison of the atlas created in this study with other existing subthalamic templates for several reasons. Firstly, the creation of the probabilistic definitions of anatomical structures and the structural MR templates is a secondary outcome, compared to the main goal of this study, which was the validation of the normalization workflow for study-specific anatomical templates. Secondly, the limited number of patients included in this study combined with the hetero-geneous occurrence of structures makes the conversion to binary out-lines questionable at this point, since it involves normalizing the oc-currence of structures, and thus artificially increases the statistical power of under-represented structures. Lastly, the method of resolving the probabilistic definitions of anatomical structures is a crucial point as it can vastly change the appearance of structures considering the size of structures in the deep brain. This issue requires a larger dataset with comparable labeling detail.
5. Conclusion
A workflow for multi-modality iterative anatomical template con-struction was introduced and the performance of three non-linear re-gistration tools (ANTS, FSL’s FNIRT, and DRAMMS) was evaluated for that purpose using MRI of the human deep brain. The quality of the registration was evaluated using labels of the anatomical structures from the thalamus and sub-thalamus produced by single-expert manual segmentation. ANTS using the “high variance” settings fromEwert et al. (2019)produced the results of the best quality.
Future works will determine the number of patients necessary to achieve a reliable template that represents a group accurately. Apart from creating a representative anatomical template, other patient data can now be transferred in the normalized template space in the same way as the labels of the structures. This method can be applied to normalize patient-specific stimulation maps (Shah, 2018). Stimulation maps make use of patient-specific electric field simulations (Alonso et al., 2016) and quantitative tremor evaluation (Hemm et al., 2016) by acceleration sensors during intraoperative stimulation tests to provide assistance during peri-operative decision making.
Conflict of interest
The authors declare no conflict of interrest.
CRediT authorship contribution statement
Dorian Vogel: Conceptualization, Methodology, Software, Writing
-original draft. Ashesh Shah: Conceptualization, Methodology, Writing - review & editing. Jérôme Coste: Validation, Writing - review & editing. Jean-Jacques Lemaire: Validation, Writing - review & editing.
Karin Wårdell: Conceptualization, Supervision, Writing - review &
editing, Funding acquisition. Simone Hemm: Conceptualization, Methodology, Supervision, Writing - review & editing, Funding acqui-sition.
Funding
This work was financially supported by the Swedish Foundation for Strategic Research (SSF BD15-0032), Swedish Research Council (VR 2016-03564), and the University of Applied Sciences and Arts Northwestern Switzerland (FHNW).
Appendix A. Supplementary data
Supplementary data to this article can be found online athttps:// doi.org/10.1016/j.nicl.2020.102271.
References
Alonso, F., Latorre, M., Göransson, N., Zsigmond, P., Wårdell, K., 2016. Investigation into deep brain stimulation lead designs: a patient-specific simulation study. Brain Sci. 6, 39.https://doi.org/10.3390/brainsci6030039.
Andersson, J., Jenkinson, M., Smith, S.M., 2007. Non-linear registration aka Spatial normalisation FMRIB Technial Report TR07JA2.
Ashburner, J., Friston, K.J., 1999. Nonlinear spatial normalization using basis functions. Hum. Brain Mapp. 7, 254–266.https://doi.org/10.1002/(SICI)1097-0193(1999) 7:4<254::AID-HBM4>3.0.CO;2-G.
Avants, B.B., Tustison, N.J., Song, G., Gee, J.C., 2010a. Ants: Open-source tools for nor-malization and neuroanatomy.
Avants, B.B., Yushkevich, P., Pluta, J., Minkoff, D., Korczykowski, M., Detre, J., Gee, J.C., 2010b. The optimal template effect in hippocampus studies of diseased populations. NeuroImage 49, 2457–2466.https://doi.org/10.1016/j.neuroimage.2009.09.062. Chakravarty, M.M., Bertrand, G., Hodge, C.P., Sadikot, A.F., Collins, D.L., 2006. The
creation of a brain atlas for image guided neurosurgery using serial histological data. NeuroImage 30, 359–376.https://doi.org/10.1016/j.neuroimage.2005.09.041. Coubes, P., Vayssiere, N., El Fertit, H., Hemm, S., Cif, L., Kienlen, J., Bonafe, A.,
Frerebeau, P., 2002. Deep brain stimulation for dystonia. Stereotact. Funct. Neurosurg. 78, 183–191.https://doi.org/10.1159/000068962.
Dice, L.R., 1945. Measures of the amount of ecologic association between species. Ecology
26, 297–302.https://doi.org/10.2307/1932409.
Ewert, S., Horn, A., Finkel, F., Li, N., Kühn, A.A., Herrington, T.M., 2019. Optimization and comparative evaluation of nonlinear deformation algorithms for atlas-based segmentation of DBS target nuclei. NeuroImage 184, 586–598.https://doi.org/10. 1016/j.neuroimage.2018.09.061.
Ewert, S., Plettig, P., Li, N., Chakravarty, M.M., Collins, D.L., Herrington, T.M., Kühn, A.A., Horn, A., 2017. Toward defining deep brain stimulation targets in MNI space: a subcortical atlas based on multimodal MRI, histology and structural connectivity. NeuroImage.https://doi.org/10.1016/j.neuroimage.2017.05.015.
Fonov, V., Evans, A., McKinstry, R., Almli, C., Collins, D., 2009. Unbiased nonlinear average age-appropriate brain templates from birth to adulthood. NeuroImage, Organization for Human Brain Mapping 2009 Annual Meeting 47, S102. https://doi. org/10.1016/S1053-8119(09)70884-5.
Fedorov, A., Beichel, R., Kalpathy-Cramer, J., Finet, J., Fillon-Robin, J.-C., Pujol, S., Bauer, C., Jennings, D., Fennessy, F., Sonka, M., Buatti, J., Aylward, S., Miller, J., Pieper, S., Kikinis, R., 2012. 3D Slicer as an image computing platform for the Quantitative Imaging Network. Magn. Reson. Imaging 30 (9).https://doi.org/10. 1016/j.mri.2012.05.001.In press.
Fonov, V., Evans, A.C., Botteron, K., Almli, C.R., McKinstry, R.C., Collins, D.L., 2011. Unbiased average age-appropriate atlases for pediatric studies. NeuroImage 54, 313–327.https://doi.org/10.1016/j.neuroimage.2010.07.033.
Gorgolewski, K., Burns, C.D., Madison, C., Clark, D., Halchenko, Y.O., Waskom, M.L., Ghosh, S.S., 2011. Nipype: a flexible, lightweight and extensible neuroimaging data processing framework in python. Front. Neuroinf. 5.https://doi.org/10.3389/fninf. 2011.00013.
Grabner, G., Janke, A.L., Budge, M.M., Smith, D., Pruessner, J., Collins, D.L., 2006. Symmetric atlasing and model based segmentation: an application to the hippo-campus in older adults, in: Medical Image Computing and Computer-Assisted Intervention – MICCAI 2006, Lecture Notes in Computer Science. Presented at the International Conference on Medical Image Computing and Computer-Assisted Intervention, Springer, Berlin, Heidelberg, pp. 58–66. https://doi.org/10.1007/ 11866763_8.
Hariz, M., 2017. My 25 stimulating years with DBS in Parkinson’s disease. J. Park. Dis. 7, S33–S41.https://doi.org/10.3233/JPD-179007.
Hariz, M., Blomstedt, P., Zrinzo, L., 2013. Future of brain stimulation: new targets, new indications, new technology. Mov. Disord. 28, 1784–1792.https://doi.org/10.1002/ mds.25665.
Hemm, S., Pison, D., Alonso, F., Shah, A., Coste, J., Lemaire, J.-J., Wårdell, K., 2016. Patient-specific electric field simulations and acceleration measurements for objec-tive analysis of intraoperaobjec-tive stimulation tests in the thalamus. Front. Hum. Neurosci. 10.https://doi.org/10.3389/fnhum.2016.00577.
Hemm, S., Wårdell, K., 2010. Stereotactic implantation of deep brain stimulation elec-trodes: a review of technical systems, methods and emerging tools. Med. Biol. Eng. Comput. 48, 611–624.https://doi.org/10.1007/s11517-010-0633-y.
Herrington, T.M., Cheng, J.J., Eskandar, E.N., 2015. Mechanisms of deep brain stimula-tion. J. Neurophysiol. 115, 19–38.https://doi.org/10.1152/jn.00281.2015 jn.00281. 2015 [pii].
Hintze, J.L., Nelson, R.D., 1998. Violin plots: a box plot-density trace synergism. Am. Stat. 52, 181–184.https://doi.org/10.1080/00031305.1998.10480559.
Horn, A., Li, N., Dembek, T.A., Kappel, A., Boulay, C., Ewert, S., Tietze, A., Husch, A., Perera, T., Neumann, W.-J., Reisert, M., Si, H., Oostenveld, R., Rorden, C., Yeh, F.-C., Fang, Q., Herrington, T.M., Vorwerk, J., Kühn, A.A., 2019. Lead-DBS v2: towards a comprehensive pipeline for deep brain stimulation imaging. NeuroImage 184, 293–316.https://doi.org/10.1016/j.neuroimage.2018.08.068.
Keszei, A.P., Berkels, B., Deserno, T.M., 2016. Survey of non-rigid registration tools in medicine. J. Digital Imag.https://doi.org/10.1007/s10278-016-9915-8. Klein, A., Andersson, J., Ardekani, B.A., Ashburner, J., Avants, B., Chiang, M.-C.,
Christensen, G.E., Collins, D.L., Gee, J., Hellier, P., Song, J.H., Jenkinson, M., Lepage, C., Rueckert, D., Thompson, P., Vercauteren, T., Woods, R.P., Mann, J.J., Parsey, R.V., 2009. Evaluation of 14 nonlinear deformation algorithms applied to human brain MRI registration. NeuroImage 46, 786–802.https://doi.org/10.1016/j. neuroimage.2008.12.037.
Lalys, F., Haegelen, C., Ferre, J.-C., El-Ganaoui, O., Jannin, P., 2010. Construction and assessment of a 3-T MRI brain template. NeuroImage 49, 345–354.https://doi.org/ 10.1016/j.neuroimage.2009.08.007.
Lemaire, J.-J., Coste, J., Ouchchane, L., Caire, F., Nuti, C., Derost, P., Cristini, V., Gabrillargues, J., Hemm, S., Durif, F., Chazal, J., 2007. Brain mapping in stereotactic surgery: a brief overview from the probabilistic targeting to the patient-based ana-tomic mapping. NeuroImage 37, S109–S115.https://doi.org/10.1016/j.neuroimage. 2007.05.055.
Lemaire, J.-J., De Salles, A., Coll, G., El Ouadih, Y., Chaix, R., Coste, J., Durif, F., Makris, N., Kikinis, R., 2019. MRI atlas of the human deep brain. Front. Neurol. 10, 851.
https://doi.org/10.3389/fneur.2019.00851.
Lemaire, J.-J., Sakka, L., Ouchchane, L., Caire, F., Gabrillargues, J., Bonny, J.-M., 2010. Anatomy of the human thalamus based on spontaneous contrast and microscopic voxels in high-field magnetic resonance imaging. Oper. Neurosurg. 66https://doi. org/10.1227/01.NEU.0000365617.41061.A3.ons161–ons172.
Lorio, S., Fresard, S., Adaszewski, S., Kherif, F., Chowdhury, R., Frackowiak, R.S., Ashburner, J., Helms, G., Weiskopf, N., Lutti, A., Draganski, B., 2016. New tissue priors for improved automated classification of subcortical brain structures on MRI. NeuroImage 130, 157–166.https://doi.org/10.1016/j.neuroimage.2016.01.062. Magnotta, V.A., Gold, S., Andreasen, N.C., Ehrhardt, J.C., Yuh, W.T.C., 2000.
Visualization of subthalamic nuclei with cortex attenuated inversion recovery MR imaging. NeuroImage 11, 341–346.https://doi.org/10.1006/nimg.2000.0552. Mazziotta, J., Toga, A., Evans, A., Fox, P., Lancaster, J., Zilles, K., Woods, R., Paus, T.,
Simpson, G., Pike, B., Holmes, C., Collins, L., Thompson, P., MacDonald, D., Iacoboni, M., Schormann, T., Amunts, K., Palomero-Gallagher, N., Geyer, S., Parsons, L., Narr, K., Kabani, N., Goualher, G.L., Boomsma, D., Cannon, T., Kawashima, R., Mazoyer, B., 2001. A probabilistic atlas and reference system for the human brain: International Consortium for Brain Mapping (ICBM). Philos. Trans. R. Soc. Lond. B. Biol. Sci. 356, 1293–1322.https://doi.org/10.1098/rstb.2001.0915.
Morel, A., 2007. Stereotactic Atlas of the Human Thalamus and Basal Ganglia, 0 ed. CRC Press. https://doi.org/10.3109/9781420016796.
Nowinski, W.L., Belov, D., Pollak, P., Benabid, A.-L., 2005. Statistical analysis of 168 bilateral subthalamic nucleus implantations by means of the probabilistic functional atlas. Oper. Neurosurg. 57, 319–330.https://doi.org/10.1227/01.NEU.0000180960. 75347.11.
Ou, Y., Akbari, H., Bilello, M., Da, X., Davatzikos, C., 2014. Comparative evaluation of registration algorithms in different brain databases with varying difficulty: results and insights. IEEE Trans. Med. Imag. 33, 2039–2065.https://doi.org/10.1109/TMI. 2014.2330355.
Ou, Y., Sotiras, A., Paragios, N., Davatzikos, C., 2011. DRAMMS: Deformable registration via attribute matching and mutual-saliency weighting. Med. Image Anal. 15, 622–639.https://doi.org/10.1016/j.media.2010.07.002.
Qiu, A., Brown, T., Fischl, B., Ma, J., Miller, M.I., 2010. Atlas generation for subcortical and ventricular structures with its applications in shape analysis. IEEE Trans. Image Process. 19, 1539–1547.https://doi.org/10.1109/TIP.2010.2042099.
Schaltenbrand, G., 1977. Atlas for Stereotaxy of the Human Brain. Georg Thieme. Shah, A.A., 2018. Investigation of intraoperative accelerometer data recording for safer
and improved target selection for deep brain stimulation (Ph.D.). University of Basel, Basel. https://doi.org/10.5451/unibas-007087543.
Shattuck, D.W., Mirza, M., Adisetiyo, V., Hojatkashani, C., Salamon, G., Narr, K.L., Poldrack, R.A., Bilder, R.M., Toga, A.W., 2008. Construction of a 3D probabilistic atlas of human cortical structures. NeuroImage 39, 1064–1080.https://doi.org/10. 1016/j.neuroimage.2007.09.031.
Talairach, J., Tournoux, P., 1988. Co-Planar Stereotactic Atlas of the Human Brain. Theime Medical, New York.
Tokuda, J., Fischer, G.S., Papademetris, X., Yaniv, Z., Ibanez, L., Cheng, P., Liu, H., Blevins, J., Arata, J., Golby, A.J., Kapur, T., Pieper, S., Burdette, E.C., Fichtinger, G., Tempany, C.M., Hata, N., 2009. OpenIGTLink: an open network protocol for image-guided therapy environment. Int. J. Med. Robot. 5, 423–434.https://doi.org/10. 1002/rcs.274.
Ungi, T., Lasso, A., Fichtinger, G., 2016. Open-source platforms for navigated image-guided interventions. Med. Image Anal. 33, 181–186.https://doi.org/10.1016/j. media.2016.06.011.
Vassal, F., Coste, J., Derost, P., Mendes, V., Gabrillargues, J., Nuti, C., Durif, F., Lemaire, J.-J., 2012. Direct stereotactic targeting of the ventrointermediate nucleus of the thalamus based on anatomic 1.5-T MRI mapping with a white matter attenuated inversion recovery (WAIR) sequence. Brain Stimulat. 5, 625–633.https://doi.org/10. 1016/j.brs.2011.10.007.
Xiao, Y., Fonov, V., Chakravarty, M.M., Beriault, S., Al Subaie, F., Sadikot, A., Pike, G.B., Bertrand, G., Collins, D.L., 2017. A dataset of multi-contrast population-averaged brain MRI atlases of a Parkinson׳s disease cohort. Data Brief 12, 370–379.https://doi. org/10.1016/j.dib.2017.04.013.
Zerroug, A., Gabrillargues, J., Coll, G., Vassal, F., Jean, B., Chabert, E., Claise, B., Khalil, T., Sakka, L., Feschet, F., Durif, F., Boyer, L., Coste, J., Lemaire, J.-J., 2016. Personalized mapping of the deep brain with a white matter attenuated inversion recovery (WAIR) sequence at 1.5-tesla: experience based on a series of 156 patients. Neurochirurgie 62, 183–189.https://doi.org/10.1016/j.neuchi.2016.01.009.