Unemployment and Second Home Construction.
Evidence from Switzerland
Luzius Stricker
Submitted for the degree of Ph.D. in Economics
Faculty of Economics
Università della Svizzera italiana
Thesis Committee:
Prof. Rico Maggi, supervisor, Università della Svizzera italiana Prof. Patricia Funk, internal examiner, Università della Svizzera italiana
Prof. Ugo Fratesi, external examiner, Politecnico di Milano
IV
Acknowledgements
First, I would like to thank Prof. Rico Maggi, who, with his patience and open-mindedness, has been a great mentor and a very inspiring person throughout my studies at USI. I am sincerely grateful to him for having supervised three important capstone works on my academic path and for dedicating energy to my research and to this PhD thesis.
I am grateful to Prof. Patricia Funk for reviewing my thesis as an internal examiner and to Prof. Ugo Fratesi for his support and participation on the thesis committee as an external examiner.
Moreover, I am grateful to all my colleagues at IRE in Lugano for their considerable contributions to my research projects, their support in every matter and the friendly time spent together at work and during leisure. Special thanks to Dr. Moreno Baruffini, who since the beginning of my studies believed in me and encouraged, motivated and guided me through this long path with his never-ending positivity, broad knowledge and almost infinite patience. I would also like to thank Letizia Tronnolone and Sara Pianta for their availability in any situation and for their creation of such a friendly atmosphere in the institute. Furthermore, special thanks to Laura Fontana-Casellini for her encouragement and her many inspiring ideas and talks inside and outside the office.
I would like to thank my friends on “both sides of the Alps” for their support and presence in every moment of my life.
Finally, I am enormously grateful to my family and grandparents, whose love and sacrifices brought me to where I am. I thank my parents Doris and Walter for being such a great inspiration and to my sister Ursula for her infinite energy and support.
V
Contents
Introduction ... 1
Chapter 1 - Impact of Labour Market Liberalization on Minimum Wage Effects: the Case of the Construction Sector in a Small Open Economy ... 13
1. Introduction ... 15
2. Literature Review and Theory Development ... 17
2.1. Minimum Wage Bite and Wage Effects ... 17
2.2. Effects of Labour Market Liberalisation ... 19
3. Material and Methods ... 21
3.1. The Swiss Construction Sector ... 21
3.2. Free Movement of Persons Agreement (FZA) Switzerland – EU ... 27
4. Dataset ... 28
5. Method and Empirical Strategy ... 33
6. Results and Discussion ... 36
7. Conclusions ... 40
8. References ... 42
Chapter 2 - The Effect of Reduced Unemployment Duration on the Unemployment Rate: a Synthetic Control Approach ... 45
1. Introduction ... 47
VI
4. Methods and Empirical Framework ... 53
4.1. Data and Sample ... 53
4.2. Computational Issues: Constructing a Synthetic Control for Ticino ... 55
4.3. Specification of the Synthetic Control Estimator ... 56
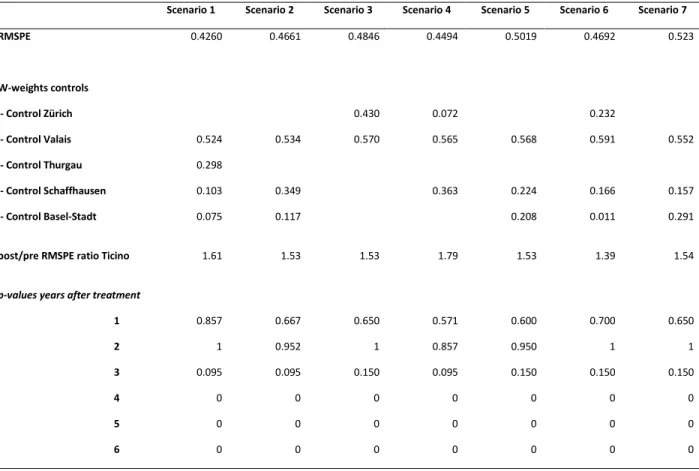
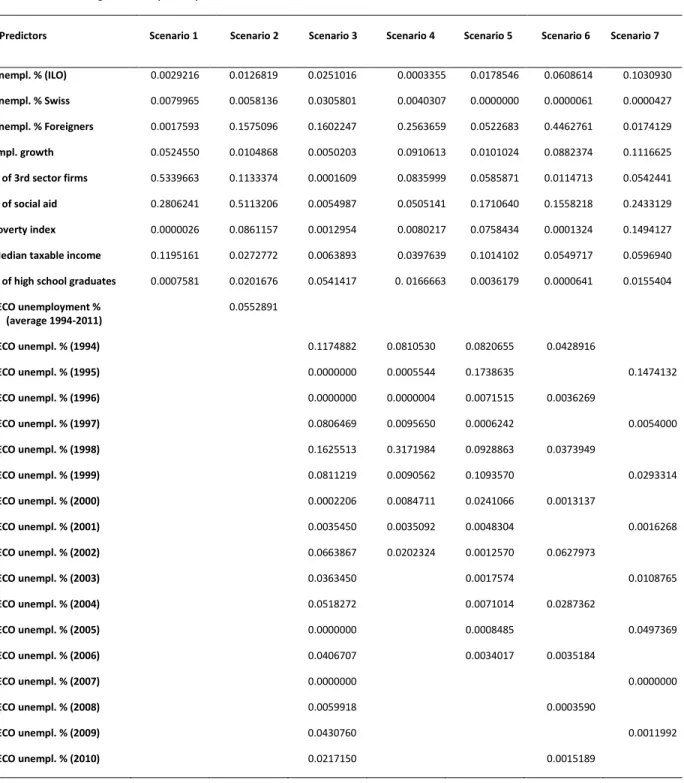
5. Results and Discussion ... 57
5.1. Specification Including All Pre-Treatment Outcome Values Singularly (Scenario 3) ... 62
6. Robustness Tests ... 64
6.1. Difference-in-Difference Computation of Ticino and the Donor Pool Average 64 6.2. Results for Other Cantons Affected by the Additional Measure ... 67
7. Comment on Results ... 71
8. Conclusions ... 72
9. References ... 75
10. Appendix 1 – Descriptive Statistics ... 79
11. Appendix 2 – Variables List ... 81
12. Appendix 3 – Scenarios 1, 2, 4-7 for Ticino ... 82
Chapter 3 - Restricting the Construction of Second Homes in Tourist Destinations: an Effective Intervention towards Sustainability? ... 89
1. Introduction ... 91
2. Theoretical Background ... 93
3. Institutional Setting ... 94
4. Empirical Strategy ... 96
VII
7. Conclusions ... 107
8. References ... 109
9. Appendix 1 – Construction Permit’s Validity According to Cantonal Laws ... 111
10. Appendix 2 – Year Specific Effects ... 112
11. Appendix 3 - Renovation Investments ... 113
12. Appendix 4 – Variation of Touristic Overnight Stays in Managed Accommodations in Municipalities ... 115
VIII
List of figures
Figure 1. Negotiated wage and labour market tightness. ... 8 Figure 2. Vacant jobs and unemployment. ... 9 Figure 3. Labour productivity (real in full-time equivalents) in the Swiss
construction sector. ... 22 Figure 4. Wages in the main construction sector and inflation. ... 23 Figure 5. Minimum wage index in the construction sector and construction price index (month of October). ... 24 Figure 6. Employment (full-time equivalents) in the construction sector (in the third quarter of the year). ... 25 Figure 7. Employment in the construction sector in Switzerland, by wage classes. 26 Figure 8. Regions with different minimum wage levels according to the collective labour agreement. ... 31 Figure 9. Monthly gross minimum wages for unskilled workers in the construction sector 1999-2016, for each of the three regional minimum wage levels. ... 32 Figure 10. Unemployment rates (SECO) of Ticino (treated) and cantons in the donor pool. ... 55 Figure 11. Demeaned SC and Ticino unemployment rate, including all
pre-treatment variables as predictors. ... 63 Figure 12. Unemployment rates (SECO) of Ticino (treated) and weighted average (by employees) of the donor pool. Second quarter of the year. ... 65 Figure 13. Linear fits for Ticino and donor pool with cut-offs in 2011 (left) and 2013 (right)... 66
IX
Figure 15. Outcome for Vaud: Demeaned SC and unemployment rate, including all
pre-treatment variables as predictors. ... 69
Figure 16. Outcome for Jura: Demeaned SC and unemployment rate, including all pre-treatment variables as predictors. ... 70
Figure 17. Outcome for Neuchâtel: Demeaned SC and unemployment rate, including all pre-treatment variables as predictors. ... 70
Figure 18. Outcome specification 1 for Ticino. ... 82
Figure 19. Outcome specification 2 for Ticino. ... 83
Figure 20. Outcome specification 4 for Ticino. ... 84
Figure 21. Outcome specification 5 for Ticino. ... 85
Figure 22. Outcome specification 6 for Ticino. ... 86
Figure 23. Outcome specification 7 for Ticino. ... 87
Figure 24. Second home shares by municipality (vegetation area) in Switzerland. . 92
Figure 25. Average investments in new constructions in municipalities to which the second home restriction applies and in the other municipalities with no legal changes (counterfactual)... 102
Figure 26. Year specific effects of the investments in new construction and 95% confidence interval with reference year 2011 (t-1). ... 103
Figure 27. Average investments in renovations in municipalities to which the second home restriction applies and for the remainder with no legal changes (counterfactual). ... 113
Figure 28. Variation in the percentage of overnight stays in touristic managed accommodations in municipalities to which the second home restriction applies. . 115
Figure 29. Variation in percentage of touristic overnight stays in managed accommodations in municipalities to which the second home restriction does not apply. ... 116
X
List of tables
Table 1. Effects of the FZA on employment in the main construction sector. ... 39 Table 2. Descriptive statistics for Ticino and cantons composing the SC for Ticino. 54 Table 3. Summary of the SC and placebo effects (p-values). ... 58 Table 4. Predictor V-weights in defining the SC from the cantons in the donor pool. ... 60 Table 5. Predictor weights in defining the SC from the cantons in the donor pool. . 61 Table 6. Difference-in-difference outcomes for Ticino and donor pool canton average unemployment rates. ... 66 Table 7. Summary of the SC computation of other cantons affected by the new policy... 67 Table 8. Summary of descriptive statistics for all cantons. ... 79 Table 9. Variables included in the SC computation. ... 81 Table 10. Descriptive statistics for municipalities with and without the second home restriction. ... 101 Table 11. Results of the DiD analysis of the effect of the second home restriction (with continuous and discrete treatment variables) on new construction
investments. ... 105 Table 12. Results of the event study of the effect of the second home restriction (with continuous and discrete treatment variable) on new construction investments. ... 106 Table 13. Construction permits validity according to cantonal legislation. ... 111 Table 14. Year specific annual variations of new construction and renovation
XI
Table 16. Results of the event study for the second home restriction (with
2
Introduction
This thesis is composed of three different chapters focusing on labour market policies and the construction industry. The first two parts analyse the employment effects of changing legislation, examining, first, labour market liberalization and, second, changing unemployment insurance law. The third chapter focuses on the effects of a second home restriction on construction activity.
In recent years, Switzerland has been characterized by a high rate of employment and a properly functioning social system ensuring high living standards for citizens. Several federal regulations provide space for cantonal authorities to design detailed, tailor-made applications of the common rules. This juridical hierarchy is important for all three chapters, where we address actual federal policies and laws that affect the Swiss economy in a heterogeneous way. Particular attention is therefore dedicated to the interconnectedness of the regions and cantonal peculiarities. In the first chapter, the attention to regional interaction is focused on the interdependence of labour markets, defined in a commuter stream matrix, while the second chapter compares the similarities of regions based on a predefined set of variables. In the last chapter, cantonal legislation is discussed an important factor that defines the non-homogeneous delay in the full effects of the new second home law in the cantons.
From a theoretical point of view, the three chapters contribute to the microeconomic composition of the production function. In effect, the last part of this dissertation focuses on the negative shock of a politically caused reduction in the production of construction firms, in other words, an external shock on the output side. Through further development of the input aspect of producer theory and a focus on labour as one of the production inputs, it is possible to explain firm-side employment decisions, which define the labour demand. The first chapter is an applied study of the effects of exogenously caused rising costs of production input “labour”, as well as
3
the shift of the bargaining power of employees towards the employer side due to market liberalization; this shift was a result of growing competition within the workforce. Last, the middle part of the dissertation focuses on the labour supply side, studying the incentives of unemployed people to accelerate their job searches when the opportunity costs of long-term unemployment rise.
The following section summarizes the general production function and labour market decision, discussing the literature that provides a basis for the chapters composing this work. To start, we recall the formulation of the production function:
𝑞 = 𝑓(𝐸, 𝐾)
The definition of production is given by the utilization and transformation of the two employed inputs, labour (𝐸) and capital (𝐾). Labour is defined based on employee hours, in other words, the product of hired workers and daily working hours (Borjas, 2005). This kind of production function is of a neoclassical character. Capital and labour are treated as imperfect substitutes in the production process, and they can be substituted with each other only up to a certain degree (Bosworth, Dawkins, & Stromback, 1996).
An associated concept of the production function is the formulation of the marginal product of input factors. Focusing on labour input would lead to the definition of the marginal product of labour (MPE). The MPE returns the gains in productivity that the firm obtains from the hiring of an additional employee. Based on the assumption that the MPE initially increases and then decreases with the number of employees, the second part of the decreasing marginal product is the consequence of the law of diminishing returns. This is the same law that, complementary to some other determinants, limits the number of employees that are hired by firms. With non-decreasing marginal productivity, any firm would hire an infinite number of workers. As a consequence of this marginal productivity behaviour, the average productivity also initially increases and eventually decreases with a delay with respect to marginal productivity (Borjas, 2005).
4
Another important concept that helps understand hiring decisions and the design of the optimal output in a firm is profit maximization. In a simplified way, the profit equation for a perfectly competitive firm is as follows (Borjas, 2005):
𝑃𝑟𝑜𝑓𝑖𝑡𝑠 = 𝑝𝑞 − 𝑤𝐸 − 𝑟𝐾
where (𝑝) is the unitary output price of the final product (𝑞), labour hours (𝐸) and capital (𝐾) are the quantities of inputs used in the production, and (𝑤) and (𝑟) are their respective prices per unit. Perfect competition implies that the firm cannot act on the prices on the considered markets; therefore, the only way to react to changes is to alter the quantities (Borjas, 2005). For the topic of analysis, the focus of the first chapter is on the quantity of the employed workforce in the production process, or simply how many persons the firm hires, when the cost of labour rises. The policy researched in the third chapter instead would lead to an exogenous limitation of the output quantity (𝑞) (in terms of construction investments).
To analyse the employment decisions of firms, economists define the short run as a period that is long enough to vary the labourers but not the quantity of capital employed in the production process. The long run instead allows adjustments in capital and labour as a consequence of changing exogenous factors. The very long run allows further changes, not only of inputs but also to technology. (Bosworth, Dawkins, & Stromback, 1996)
Furthermore, to understand the interaction of labour demand and supply (important for chapter 2), it is worth introducing the matching model. This model explains the factors influencing both sides, i.e., firms and workers, in the decision-making process. One of the advantages of this model is that it enables the coexistence of vacant jobs and unemployed workers.
Following a microeconomic path, we can set a variable (𝑒𝑖) that measures the
effort that an unemployed person takes during the job search, for example, the number of applications sent for vacant jobs. With a large number of vacant jobs (𝑉) on the market, the number of hires can be expressed in the following way:
5
𝑀 = 𝑉 {1 − 𝑒𝑥𝑝 [− (𝑒 𝐷 𝑉 )]}
where (𝐷) is the number of job seekers, (𝑒̅) is the average level of job search effort of all individuals and (𝑀) is the number of matches achieved on the market. According to this, one who invests greater personal effort in the job search has a higher personal chance of being hired (Cahuc, Carcillo, & Zylberberg, 2014).
Moving from the matching function to an aggregate level, two assumptions need to be taken into account. First, the matching function has constant returns to scale, and second, only unemployed workers search for a job (𝑈 = 𝐷). Furthermore, we need
to introduce the term labour market tightness (𝜃), which is defined as the number of vacant jobs (𝑉) divided by the number of unemployed persons (𝑈). The exit rate of unemployment (hazard rate) is therefore an increasing function of (𝜃). Further, we need to add a job destruction rate (𝑞) to the model, and it is possible to draw the variation in the stock of unemployed persons (𝑈)̇ (Cahuc, Carcillo, & Zylberberg, 2014):
𝑈̇ = 𝑁̇ + 𝑞𝐿 − 𝜃𝑚(𝜃)𝑈
The variation in unemployment in this case depends on the growth of the labour force (𝑁)̇, the number of persons who have lost their jobs (𝑞𝐿) and the number of persons who were unemployed and found a job in the meantime (𝜃𝑚(𝜃)𝑈). Writing this equation by applying the law of motion of the rate of unemployment and solving for the stationary value of the unemployment rate (𝑢), we obtain the equation determining the Beveridge curve (BC) (Cahuc, Carcillo, & Zylberberg, 2014):
𝑢 = 𝑞 + 𝑛
𝑞 + 𝑛 + 𝜃𝑚(𝜃)
Considering that (𝜃 = 𝑣/𝑢), the linkage provides us with the equilibrium of worker flows between employment and unemployment in the plane (𝑣, 𝑢) (Cahuc, Carcillo, & Zylberberg, 2014).
6
For the firm side of this contracting, the goal is to maximize profits. Two assumptions are required to develop the problem: job destruction is an endogenous decision, and the real interest rate (𝑟) is given exogenously. In this constellation, the firm can choose between two situations, i.e., employed or vacant, with each resulting in a different profit. The discounted future profits from employing somebody can be written in the following way (Cahuc, Carcillo, & Zylberberg, 2014):
𝑟Π𝑒 = 𝑦 − 𝑤 + 𝑞(Π𝑣− Π𝑒)
where (𝑦 − 𝑤) is the instantaneous profit of the firm (𝑤 = wage; 𝑦 = production output) and (𝑞(Π𝑣 − Π𝑒)) is the average gain of the job possibly changing state.
(Cahuc, Carcillo, & Zylberberg, 2014)
On the other hand, we can write the returns a firm could achieve simply by keeping a position vacant. In this case, the discounted profit would be:
𝑟Π𝑣 = −ℎ + 𝑚(𝜃)(Π𝑒− Π𝑣)
In this formulation, (−ℎ) is the instantaneous cost of a vacant position. The remainder of the equation includes the average gain of a potential change in the state of the vacant position being occupied. Following this, assuming that the expected profit of a vacant job is strictly positive and adding the free entry condition (Π𝑣 = 0), the two equations can be equalized to obtain the equation defining labour demand (Cahuc, Carcillo, & Zylberberg, 2014).
ℎ 𝑚(𝜃)=
𝑦 − 𝑤 𝑟 + 𝑞
The second component of the labour market considers the counterpart of the worker that wants to maximize his or her expected utility. For this, some assumptions are required: the expected utility of an employee is at least as high as that of an unemployed worker (𝑉𝑢 ≤ 𝑉𝑒), and workers are risk neutral (linear utility function).
In this way, the expected utilities for both situations of employment status can be obtained (Cahuc, Carcillo, & Zylberberg, 2014):
7
𝑟𝑉𝑒 = 𝑤 + 𝑞(𝑉𝑢− 𝑉𝑒) 𝑟𝑉𝑢 = 𝑧 + 𝜃𝑚(𝜃)(𝑉𝑒− 𝑉𝑢)
A particularity of the above equation is that (𝑧) includes the benefits of being unemployed, which could be, for example, insurance contributions or social welfare transfers (a variable strongly influenced by the policy change discussed in chapter 2). These two components, i.e., firm and worker decision making, lead to bargaining that determines the way the surplus of the production process is divided among the two counterparts. For this aim, we introduce a variable 𝛾 ∈ [0, 1] that reflects the bargaining power of the worker and is complementary to the firm’s bargaining power. In this way, it is possible to combine the two components to obtain the wage curve (WC) that defines the relationship between wage (𝑤) and tightness (𝜃) (Cahuc, Carcillo, & Zylberberg, 2014):
𝑤 = 𝑧 + (𝑦 − 𝑧)Γ(𝜃) , 𝑤𝑖𝑡ℎ: 𝛤(𝜃) =𝛾[𝑟 + 𝑞 + 𝜃𝑚(𝜃)] 𝑟 + 𝑞 + 𝛾𝜃𝑚(𝜃)
The exit rate from unemployment (𝜃𝑚(𝜃)), and therefore (Γ(𝜃)), increases with (𝜃). In the same way, (Γ(𝜃)) decreases with the exit rate from employment (𝑞). In this way, the WC explains an increasing relationship of wages and employment (Cahuc, Carcillo, & Zylberberg, 2014).
The above introduced dynamics of the matching model can be presented graphically (see Figure 1) to discuss the possible effects of changing wage policies and their impact on different variables in the system affecting employment status. The first graph shows the equilibrium wage (𝑤∗) and market tightness (𝜃) in a system in
which the WC equals the labour demand (LD). The WC shifts upwards with higher unemployment benefits (𝑧), higher worker bargaining power (𝛾) increasing productivity (𝑦) and matching of unemployed individuals (𝑚). The same curve instead shifts downwards if the employment exit rate (𝑞) and real interests (𝑟) increase. LD is affected positively by higher productivity (𝑦) and increasing matching function (𝑚). LD shifts downwards in response to a higher exit rate (𝑞), higher real
8
interest rates (𝑟) and higher expenses for vacant positions (ℎ) (Cahuc, Carcillo, & Zylberberg, 2014).
Figure 1. Negotiated wage and labour market tightness.
Source: Cahuc et al. (2014): p. 596, with author’s amendments.
Focusing on the effects of higher minimum wage in the framework of the labour market liberalization, in addition to the increasing minimum wages, we need to address the shift of bargaining power away from the workforce towards the firm. As shown in the graph (Figure 1), a higher minimum wage alone would cause an upwards shift of the WC, up to the new higher wage level, and a decrease in the tightness (𝜃) value. This would be the effect when all other possible factors are excluded and it is assumed that there will be no productivity growth for higher efficiency or perhaps longer working hours (which itself would lead to an upwards shift in labour demand and establish the equilibrium at a point that reduces (𝜃) less). In the case studied in chapter 1, the effects of higher minimum wage are limited since labour market liberalization reduces the bargaining power of employees and acts in the opposite way to the minimum wage effects (a downwards shift of the WC). On the
𝜃 𝜃𝑛𝑒𝑤∗ 𝜃∗ 𝑤 𝑤∗ 𝑧, 𝛾, 𝑦, 𝑚 𝑞, 𝑟 𝑦, 𝑚 ℎ, 𝑞, 𝑟 (WC) (LD) Minimum wage
9
other hand, in the case of a reduction of unemployment benefits (𝑧) (as studied in the second chapter), the WC also moves down, which would lead to higher tightness (𝜃). To understand the effects of the studied policies on unemployment, we will now focus on a second graph (Figure 2). This graph explains the effects in more detail, with the line starting at the origin, which reports the dynamics from Figure 1. The angle of the x-axis of the graph increases with the tightness (𝜃). In other words, the line is steeper when productivity (𝑦) and matching (𝑚) increase. On the other hand, it is flatter when unemployment benefits (𝑧), worker bargaining power (𝛾), costs of vacant positions (ℎ), real interest rates (𝑟), or employment exit rates increase. The curve in the graph, representing the BC, shows the relationship of unemployment and vacant jobs in the plane. The BC shifts downwards in response to an improved matching process (𝑚). In contrast, it shifts upwards if the exit rate of employment (𝑞) increases and if the workforce grows at a higher rate (𝑛) (Cahuc, Carcillo, & Zylberberg, 2014).
Figure 2. Vacant jobs and unemployment.
Source: Cahuc et al. (2014): p. 597, with authors’ amendments.
In our case, considering the new situation in Figure 1, an increasing minimum wage level would lead to a higher general wage level and a lower value of labour
𝜃∗ 𝜃𝑛𝑒𝑤∗ 𝑢 𝑢𝑛𝑒𝑤∗ 𝑢∗ 𝑣 𝑦, 𝑚 𝑧, 𝛾, ℎ, 𝑞, 𝑟 𝑞, 𝑛 𝑚 (BC)
10
market tightness (𝜃∗). Thus, the line in Figure 2 will adapt in response to the rising
minimum wages and be flatter than the original line. The BC would not be affected by this policy change, and therefore, the unemployment rate would increase. The loss of bargaining power of employees due to the liberalization of the labour market would cancel out this minimum wage effect to a certain point.
The second effect is that the vacancy rate (𝑣) and, consequently, the number of vacant jobs will decrease. This effect is derived from the first point, where increasing wages lower a firm’s profits, which also lowers the expected profits from a filled job. This profit is equal to the average cost of an unoccupied job and therefore causes the firm to lower the number of jobs offered on the market (Cahuc, Carcillo, & Zylberberg, 2014).
In the “real world”, where it is not possible to exclusively examine a changing variable, the impact of increasing minimum wages could have different effects than an increase in unemployment. In an economy with growing productivity, for example, the LD could shift upwards in addition to the WC shifting upward, and the result would be a higher wage level and only marginal variation in the labour market tightness. This would result in a situation with an identical unemployment rate and vacant job ratio. Alternatively, an even more extreme situation would occur if the higher productivity (or other factors that impact positively on employment) would more than compensate for the effect of the higher wage, as the employment effect would ultimately be positive (the higher minimum wage leads to higher employment). A second point to mention is the initial ratio of labour market tightness, which affects the strength of the impact of a new wage policy on vacant jobs and unemployment. Imagining an initial situation with a high labour market tightness (many vacant jobs and low unemployment), through the convex BC, the impact of a higher minimum wage would lead to a high reduction in the number of vacant jobs by firms, but the impact on the unemployment rate would be relatively small. The opposite scenario would occur if the initial situation were characterized by a low tightness value, as the
11
effect would be a small reduction in vacant jobs but a stronger impact on the unemployment rate.
Imagining a reduction in unemployment benefits (𝑧), the consequently higher tightness (𝜃) would result in a lower unemployment rate(𝑢∗) and a slightly higher vacancy rate (𝑣), which naturally depends on the shape of the BC.
The following chapters present three different empirical studies using different research methods to apply these theoretical models from producer theory. First, we investigate the interaction of higher minimum wages and employment in the context of labour market liberalization. Second, we study the consequences of a reduction in unemployment insurance benefits on the unemployment rate. Finally, the effects of an exogenous reduction in production output are quantified and discussed.
References
Cahuc, P., Carcillo, S., and Zylberberg, A. (2014). Labor Economics (second edition). The MIT Press, Cambridge.
Borjas, G. J. (2005). Labor Economics. McGraw – Hill, New York.
Bosworth, D., Dawkins, P., & Stromback, T. (1996). The Economics of the Labour Market. Pearson Education, Essex.
Chapter 1
Impact of Labour Market Liberalization on Minimum
Wage Effects: the Case of the Construction Sector in a
Small Open Economy
Luzius Stricker and Moreno Baruffini, Institute for Economic Research (IRE), Università della Svizzera italiana (USI)
Version: June 18, 2020 Published in:
14
Abstract
The objective of this article is to estimate the impact of the application of the bilateral agreement of Free Movement of Persons between Switzerland and the EU-15 countries on the labour market outcomes in the Swiss main construction sector. The analysis happens in the context of increasing minimum wage levels in the industry. The included treatment variable, the minimum wage bite, is compared to the growth of sectoral employment. We conduct two specifications of a Difference-in-Difference (DiD) model, controlling for different characteristics and spatial spillover effects. The results show that the introduction of the Free Movement of Persons reduced the growth rate of employment in the construction sector compared to the growing minimum wage bites, considering the cantons as a box. The results for the specification, including spillover effects, suggest that the employment variation in construction is guided in large part by the local and interregional economic trends. While in open market construction firms do not dispose of instruments to cover higher wages, a country sealing off its markets from an interconnected economic space could pay minimum wages above the marginal productivity of its workers. Making use of an exogenous institutional change, we contribute to the evolving international literature that examines minimum wage effects on labour market outcomes.
JEL codes: C33, J31, J38, J61
Keywords: minimum wage; construction sector; spatial heterogeneity; labour market outcomes; Switzerland
15
1.
Introduction
The Swiss main construction sector is highly regulated compared to the remainder of the economy. A collective labour agreement (CLA) - Landesmantelvertrag (LMV) - ensures minimum wages and employment conditions for all construction employees. In addition, the construction sector recruits a significant part of its low-skilled workforce abroad.
The objective of the article is to estimate the effects of the opening of the Swiss labour markets towards the European Union (EU) and the relative impact on the growth of the labour market outcomes (employment) compared to the variation of the minimum wage bite in a context of rising minimum wages over time. The bilateral application of the Free Movement of Persons Agreement (FZA) by the EU and the Swiss Confederation and the consequently higher worker mobility changed the way in which minimum wage floors affect the functioning of the Swiss construction labour market.
The treatment in this research will be measured regarding the effect that the minimum wage bite, which is the quota of workers in this period earning below the minimum wage of the upcoming year, has on employment. The source of the changes in the treatment variable derives from the rise of the minimum wage level for unskilled employees in the main construction sector. The external shock we want to analyse is the application of the FZA agreement which impacts on the relationship of the minimum wage bite and employment effects. The spatial unit of the study is the cantonal level (NUTS – 3). Furthermore, cantons are used to control for spatial heterogeneity.
Our findings show that because of the application of the FZA in June 2002, the growth rate of employment was lower than the minimum wage bite growth. Considering employment effects, the impact of changed minimum wage bites were different, depending on the chosen specification. The analysis is conducted using a base model and six variations of the model, including different controls as well as
16
spillover effects of the economically interconnected cantons (defined as economic neighbours). The first four models control for different variables (economic structure, firm size and wage dispersion), and all these variables are included in the last model. The last two models control for potential spillover effects of neighbouring cantons, including more or fewer control variables.
This paper makes two contributions to the literature. First, using both a panel data approach and an approach including neighbouring effects, we contribute to the evolving international literature that examines minimum wage effects on labour market outcomes. Second, we focus on the Swiss context, enriching the ongoing research on European cohesion policy. The studied labour market liberalisation focuses specifically on the construction industry, employing both low-wage and high-wage earners and a significant share of the foreign workforce.
We use nationally representative data from the Swiss Labour Force Survey (SLFS)1, which is conducted every year by the Swiss Federal Office of
Statistics (FSO). This survey provides data on workers’ characteristics, such as working hours, earned wages, working places and sector of activity. In addition to this database, information on annually valid minimum wage levels for unskilled employees in the construction sector was extracted from the LMV databases. These are published every year on a cantonal basis by the Swiss constructors’ association (Baumeisterverband SBV).
Our analysis of the impacts of the FZA in the Swiss main construction sector is structured as follows. Section 2 reviews the literature concerning minimum wages and economic liberalisation. Section 3 introduces the institutional setting, describes the data and our measures of minimum wages in Switzerland. Finally, it formalises the model and the variations. The results are discussed in Section 4, and Section 5 presents concluding remarks.
17
2.
Literature Review and Theory Development
This paper contributes to the recent literature, combining two different streams of research in a joint Difference-in-Difference (DiD) model. From the methodological point of view we try to contribute to the broad DiD literature. We follow the approaches widely discussed by Abadie (2005) and Author (2003), as well as the important application of Card (1992), which helps to refine the research strategy of the present work. Last we refer to the contribution of Bertrand et al. (2004) with important implications on the detailed empirical strategy. As novelty we analyse the impact of the labour market liberalization in a classic minimum wage and employment effects model. For this aim the following part tries to reappraise the existing literature in the two fields and to highlight the relevant parts for the analysis.
2.1. Minimum Wage Bite and Wage Effects
A broader literature refers to the impacts of minimum wages on the labour market, this subject has been extensively researched during the last decades. A review of the literature on this topic is in detail explained in the book of Cahuc et al. (2014).
From a theoretical point of view, minimum wages can have an effect in two ways: on the one hand, the introduction of minimum wages can lead to transitional labour market flows (Mortensen and Pissarides, 1994) and job matches under a certain productivity level are destroyed. Moreover, the introduction of minimum wages may change the optimal combination of firm and worker characteristics.
On the other hand, the introduction of minimum wages may have an effect on equilibrium outcomes. If a minimum wage is above the reservation wage before its introduction, it simply deletes jobs. Moreover, if the minimum wage implies a lower level of salaries, it conducts to a lower level of direct job-to-job transitions (van den
18
Berg and Ridder, 1998). Finally, the effect depends on the elasticities of job search and of vacancy creation. The final effect is therefore not clear ex ante, and for this reason there are several empirical approaches.
Vom Berge and Frings (2019) model the effects of a minimum wage introduction in the several districts of the German economy. Their benefits are to include spatial spillover effects and to use the minimum wage bite as treatment variable, both factors that our model considers in a similar way.
Recent literature, for example for Canada (Brochu & Green, 2013), Portugal (Portugal & Cardoso, 2006), United States (Dube et al., 2010) and on Germany (Bachman et al., 2012), in summary state that the employment effects of minimum wages are probably small or inexistent for total employment. Only the weaker part of the workers could be affected, justifying the focus on the bite for the research. (Kampelmann, Garnero, & Rycx, 2013). Consequently, the minimum wage bite (the bite calculated on the next year’s minimum wage) is an adequate measure because it best captures the marginal employees that are at highest risk of unemployment.
Dolton et al. (2012), in their analysis of the impact of minimum wages on employment and inequality, relied on the minimum wage bite as a variable of analysis: they illustrate their reasoning and justification for the adoption of the minimum wage bite in the analysis. Their explanations, using a structural econometric model, consist of two equations, which were already suggested in the previous literature by Card (1992) and Stewart (2002). The first of the two equations takes up the concept of labour demand. It describes the move of the employment rate (∆𝐸𝑗) along the labour curve with the set wage level. In other words, employment
is defined as a function of the wage. In the second equation, a form of identity, the wage variation, is a function of the proportion of the low-paid workers (𝑃𝑗).
Substituting the second equation in the labour demand equation, the equation changes as follows (Dolton, Bondibene, & Wadsworth, 2012):
19
∆𝐸𝑗 = 𝛾0+ 𝜂𝛼1+ 𝛽𝑃𝑗 + 𝜀𝑗
where (𝛽 = 𝜂𝜆), and (𝜆) is assumed to be positive, implying that (𝛽) has the same sign as (𝜂), and according to economic theory, both are negative. In other words, a higher proportion of low-paid workers, in our case, contributing to a higher bite, would result in a negative variation of employment (Dolton, Bondibene, & Wadsworth, 2012).
Steward (2002) sets the precondition for identification of this model as the proportion of the low-paid workers (𝑃𝑗) being a predetermined instrument for the
endogenous wage change. We discuss this precondition, which implies that an endogenous variation of the bite through variation of the workforce composition can be neglected, in the next Section. In our research, the bite is consequently defined to be affected by changing minimum wage policy and economic conditions, but not through more than proportional growth of the low-wage workforce.
2.2. Effects of Labour Market Liberalisation
Favre (2011) follows the approach of analysing the competition among workers along the entire wage distribution as proposed by Dustmann et al. (2013) and shows that the competition between natives and immigrants are at the two tails of the wage distribution. This approach is in contrast to the earlier literature in the field that presents the correlation of the mean wage variation in response to the market liberalisation across spatial units. Data from the years preceding 2011 provide evidence about the changes in the education level of immigrants in Switzerland. Due to the labour market liberalisation between Switzerland and the European Union, highly skilled workers also started to be attracted. This trend is also emerging in the wage distribution, where immigrants have been recently overrepresented in the low and high wage classes (Favre, 2011).
20
Our analysis, focusing on the correlation between average wages and employment with the minimum wage bite growth, follows the standard literature.
Nevertheless, the insights gained from the work of Favre (2011) are useful for the understanding and interpretation of the results. A further distortion is that not each region is similarly attractive to immigrants, but they tend to allocate in areas with an already high presence of other immigrants of their nationality. This might attract more immigrants from countries with languages different from the Swiss national languages. In addition, a second issue is the inter-regional mobility of workers, which can cause employees to move from one place to another with less competition in earnings.
A work published by Gilpin et al. (2006) focuses on the effects of the European free movement of workers agreement on the UK labour market. The policy was implemented in a time of rising unemployment in 2005, and therefore, this was dealt with as one of the contributors to unemployment. The research finds no statistical evidence that the agreement was a contributor to the higher unemployment.
Focusing on the wage effects, the research takes into consideration the growth rate of the Average Earnings Index. For this comparison, there is low evidence of a fall in nominal wage growth in reaction to market liberalisation. No discontinuity in the wage growth rate was observed, and even for the missing counterfactual, it was not possible to find a significant effect of immigration on wages (Gilpin, Henty, Lemos, Portes, & Bullen, 2006).
Our hypothesis is that as a consequence of the liberalization of the Swiss labour market the median wage of the common space falls with respect to the minimum wages of construction. According to previous studies discussed by Neumark and Wascher (2008), this would lead to stronger minimum wage effects and put pressure on employment of this industry.
21
3.
Material and Methods
3.1. The Swiss Construction Sector
According to the most recent data from 2016, the construction sector achieved a net product of 33.71 billion (bn) CHF overall. Compared to the nominal Swiss gross domestic product (GDP) of 650.11 bn CHF, this corresponds to 5.15% of the GDP. Regarding achieved revenues in 2016, civil engineering with 10.17 bn CHF slightly exceeded structural engineering, which reached revenues of 9.80 bn CHF. The entire construction sector employed 80,700 workers in September 2016, of which 65,400 were workers on the construction side, 10,800 technical and service employees and 4,600 trainees. The labour force was composed of 56% of foreigners (45,300 employees), compared to 35,400 native workers. The average wage achieved across the entire construction sector amounted to 5,765 CHF per month across all wage classes. (Baumeisterverband, 2016)
Concerning the percentage of GDP, the expenses for construction decreased over the years, reaching a minimum in 2008 as a consequence of the financial crisis, and registered a smooth increase since then. In contrast, the net nominal product of the sector increased overall, except for an expected slight reduction for the last year considered year 2016 in the data (Baumeisterverband, 2016).
It is essential to understand how the share of expenses on construction change in Switzerland. One point to focus on is undoubtedly the productivity of the workforce. Increasing productivity means that the output costs can be reduced, workers’ wages can be increased, or the firm's profits can be higher. In a competitive sector such as main construction, the first two alternatives are the most plausible. According to the historical data (Figure 3), (real) labour productivity in the construction sector was increasing in the eighties, and then, starting in the nineties, no significant increments were registered.
22
Figure 3. Labour productivity (real in full-time equivalents) in the Swiss construction sector.
Source: Data from BAK Basel -labour productivity in construction.
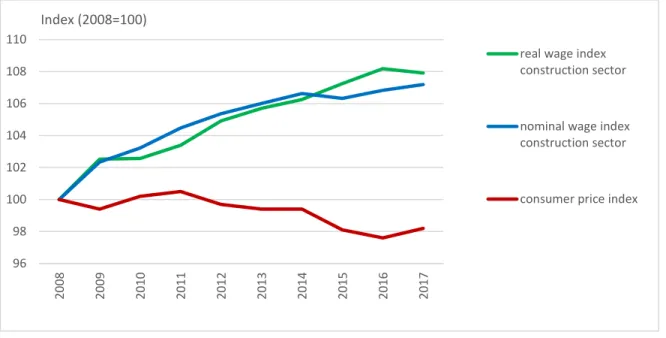
Remembering the three alternative effects of increasing productivity, it is worth focusing on the growing productivity of the workforce as a primary driver for wage growth. The trend over the past couple of years shows that the wages of employees in the construction industries were continuously growing over time. In real terms, compared to the inflation index, they grew (as shown in Figure 4 below). Since 2008, the wages of construction site employees (covered by the national collective wage agreement “Landesmantelvertrag” (LMV)), which will be the focus of this work, grew by 8.5%, on average, in real terms. Only supervisors’ real wages grew even more (Baumeisterverband, 2016). 90 100 110 120 130 140 150 160 170 180 1980 1982 1984 1986 1988 1990 1992 1994 1996 1998 2000 2002 2004 2006 2008 2010 2012 2014 Index (1980 = 100)
23
Figure 4. Wages in the main construction sector and inflation.
Source: Swiss Federal Office of Statistics (SFO) – real and nominal wages in construction and consumer price index.
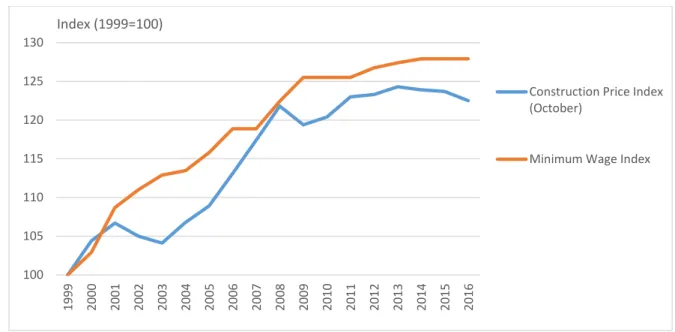
A further possibility for a firm facing higher labour costs is to forward the additional expenses directly to the consumer market. Giupponi and Machin (2018) therefore checked for this possibility in their study on minimum wages in the care home industry. Figure 5 compares the indexed growth of the prices of the construction industry and the indexed growth of the minimum wages in the sector. We can divide the period into two parts. The first covers the years preceding 2008 and presents a significant relative growth of minimum wages, which is linked to growing construction prices. In the second period of the most recent years, construction prices stagnated on a stable level and therefore entailed a limited capacity to absorb higher wage costs, which were passed on to the consumer. The evidence from this data comparison suggests a partial absorption of the wage effect on employment and a lower employment effect than there would have been in the absence of this absorption. 96 98 100 102 104 106 108 110 200 8 200 9 201 0 2011 2012 2013 2014 2015 201 6 201 7 Index (2008=100)
real wage index construction sector
nominal wage index construction sector
24
Figure 5. Minimum wage index in the construction sector and construction price index (month of October).
Source: Data from the Swiss Federal Office of Statistics (SFO) – construction price index and minimum wage data from the collective labour agreements of the Swiss constructors’ association (Baumeisterverband).
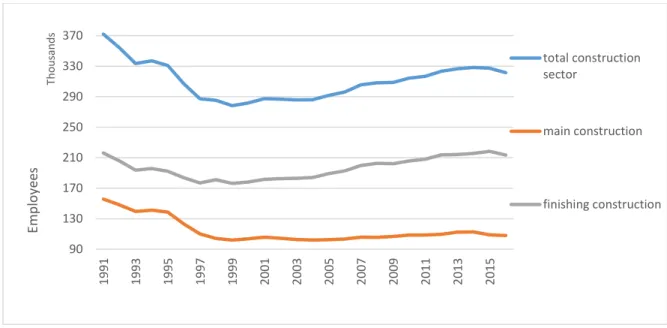
Again considering the labour market outcomes, the hypothetically higher productivity of the workforce could be translated into a reduced requirement for the workforce to produce the same amount of output. For this reason, the next focus is on the number of employees in construction over time. Figure 6 below highlights the variability of the workforce in the Swiss main construction sector. The sector registered a drop in employment as a consequence of the real-estate bubble in the nineties and grew afterwards until 2014. In the last few years, employment fell again. Most of the growth was registered in the finishing construction segment, a part of the sector that does not apply minimum wages as proposed in the LMV. The main construction sector grew by less (Baumeisterverband, 2016).
100 105 110 115 120 125 130 1999 2000 2001 2002 2003 2004 2005 2006 2007 2008 2009 2010 2011 2012 2013 2014 2015 2016 Index (1999=100)
Construction Price Index (October)
25
Figure 6. Employment (full-time equivalents) in the construction sector (in the third quarter of the year).
Source: Data from Swiss Federal Office of Statistics (SFO) – Job Statistics.
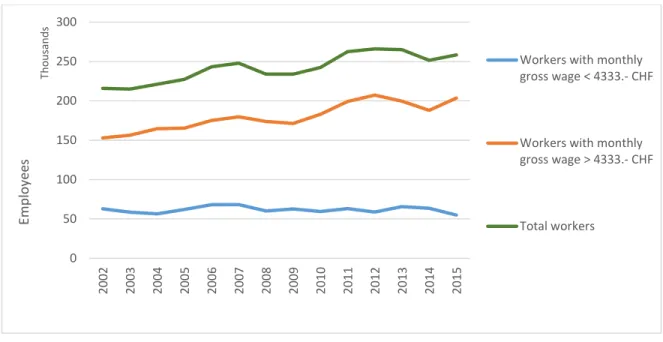
The main focus of this study is on the minimum wage variation as a result of higher pressure on the labour market. We need to limit the effect of a heterogeneous growth of the workforce in the sector that could endogenously affect the variation of the minimum wage bite. For this reason, we choose to analyse the growth of the low-wage and high-low-wage workforce compared to the total growth of the workforce in the construction sector in each of the Swiss greater regions (NUTS-2). Figure 7 shows these trends for Switzerland at the national level. Over the observed years, total employment in the construction sector grew. In addition, the data highlight that this growth was mainly due to the evolution in the high-earning share of the workforce, while the number of low-wage employees remained stable in the same period. This trend is valid for each of the greater regions of Switzerland. We can exclude from this point of view a rising minimum wage bite as a consequence of a more than proportional growth of the employment in the lower part of the wage distribution. Variations in the minimum wage bite, in this case, must be the result of the exogenous variation of the minimum wage level and the changing economic environment and conditions.
90 130 170 210 250 290 330 370 1991 1993 1995 1997 1999 2001 2003 2005 2007 2009 2011 2013 2015 Em p loy ee s Tho us an ds total construction sector main construction finishing construction
26
Figure 7. Employment in the construction sector in Switzerland, by wage classes.
Source: Data from Swiss Federal Office of Statistics (SFO) – Swiss Labour Force Survey (SLFS).
A crucial last factor is the educational level of the employees in the main construction sector because the lowest possible minimum wage applied to unskilled workers is the point of reference for this study. Therefore, unskilled workers are potentially most affected by varying minimum wages, particularly if the focus is on the lowest wage group. The increasing number of skilled workers in the labour force is due to the increasing complexity of construction sites. Many tasks require specialised skills to keep up with technological progress.
Moreover, in general, the quota of unskilled workers on the Swiss labour market is decreasing. Only the share of supervisors is nearly unchanged over the years. The exclusion of supervisors in the general trend towards higher-skilled workers is mainly because they execute jobs that are different from those of the two other groups of workers (office work rather than jobs on the construction site) (Baumeisterverband, 2016). 0 50 100 150 200 250 300 2002 2003 2004 2005 2006 2007 2008 2009 2010 2011 2012 2013 2014 2015 Em p loy ee s Tho us an ds
Workers with monthly gross wage < 4333.- CHF
Workers with monthly gross wage > 4333.- CHF
27
3.2. Free Movement of Persons Agreement (FZA) Switzerland – EU
In 1999, Switzerland signed bilateral agreements with the European authorities and countries, and the population approved them in May 2000. According to the bilateral agreement on Free Movement of Persons (FZA), all citizens of European countries have the right to freely choose their location of residence within the zone of all contractual partners. Additional components of the agreement were the coordination of the national social security systems and the mutual recognition of foreign professional diplomas.
The agreement was adopted gradually during a transition phase, and instruments such as priority to natives and contingency systems could still be applied unilaterally. These measures were also known as "valve clauses" to ensure a gradual and controlled merger of labour markets. For the original 15 EU nations, Malta and Cyprus, the agreement was to start on June 1st, 2002, and entered in full application in 2007, after which it was no longer possible to apply "valve clauses" (EDA, 2017).
In 2007, the border zones of Switzerland were abolished, and through this, a further limitation to labour mobility was removed (Verein-Grenzgänger, 2013). After this, even citizens from non-neighbouring countries could work in Switzerland with a cross-border commuter permit. This further policy change caused a second wave (after 2001/2002) of strong relative growth in the number of cross-border commuters in Switzerland.
To reduce violations against Swiss wage and labour conditions, supporting measures were applied in 2004. These measures made it possible to ensure that employers meet the conditions that are foreseen in CLAs and that foreign service providers maintain guidelines contained in the employee secondment law. Tripartite commissions are in charge of controlling and checking the application of these measures. The commissions are composed of representatives from public authorities, employers and labour unions. Their main task is to check for compliance with regular and CLA norms. The employment secondment law has been adapted continuously to
28
meet the requirements of a changing environment and growing zone of application of the Free Movement of Persons Agreement. In this way, the most recent refinements were taken in the inclusion phase when Romania and Bulgaria into the agreement (EDA, 2017).
4.
Dataset
This study is based on data from the Swiss Labour Force Survey (SLFS) and supplementary and specific data about minimum wage levels for main construction workers in Switzerland; in addition, data from the Swiss Federal Office of Statistics (SFO) were used to define spatial parameters and regional peculiarities.
The first of the two primary data sources, the SLFS, is annually conducted by the SFO and has interviewed up to 105,000 subjects since 1991. The questionnaires include several features around the topics of employment, unemployment and the educational and professional background of the interviewees. Further questions cover geographic and sociodemographic issues. Social security, education and migration topics complete the survey. For this research, the variables that identify the sector and industry of activity of an employee, as well as the identification of the geographical unit (Switzerland’s 26 cantons), are of particular interest. The core element for the aim of this research is the wages associated with the share of workers employed in the main construction sector. Those wages, however, are not revealed uniquely and therefore need to be standardised to guarantee comparability. All wages are counted as annual net wages to compare employees with salaries on an hourly basis and part-time employees with full-time wage earners.
The process of wage standardisation follows three principles, concerning the working hours per worker, the contributions of unemployment insurance (ALV) and the pension fund contributions. This SLFS microdata in the end was then aggregated into a cantonal panel data set, including both wage and employment indicators divided by year and cantons.
29
Moreover, taking into consideration the minimum wage for the main construction sector in accordance with the collective wage agreement (LMV), it is possible to draw a local minimum wage that formulates the reference independently of qualifications. The first national agreement was accorded during 1998 and officially enacted in January 1st 1999, for this reason construction minimum wages exist since then. These wages are divided into three different categories that take into account spatial heterogeneity. For cantons that are split up in two different wage categories (Bern, Schwyz, St. Gallen, Solothurn), following a precautionary principle, the lower of the two included levels was considered as a reference. The provided minimum wages are standardised according to the personal characteristics on an annual net level, following the same principles described above and according to individual characteristics, determined in this case by the spatial association with the canton of activity.
Finally, the merging of the two databases, including observations from years 1999-2016, allows for the construction of the final panel dataset including the determinants of all 26 Swiss cantons over a period of 17 years. The main variables for this panel define the economic structure, the importance of the construction sector in a particular region, and the workplace distribution among different economic sectors. The primary independent variable includes a reflection of the wage structure prevailing in the main construction sector. We focus on the effects of changing wage policies in the labour market, which are changing levels of employment in the sector. This issue is discussed with a particular focus on the theoretical part of this work. The variables consider the main construction sector’s changing wage structure and the employment effect, which is formalised concerning a relative change in employment on a logarithmic scale. The second of these two variables, including all others except the main construction sector, is constructed similarly and then included as a further independent variable in the model.
When choosing the measure to analyse the effects of a given wage floor, researchers frequently have to deal with the minimum wage bite. This section is
30
devoted to the explanations that favour the choice of this measure to evaluate the impacts of defined wage policies.
As explained in detail by Kampelmann, Garnero and Rycx (2013), the Kaitz index (the relation of minimum wages to the overall wage distribution) is not the right measure for all issues, especially not for studying the impact of minimum wage policies. The minimum wage bite is the better choice for this aim. It focuses on a particular part of the wage distribution, namely, the employees earning wages at and below the minimum wage threshold. An interesting application of the bite consists of focusing on the effects of an increased minimum wage in a defined sector. Following the neoclassical models for the labour market, this would imply that workers in the minimum wage bite would lose their job if they were not able to increase their marginal productivity above the new wage. The variation of the bite is, according to this framework, a measure that helps understand the reaction of the firms. They still have the possibility to pass the higher production costs to the customer or to reduce their actual profits. Alternatively, as previously mentioned, the productivity of employees can improve, for example, by taking additional courses or reviewing the organisational structure of firms (Kampelmann, Garnero, & Rycx, 2013).
On average, across all observed years, 10% of employees are employed on a marginal wage basis – this means that they earn salaries that would be below the minimum wage the upcoming year (the minimum wage bite). This distribution is not homogeneous across the 26 cantons and is not persistent over time.
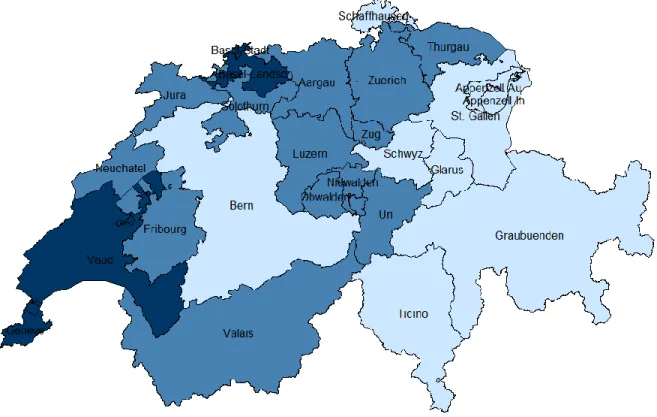
Each of the 26 cantons is grouped in one of the three “regions” that define the level of wages that apply to all employees of the sector (Figure 8). The highest levels are applied in the two cantons of Geneva and Vaud in the western part as well as the two cantons of Basel-Stadt and Basel-Landschaft. The lowest levels are applied among the cantons situated in the south-eastern part of Switzerland, Schaffhausen and Bern.
31
The evolution of the minimum wage levels in absolute terms for the three above-mentioned regions is presented in the following figure (Figure 9) for the entire period of analysis. The colours of the lines in the figure (Figure 9) correspond to the three regions in the map (Figure 8), with the darkest line applying the highest minimum wage level and the lightest one applying the lowest possible level in the region.
Figure 8. Regions with different minimum wage levels according to the collective labour agreement.
Source: Authors’ illustration based on minimum wage data from the collective labour agreements of the Swiss constructors’ association (Baumeisterverband).
32
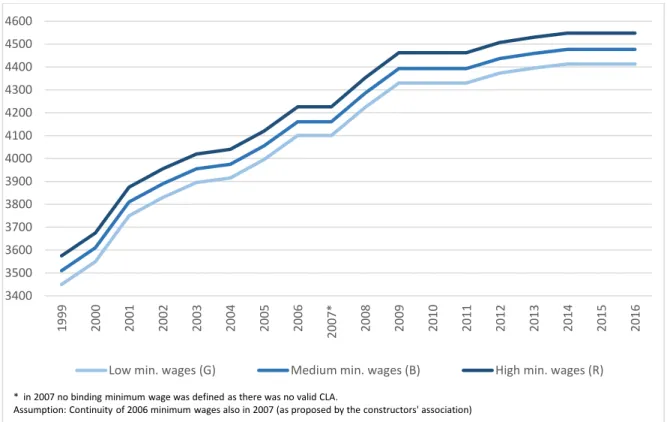
Figure 9. Monthly gross minimum wages for unskilled workers in the construction sector 1999-2016, for each of the three regional minimum wage levels.
Source: Authors’ calculations based on minimum wage data from the collective labour agreements of the Swiss constructors’ association (Baumeisterverband).
The average annual net wage of employees in the main construction sector in Switzerland is 72,086 CHF, and it is 95,560 CHF for the other sectors in 2010. The share of employees in the main construction sector represents, on average, 3.5% of total employment. These values also change across cantons.
A factor that might influence the wage differentials across cantons is the different relative importance of the construction sector in the regions. A higher concentration of the construction sector can be explained in the less densely populated regions, as there is a relatively high requirement for civil engineering to maintain traffic and public infrastructure. Furthermore, regions with a low presence of workplaces in other industries and regions without any large centre offering services show a higher share of the construction sector in the regional economy.
3400 3500 3600 3700 3800 3900 4000 4100 4200 4300 4400 4500 4600 1999 2000 2001 2002 2003 2004 2005 2006 2007* 2008 2009 2010 2011 2012 2013 2014 2015 2016
Low min. wages (G) Medium min. wages (B) High min. wages (R)
* in 2007 no binding minimum wage was defined as there was no valid CLA.
33
5.
Method and Empirical Strategy
The basis for the construction of the model is the approach proposed by vom Berge and Frings (2019), who focused on the introduction of a minimum wage in Germany and the effects on the labour markets, distinctly for Western and Eastern Germany. They combine the panel approach of Neumark and Wascher (1992) with the approach of applying minimum wage bites, as in Card (1992). According to vom Berge and Frings (2019), the post-treatment effects are different from the effects in the period preceding the exogenous shock. In their paper, they use the introduction of the minimum wage in 1997 in Germany. The cut-off for the present study is the application of the Free Movement of Persons Agreement in Switzerland in 2002 with the original 15 EU countries. Differential trends of the minimum wage effects are captured analogously in the pre-treatment period following Dolton, Bondibene and Wadsworth’s (2010) study in the UK.
For the first estimation, we followed vom Berge and Frings (2019) but varied and adapted the specifications to explain the various effects of the policy adaptation on the labour market outcome. We further included a continuous time trend instead of the time fixed effects according to the research focus and because the impact of the policy application takes place across a more extended period after the policy introduction and concerns a smooth application of the labour market liberalisation, rather than a particular impact in time. This choice is based on the assumption that the effect we estimate is smoothly being adopted and not as a shock in a specific year. The difference between the two models applied is that the first one considers the local economy in a box, while the second analysis includes spatial spillover effects from interconnected cantons. Both models have been tested for consistency, leaving out some of the included control variables.
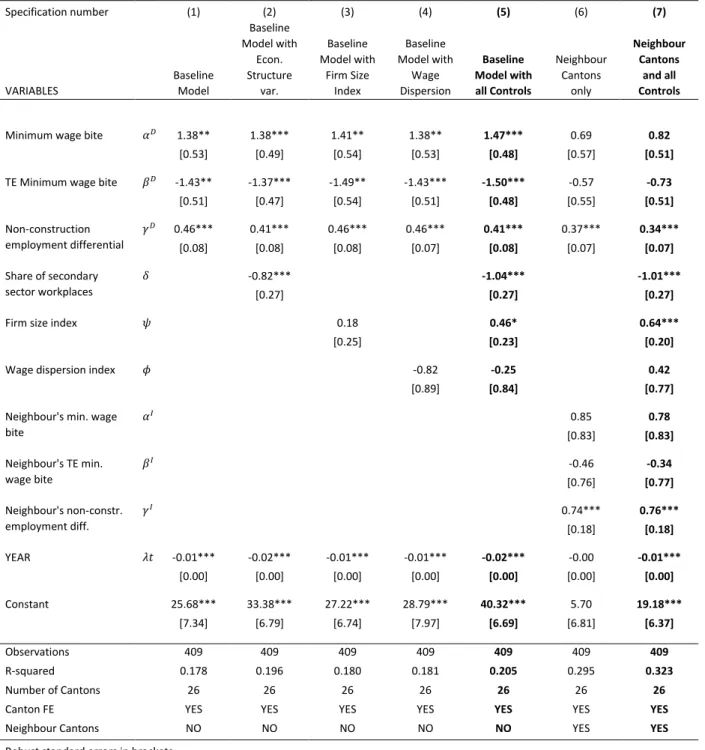
The first part considers the control variables, which are specific to each canton without taking into account the interconnectedness of the regional labour markets within the same country. The model (in the results table 1 specification 5) includes
34
(𝑦𝑖𝑡+1)describing the employment growth in region (𝑖) (in our case cantons) in the
time from (𝑡) to (𝑡 + 1), (𝑑) is the indicator for the post-treatment effect (in this case, the introduction of the minimum wage). Similar to vom Berge and Frings (2019) we chose to use the growth of employment as dependent variable instead of levels since we are interested on the sign of the employment variation and not in describing what actually defines the stock of employees. (𝛽𝐷) captures the treatment effect on the
minimum wage. (𝑥𝑖𝑡) instead would be the mean employment or wage growth in the
other industries, except for all construction sectors. (𝜇𝑖) represents canton fixed
effects and (𝜆𝑡) a continuous time trend. Furthermore, the variable (𝑞𝑖𝑡) represents the ratio of secondary sector workplaces compared to third sector workplaces, and the variable (𝑠𝑖𝑡) is constructed as the number of firms with 50 or more employees divided by the number of firms with less than 50 employees for every canton in every year. Last, a control variable (𝑟𝑖𝑡) is constructed as the coefficient of the 25% quantile divided by the 75% quantile of the wage distribution in year (𝑡) and canton (𝑖). It is worth to remember that this control variable is calculated for the analysed year (𝑡), differently from the computation of the minimum wage bite, which we calculate based on the wage distribution of the upcoming year (𝑡 + 1) and therefore are not describing the same data. This last control measures the wage dispersion in the construction industry. We choose to include those variables in order to capture the peculiarities and to describe the structure of the local economies in the single cantons.
∆ ln 𝑦𝑖𝑡+1 = 𝑏𝑖𝑡𝛼𝐷 + (𝑑 × 𝑏𝑖𝑡)𝛽𝐷+ ∆ ln 𝑥𝑖𝑡𝛾𝐷+ 𝑞𝑖𝑡𝛿 + 𝑠𝑖𝑡𝜓 + 𝑟𝑖𝑡𝜙 + 𝜇𝑖 + 𝜆𝑡 + 𝜖𝑖𝑡
In our study, the focus is on the employment effects of labour market liberalization and not on wage redistribution, as in vom Berge and Frings (2019). The formulation focuses on the employment effects and the reduction of workplaces in response to higher minimum wages, again using the pre-FZA period for calibration and the post-treatment period to focus on this problem.
In addition to this model, four variations (specifications (1)-(4)), each considering only some of the variables and controls, are applied to check for the consistency of the results in specification (5) considering the cantons as single, closed entities.
35
The second model design, unlike the first, includes the possibility that variations in interconnected local labour markets affect neighbouring cantons. Borders among cantons are open and depend on the geographic position; mobility is rather high among some of them. It could therefore be a problem to analyse the effects keeping the cantons as separate units without taking into account the trends of their neighbours. This specification includes, in addition to the already included variables, average values of the independent variables from the surrounding cantons. We distinguish the direct effects (𝐷), or the variable characterising the trend and situation in the analysed canton, and the indirect effects (𝐼) that capture the impact of the average of the variables of all cantons being economically interconnected with the analysed one. The two variables (𝑏𝑖𝑡) and (𝑥𝑖𝑡) are averaged for all the
neighbouring cantons (𝑁) as a weighted average and included in the regression. Weights (𝑓𝑗𝑖) are constructed as the share of all inbound commuters towards
canton (𝑖) having residence in canton (𝑗); these data come from the MZMV 20152 and
are maintained fixed across the analysed period. We chose to include this kind of spillover effects for the present case rather than spatial econometrics since Switzerland has a particular topography and the constructed matrix of the commuter streams is more suitable to account for the relative interdependence of the local labour markets among the cantons. In this definition every canton is a neighbour of all the remainder and the larger the commuter stream is the “closer” this regions are by definition, independent of their geographical position. Adapting this as the baseline model, the following regression (specification 7 in the results table 1) can be written: ∆ ln 𝑦𝑖𝑡+1 = 𝑏𝑖𝑡𝛼𝐷+ (𝑑 × 𝑏𝑖𝑡)𝛽𝐷+ ∆ ln 𝑥 𝑖𝑡𝛾𝐷+ 𝑏̅̅̅̅𝑖𝑡 𝑁 𝛼𝐼+ (𝑑 × 𝑏̅̅̅̅𝑖𝑡𝑁) 𝛽𝐼+ ∆ ln 𝑥̅̅̅̅𝑖𝑡𝑁𝛾𝐼 + 𝑞𝑖𝑡𝛿 + 𝑠𝑖𝑡𝜓 + 𝑟𝑖𝑡𝜙 + 𝜇𝑖 + 𝜆𝑡 + 𝜖𝑖𝑡 𝑤ℎ𝑒𝑟𝑒: 𝑏̅̅̅̅𝑖𝑡𝑁 = ∑ 𝑓𝑗𝑖∗ 𝑏𝑗𝑡 26 𝑗=1 𝑎𝑛𝑑 ∆ ln 𝑥̅̅̅̅𝑖𝑡𝑁= ∑ 𝑓𝑗𝑖 ∗ ∆ ln 𝑥𝑗𝑡 26 𝑗=1