HAL Id: inserm-01887911
https://www.hal.inserm.fr/inserm-01887911
Submitted on 4 Oct 2018HAL is a multi-disciplinary open access
archive for the deposit and dissemination of sci-entific research documents, whether they are pub-lished or not. The documents may come from teaching and research institutions in France or abroad, or from public or private research centers.
L’archive ouverte pluridisciplinaire HAL, est destinée au dépôt et à la diffusion de documents scientifiques de niveau recherche, publiés ou non, émanant des établissements d’enseignement et de recherche français ou étrangers, des laboratoires publics ou privés.
Validity of summary statistics-based mixed-effects group
fMRI
Camille Maumet, Thomas E. Nichols
To cite this version:
Camille Maumet, Thomas E. Nichols. Validity of summary statistics-based mixed-effects group fMRI. OHBM 2018 - 24th Annual Meeting of the Organization for Human Brain Mapping, Jun 2018, Sin-gapore, Singapore. pp.1-2. �inserm-01887911�
Validity of summary statistics-based mixed-effects group fMRI
Camille Maumet1 and Thomas E. Nichols1,2
1. University of Rennes, Inria, CNRS, Inserm, IRISA, Rennes, France.
2. Oxford Big Data Institute, Li Ka Shing Centre for Health Information and Discovery, Nuffield Department of Population Health, University of Oxford, Oxford, UK.
Introduction
Statistical analysis of multi-subject functional Magnetic Resonance Imaging (fMRI) data is traditionally done using either: 1) a mixed-effects GLM (MFX GLM) where within-subject variance estimates are used and incorporated into per-subject weights or 2) a random-effects General linear model (GLM) (RFX GLM) where within-subject variance estimates are not used. Both approaches are implemented and available in major neuroimaging software packages including: SPM (MFX analysis; 2nd-Level statistics), FSL (FLAME; OLS) and AFNI (3dMEMA; 3dttest++). While MFX GLM provides the most efficient statistical estimate, its properties are only guaranteed in large samples, and it has been shown that RFX GLM is a valid alternative for one-sample group analyses in fMRI [1]. We recently showed that MFX GLM for image-based meta-analysis could lead to invalid results in small-samples. Here, we investigate whether this issue also affects group fMRI.
Methods
GLM can be expressed with: Y = Xβ + ε, where Y is the N-vector of subject-level contrast estimates, X the design matrix, β the group parameter to estimate and ε the random error. In group fMRI, the error term has two contributions, from within- and between-subject variance.
MFX GLM. Using within-subject variance estimates requires a weighted least squares (WLS) approach, where the
group parameter β is a weighted average of the subject-level contrasts. The weights are inversely proportional to the sum of the within- and between-subject variances. But in practice, those weights are unknown and have to be estimated from the data leading to a Feasible Generalised Least Squares (FGLS). FGLS is asymptotically efficient but its finite sample properties are unknown [2]. We used FSL’s ‘FLAME 1’ FGLS that uses maximum likelihood to estimate between-subject variance, computing a T-statistic compared to a Student distribution with N-1 degrees of freedom (DF) [3].
RFX GLM. Under the assumption that the within-subject variance is constant or negligible in comparison to the
between-study variance, the weights above are equal and the GLM can be estimated with Ordinary Least Squares (OLS), β estimated as the average of the subject-level contrasts. We used SPM’s 2nd level one-sample model, computing a T statistic also compared to a Student distribution with N−1 DF [4]. OLS p-values are exact for any sample size, in contrast to FGLS which are only asymptotically valid [2].
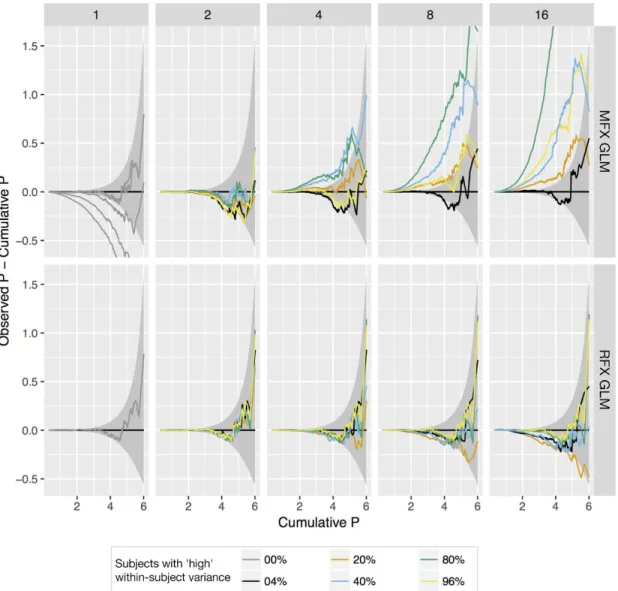
We used Monte Carlo simulations to investigate the validity of MFX and RFX GLMs under varying degrees of within-subject variance heteroscedasticity. Within-subject variances took on 2 values, a ‘good’ value and a ‘high’ values of 2, 4, 8 & 16x good values; we considered 4%, 20%, 40%, 80% or 96% of the subjects to have the high values. We fixed the mean within-subject standard error to be equal to the between-subject variance. We assumed 25 subjects per group and 1000 independent time points per subject. Accuracy was assessed by comparing FSL & SPM distributions of -log10 P-values to Monte Carlo -log 10 P-values based on 10ˆ6 realisations.
Results
Fig. 1 presents deviation from theoretical P-values with varying percentage and intensity of high intra-subject variance. For low intensity heteroscedasticity (<= 2x), MFX GLM is valid but becomes increasingly invalid in the presence strong and prevalent high variance subjects. RFX GLM is valid with all settings but displays some conservativeness in the presence of strong heteroscedasticity.
Conclusions
Here we investigated the validity of RFX and MFX GLMs in the presence of varying within-subject variance. As previously shown in the literature [1], we observed that RFX GLM is robust to the presence of heteroscedasticity. More surprisingly, MFX GLM was invalid in the presence of high variations in within-subject variances. More work is needed to investigate which of these settings is closest to the patterns present in real fMRI data. In the meantime, we recommend RFX GLM when working with small samples.
Fig. 1. Deviation of observed from theoretical P-values (difference of observed and Monte Carlo (‘true’) -log10 p-value distributions) for one-sample tests in the presence of varying percentages of subjects with outlying within-subject variances, high-variance factor 2, 4, 8 or 16, (columns), MFX GLM and RFX GLM (rows). Y-axis is the observed cumulative probability minus Monte Carlo cumulative probability for a given (X-axis) -log10 p-value; positive deflections correspond to inflated false positive risk.
Acknowledgments
This work was supported by the Wellcome Trust. The majority of this work was conducted while TEN and CM were at the University of Warwick and used the High Performance Computing cluster of the Department of Statistics, University of Warwick.
References
1. Mumford JA, Nichols TE. Simple group fMRI modeling and inference. Neuroimage. Elsevier Inc.; 2009;47: 1469–1475.
2. Greene WH. Econometric analysis. Pearson Education India; 2003;
3. Woolrich MW, Behrens TEJ, Beckmann CF, Jenkinson M, Smith SM. Multilevel linear modelling for FMRI group analysis using Bayesian inference. Neuroimage. 2004;21: 1732–1747.
4. Penny WD, Friston KJ, Ashburner JT, Kiebel SJ, Nichols TE. Statistical parametric mapping: the analysis of functional brain images: the analysis of functional brain images. Academic press; 2011.