Publisher’s version / Version de l'éditeur:
Journal of Thermal Insulation, 11, pp. 165-188, 1988-01
READ THESE TERMS AND CONDITIONS CAREFULLY BEFORE USING THIS WEBSITE. https://nrc-publications.canada.ca/eng/copyright
Vous avez des questions? Nous pouvons vous aider. Pour communiquer directement avec un auteur, consultez la première page de la revue dans laquelle son article a été publié afin de trouver ses coordonnées. Si vous n’arrivez pas à les repérer, communiquez avec nous à PublicationsArchive-ArchivesPublications@nrc-cnrc.gc.ca.
Questions? Contact the NRC Publications Archive team at
PublicationsArchive-ArchivesPublications@nrc-cnrc.gc.ca. If you wish to email the authors directly, please see the first page of the publication for their contact information.
NRC Publications Archive
Archives des publications du CNRC
This publication could be one of several versions: author’s original, accepted manuscript or the publisher’s version. / La version de cette publication peut être l’une des suivantes : la version prépublication de l’auteur, la version acceptée du manuscrit ou la version de l’éditeur.
Access and use of this website and the material on it are subject to the Terms and Conditions set forth at
Heat transfer in a wet porous thermal insulation in a flat roof
https://publications-cnrc.canada.ca/fra/droits
L’accès à ce site Web et l’utilisation de son contenu sont assujettis aux conditions présentées dans le site LISEZ CES CONDITIONS ATTENTIVEMENT AVANT D’UTILISER CE SITE WEB.
NRC Publications Record / Notice d'Archives des publications de CNRC:
https://nrc-publications.canada.ca/eng/view/object/?id=6d372f75-cacf-40fb-b375-26ed71fea9a4 https://publications-cnrc.canada.ca/fra/voir/objet/?id=6d372f75-cacf-40fb-b375-26ed71fea9a4Ser
National Research Conseil national IJ2ld
no. 1552 Institute for lnstitut de
c . 2
,
Research in recherche enBLDG I Construction construction
Heat Transfer in a Wet Porous
Thermal Insulation in a
Flat Roof
by C.P. Hedlin
Reprinted from
Journal of Thermal Insulation Volume 11, January 1988 p. 165
-
188(IRC Paper No. 1552)
NRCC 29215
NRC
-
C1SmL I B R A R Y
I
I R C
Des khantillons d'isolant de fibre de verre dont la teneur en eau variait e n m 0 et 15 % en volume ont t t t placts sur le toit d'une installation d'essai exterieure. Des mesures de 1'Ccoulernent thermique ont kt6 effectutes l'aide de thermofluxm~tres
A
toutes les saisons de l'annk. Les tempkratures extkrieures allaient d'environ -40 ?+35 'C. iLes
conducmm thermiques des isoIanu hornides angmentent considErablcment par tern1 chaud. a1ors que les variations de la ternptrature extt5rienre causent des inversioiquotidicnnts du gradient dc tem@nme des isolann. Ce phCnomhc est a m i b d anx cycl Cvapomtion-condensation, au cours desquels la vapeur d'eau effccme un va-et-vicnt da I'isolant, wnsportanr dc In chnlcur Intente. Dnns I'analysc, 1'Ccoultmtnt thennique a t
considtd comme constitut de deux elCmenn : la chdeur sensible et la chaleur Iatente. On a utilist les rksultats des rnesures pour dCfinir des relations faisant intervenir des coefficients de transfert et exprimant I'6coulement thermique en termes de temphtme et de pressions de vapeur d'eau.
Les moyenneq h c b t h - n t r t h h l - r n~lntirlipns d'm &chantilloil sec et d'6chantillons
ayant ur "es pour une penode
estivd h e pour tous les
Cchanf : Ctait environ trois
Heat Transfer in a Wet Porous Thermal
Insulation in a Flat Roof
C .
P.
HEDLIN Prairie Regional Station Institute for Reseavch in Constvurtion National Reseavrh Council cf Canada Saskatoon, Saskatcheu)an S 7 N OW9ABSTRACT
Glass fiber insulation specimens with moisture contents ranging from 0 to 15% by volume were placed o n the roof of an outdoor test facility. Heat flow measurements were rnade, using hcat flux transducers at all seasons of the year. Outdoor tcmpera- turcs ranged from about -40' to +35OC.
Thermal conductances for the wet insulations increase sharply in warm weather when swings in outdoor tcrnperature cause daily reversals in the temperature gradi- ent in the insulations. This is attributed to evaporation-condensation cycles in which water vapor is transferred back and forth in the insulation, carrying latent hcat. In the analysis, the hcat flux was regarded as comprising two components-a sensible heat componcnt and a latent hcat componcnt.
The results of the measurements were used to develop relationships, involving transfer cocfficicnts, to express the hcat flux in terms o f temperature and water vapor pressures.
Daily average hcat fluxes wcrc found for a sumrner period for a dry insulation spcci~ncn and specimens containing 1, 9 and 15'/0 moisture (volume). The differ- ence in heat flux was substantially the same for all o f the wct specimens. For each wet insulation, the heat flux was about three times as large as it was for the dry specimen.
KEY W O R D S
Thcrmal insulation, moisture, hcat flux, flat roof, tl~eriiial condt~ctancc, n~oisturc flux, transfer cocfficicnts.
INTRODUCTION
OISTURE IS PERVASIVE. In most instances it has a harmfill effect on M bulldings. In the case of thermal insulation, addition of moisture will reduce its effectiveness by an amount that varies with the quantity of mois- ture, the nature of the insulation and the temperature conditions [I-71.
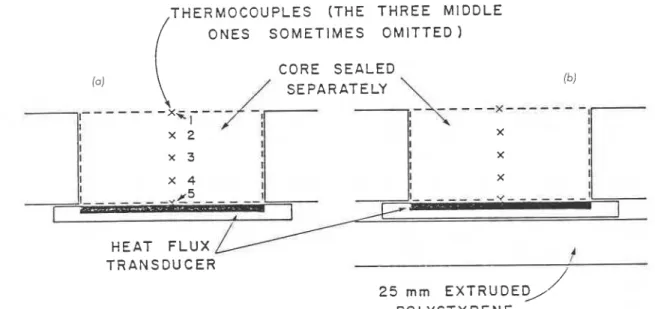
Studies on the roof of the Outdoor Test Building of the Institute for Research in ConstructionlNational Research Council in Saskatoon produced results of thermal performance for glass fiber insulation in which the mois- ture contents ranged from dry to 15% by volume. Heat flow rates were nlea- sured with heat flux transducers (HFTs) and temperatures were measured with thermocouples. The glass fiber specimens were 60 mm thick. The cx- perimental arrangement is shown in Figure 1. Measurements were made throughout the year thus providing data for all seasons.
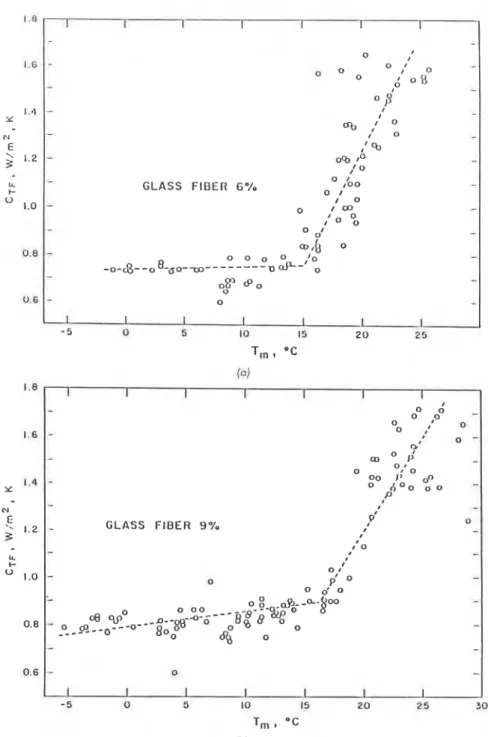
The results of earlier analyses [1,5] showed that n~oisture may be almost immobilized as frost during cold weather but in warmer weather the evapo- ration-condensation cycle causes a marked increase in the heat transfer rate. Evidence leadng to this conclusion is given by the fact that a sudden in- crease in thermal conductance coincides with the onset of reversals in tem- perature difference across the insulation. This is illustrated in Figure 2, re- produced from an carlier publication [5]. I t shows that conductance (C,,) increased when the mean temperature of the insulation exceeded lS°C. In- spection showed that this occurred when weather conditions were warn1 enough so that the temperatures at the top surface of the insulation exceeded those at the bottom surface for part of the day.
In the course of a year three different heat transfer phases were identified:
1. Type A prevailed during warm weathcr when reversals of tenlpcraturc difference across the insulation occurred on a daily basis. This produced latent heat flow due to vapor movement.
2. Type C heat flow occurred in a transition period in autun~n after reversals in temperature difference had ceased to occur. O n some occasions it con- tinued for about a month and may have bccn sustained by liquid flowing from the cold to the warm surfacc to offset the counter movcnicnt of moisture by vapor transfer. Occ~irrcnce of typc C hcat flux depended on moisture content and was not always evident in the present data.
3. Type B heat flux occurred in cold weather. The onset of typc U hcat flow occurred when the temperature in the upper region o f the insulation failed to exceed the freezing point. The initial part of typc I3 hcat flow as marked by a reduction in thermal conductance, over a period of several days, as moisture ~~iigratcd toward the cold surface to be deposited as frost in the upper part of the insulation.
T H E R M O C O U P L E S ( T H E T H R E E MIDDLE O N E S S O M E T I M E S O M I T T E D ) CORE S E A L E D
/
S E P A R A T E L Y\
H E A T F L U X A T R A N S D U C E R I / 25 mm EXTRUDED/ / P O L Y S T Y R E N EFIGURE 1. (a) Shows mounting of heat flux transducer, thermocouple loc.:ltions . I I I ~ thc L.OI.L. oitllc >p~.iin~i.n (11) I c i ~ . ~ ~ r ~ ; . ~ l except for 25 mm thick extruded polystyrene beneath the HFT.
0 I I O ; 0 - Q O O d " 8 0 ,Y' - - I I % , J O - 1 0 - - I1 QJ 0% to
-
- 0 1 I'0 G L A S S F I B E R 6 % 1 0 0-
0 / / 0-
0 I *-
,'o ", - O o1-
m , b 0 0 0 0 0 ,'o - -0-&--08-ao--- ---
u&- 0-
08' 8 0-
-
0 I Z I-
-
5 0 5 10 ~I 5 2 0 25 III TI", O CFIGURE 2. Thern~al conductance (C,,) vcrsus mean insulation tcnlpcraturc, T,. (a) Glass fiber with 6's moisture content; (b) glass fiber with 9'X) moisturc content. Roughly spcaking, Typc B heat flux occurs for T,,, less than lS°C and Typc A for T,,, greater than lS°C.
Heat >anger in a Wet Porous Thevmal Insulatiorz in a Flat Roof 169 The following report comprises three main parts:
1. Representations of heat flow data in terms of sensible and latent compo- nents using transfer functions to represent each mode separately. 2. Calculation of sensible and latent heat conductances- the latter is analo-
gous to sensible conductance but uses vapor pressure differences in place of temperature differences to represent latent heat transfer.
3. Calculation of heat flux:
a) Instantaneous flux calculated with transfer functions
b) Daily average inward and outward heat flows calculated using data in the period between spring and autumn, to show the effect of moisture on heat gains and losses in warm weather
c) Daily average heat flux for insulations ranging in moisture from dry to 9% mc, in cold weather data when the moisture is probably pres- ent as frost
The analyses are empirical in nature. A simple model for latent heat trans- fer is used and best-fit relationships based on it are used with it to describe the results.
SENSIBLE A N D LATENT HEAT TRANSFER
General Description of the Two Components of Heat Flux SENSIBLE HEAT FLUX
Steady state conductionof sensible heat can be expressed approximately as
Q. = A A T
+
BATT, (1)where
AT = temperature difference = TB - T T T, = mean temperature = (TB
+
T T ) / 2TB and T T are the temperatures at the bottom and top locations in the in- sulation (usually the upper and lower surfaces but not always).
LATENT HEAT FLUX
where
D = vapor diffusion constant kgls, m, Pa
Ah = difference in enthalpy between vapor at temperature T1 and liquid at temperature T2, kJlkg
kJ, kg, Pa, s are respectively lulojoule, kilogram, pascal (vapor pressure) and second (time).
The vapor permeability for still air is given as: 175 x lo-" (i.e., 120 perm-in)
s,m,Pa
The enthalpy change (Ah) from the vapor state at T , to the liquid state at T , varies with the temperatures. In these measurements the enthalpy change ranges from about 2400 to 2500 kJlkg. Taking an average of these extremes, i.e., 2450 kJIkg the rate of heat transfer due to moisture diffusion would be:
For a gap 60 m m wide ( the thickness of the glass fiber insulation used here), the vapor or latent heat conductance would be:
Steady state latent heat transfer might be expressed as
where AP = vapor pressure difference across the specimen kPa. A simple model which assumes evaporation at the warmer surface and condensation at the colder one is used in the following analysis. However, it only approx- imates the situation since condensation at intermediate locations between the surfaces will occur due to the non-linearity in the temperature-vapor pres- sure relationship and due to temperature fluctuations that occur in the prac- tical case. Further, one investigator [7] concludes that the rate of moisturc
Htwt Tunii$c~r in n Wet Povous Thermal Insulation in a Flat Roof 171 movement n is dependent also o n AT, i t . , n = K,AT
+
K,AP. Hence the assumption that Q , depends solely on AP is only an approximation.Approximately [Reference 8, Equations (3),(4)], the saturation vapor pres- sure at absolute temperature, T* = T
+
273.15OK, over liquid water is:where
and over ice:
where
Distinction Between Latent and Sensible Heat Flux Components The distinction between the two modes will be blurred. For example, sen- sible heat transfer may include a convective component whlch would di- rectly influence the movement of vapor. Efforts to estimate the contribution of moisture to heat transfer are further complicated by the fact that the reser- voir of moisture is limited. The lower regions dry out in winter; in summer, the upper part may become dry after a period of hot sunshine falling on the roof. Nevertheless, it is likely that conditions approximating that of the model do prevail, if only temporarily.
The following analyses are carried out assuming that the total heat flux
(Q) is the sum of sensible and latent heat components
Using transfer functions (9) the rate of sensible (Q, = Qo) heat flow can be expressed:
The subscripts 0,l--n, refer to values at the time 0 and values 1,2--n time steps earlier, e.g., 1 and 2 hours earlier.
Q, T T and TB represent heat flow rate (W/m2) and top and bottom surface temperatures ( O C ) respectively.
The subscripted values of I , j and K are the transfer coefficients. KO is taken to equal unity.
CALCULATON OF CONDUCTANCES
-
SENSIBLE A N D LATENTSensible Heat Conductances
Transfer coefficients can be used to estimate the thermal conductances. For sensible heat transfer:
Latent Heat Conductances 4
Equation (9) was modified to express latent heat flux (Q, = Q,):
where No = 1.
Equation (10) was changed to produce Equation (12). It was used to calcu- late latent heat conductance (C,) using coefficients from Equation (11).
Heat Transfer in a Wet Porotrs Thernzal Insulation in a Flat Roof 173
Equation (8) requires that sensible heat flux (Q,) be defined. Given the continual change in moisture distribution and periodic change of phase it is improbable that any simple single definition of Q, will be correct in all situa- tions. In cold weather the moisture was frozen and heat flow could, with reasonable accuracy, be assumed to take place as sensible heat. An expression for Q, could be obtained under those conditions, however, it was not deemed to be valid in warm weather. Two approaches are considered here: In the first it is assumed that sensible heat flow does not vary with the moisture content of the insulation.
In the second, it is assumed that sensible heat flow is affected by moisture content.
A S S U M P T I O N 1:
S E N S I B L E H E A T FLOW IS U N C H A N G E D B Y T H E M O I S T U R E One of many possible options for defining Q, was applied to the analysis of the warm weather data; it was assumed that Q, is equal to heat flux for dry insulation. This is obviously an approximation but appeared to work rea- sonably well in the empirical expressions that resulted.
If the heat flux for dry insulation is subtracted from total heat flux the result [Q, in Equation (8)] should be approximately equal to the increase caused by moisture. The resulting comparison of performance for a wet and a dry roof is not exact, however, since temperature conditions at the surfaces of the insulation would be different even though the ambient conditions (apart from moisture content) were the same.
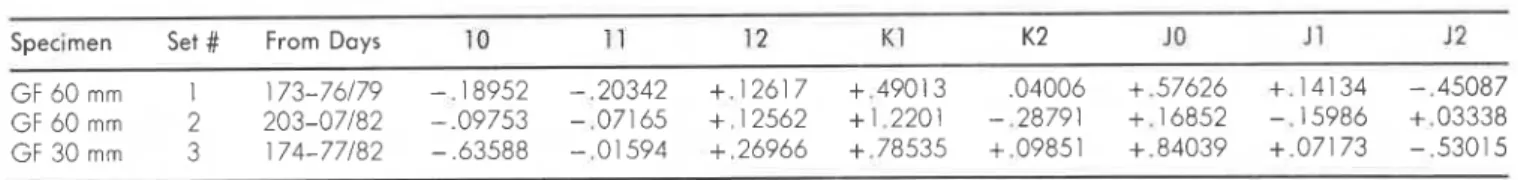
Using hourly data covering one or more days transfer coefficients for dry insulation were found. Three sets of coefficients are given in Table 1. The
first is based on 96 1-hour datasets of TT, T B and Q and the second is based
on 120 such datasets. The third was based on temperatures within the in-
sulation, i.e., at points 2 and 4 in Figure l(a). These were used in a subse- quent analysis.
In calculations of coefficients in Table 1, i.e., involving sensible heat trans-
fer [Equation (9)] the data were linearized using the relationship T* = T
+
.0016T2. T * was then used in the analyses. However, in calculations of
coefficients in Table 2, i.e., involving latent heat transfer, lack of adequate in- formation prevented linearization treatment for Equation ( l l ) , though varia-
Table I. Sensible heat transfer coefficients for dry gloss fiber specimens, calculated using 24 dotasetslday from the days indicated in Col. 3. These transfer coefficients are used to calculate values of Q,.
Specimen Set # From Days 1 Q 11 12 K 1 K2 JO J 1 12
GF 60 mm 1 1 73-76/79 - .I 8952 - .20342
+
.I 261 7+
-490 1 3 ,04006+
,57626+
.14 1 34 - ,45087GF 60 mm 2 203-07182 -.09753 - ,071 65
+
,12562+
1.2201 - ,28791+
,16852 -. 15986+
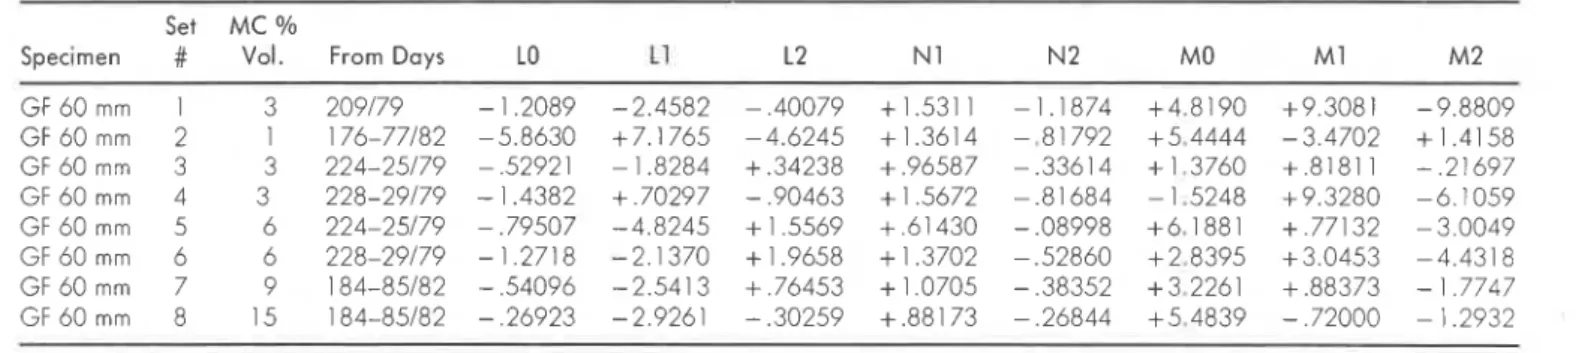
,03338Table 2. Latent heat transfer coefficients for wet glass fiber specimens, calculated using 24 datasetslday from the days indicated in Col. 4. These coefficients are used to calculate Q,. Set # I Table 1 was used to calculate these coefficients.
Set MC Oh
Heat Tvans&r in a Wet Porous Thermal Insulation in a Flat Roof 177 tions in latent and sensible heat contents and variations in vapor diffusion characteristics, with temperature, suggest the need for it.
Figure 3(a) shows the heat flux, temperature difference and vapor pressure difference for a day in summer. The vapor pressure was estimated using Equation (4) or (6). These temperature data were used with the first set of coefficients in Table 1 to estimate Q,. Also, the difference
was calculated. The three values Q, Q, and Q, are plotted in Figure 3(b). This plot demonstrates the large effect of moisture on heat flow in this case. The maximum rate of negative sensible heat flux is estimated to be about 5 Wlm2 at 1400 hours. The maximum total heat flux is nearly 20 Wl mZ. The difference, about 15 W/m2, apparently occurs due to the effect of moisture.
Using Equation (11) with saturation vapor pressures for the above data, coefficients for Q, in Figure 3(b) were found. They are given (set 1) in Table 2. Other sets of transfer coefficients were found using temperature and heat
0 a ! I I I I I 1: 0
..
10-
8 0-
(U EC
02
\ 8 0 0 Oo0 0000 3 0 . ,_?s,----a-,j-%% m m - 8 - a I o O 000008 lb,-
> 0 ; Oo O 0 U 0 ID 0 O , ' 0 W 0 0 0 l U 0 O 0 : 0 0 ;, o m-
0 I I 0,%0 U I 0 1 ";0 d 3 1 n 0 I ad. 8-
I I oj-
1 I I I I I 0 50 100 150 200 250 300 350 DAY OF YEARFIGURE 4a. Plots of vapor conductance (C,) for a specimen of glass fiber with 6 % ~noisturc content and 60 mm thick through a sumnlcr period. Thc dotted line follows through the bulk of the data points, as suggcstcd by visual inspections.
I I
-
* T---Q-'.'D. .o.-
-
-
-
-
-
-
a 60 m m T H I C K N E S St
o 3 0 m m T H I C K N E S S-
-
-
I I 1 . 0 0 I00 230 210 220 DAY OF Y E A RFIGURE 4b. I'lots of C, for glass fiber containing 3'%) Inolsturc content by volunlc based on
the full 60 mm thickness (left ordinate) and on the nliddlc 30 mrn (right ordinate).
flux data for glass fiber specimens having 1%, 3 % , 6%, 9 % and 15% mois- ture content (vol.). All were 60 m m thick. In each of the last 5 cases, 48 1- hour datasets were used.
Using the first set of data in Table 2 in Equation (12)
This should be regarded as an apparent rather than a real value.
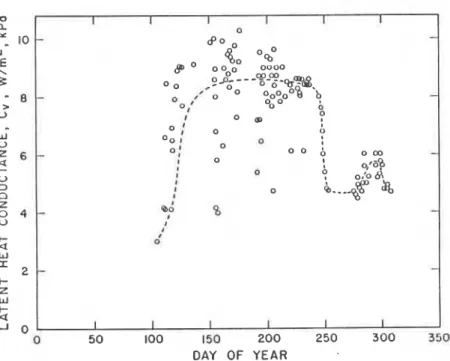
This was repeated using data obtained throughout the spring, summer and into the fall for the 6% mc specimen. The resulting vapor conductances are plotted against the time of year [Figure 4(a)]. The value of C, rose to about
9 W/mz,kPa in the summer; as the weather cooled in the fall it fell sharply to about 5 W/m2,kPa, then rose briefly before falling again. The plot terminates at day 310. At about that time the moisture was apparently deposited as
Heat Transfer in a Wet Porous Thertnal Insulation in a Flat Roof 179 frost. At the low temperatures the driving vapor pressure difference is small and the transfer of heat in the latent form almost ceases, though sublimation and condensation probably continue.
The data show a large amount of scatter. Even in the summer when rever- sals of temperature difference occur C, varies from about 4 to 10 Wlm2,kPa reflecting changes in the vapor flux characteristics.
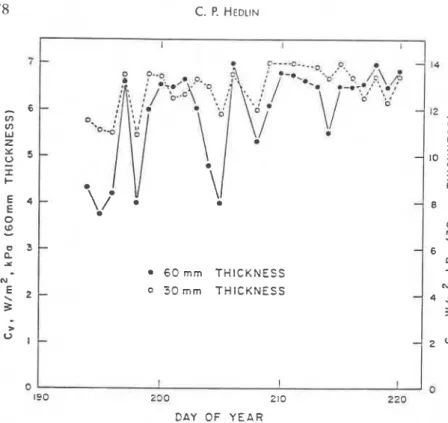
In some of the insulation specimens thermocouples were located at the quarter points [Figure l(a)]. Using temperature data for points 2 and 4, and
set 3 of the coefficients in Table 1, C, values for the middle 30 m m of the in-
sulation were calculated for the 3 Oh mc specimen for a 30 day period in sum-
mer. These values are shown in Figure 4(b) along with C , values for the full (60 mm) thickness. As expected, C, for the center section is about twice as
large as C , for the full thickness. Two ordinate scales are used in Figure 4(b)
to allow comparison of the two sets of data. The scatter for the center section
is relatively small; C , for it ranges from about 11 to 14 Wlm2,kPa for a ratio
of 1:1.27. For the full thickness, C , ranges from about 3.7 to 7.0 W/m2,kPa
MOISTURE CONTENT, '10 VOLUME
FIGURE 5. Latent hcdt conductnncc, calculated uslng Equation (12) for glass fibcr s p c c i ~ n c ~ i s
for a ratio of 1:1.9. This may suggest that the moisture supply was usually adequate in the middle section. Apart from the low values experienced by the full thickness, the C, values, when converted to a common thickness base, agreed within about 5%. This corresponded to about 6.7 and 13.5 Wlm2,kPA for the 60 and 30 m m thicknesses, respectively.
Average values of C,, were calculated for specimens having different mois- ture contents. Each average covered about 30 days. The results are plotted against moisture content in Figure 5. It shows an increase in C, of about 50% as the moisture content changed from 1 to 15%.
ASSUMPTION 2:
SENSIBLE HEAT FLOW VARIES W I T H MOISTURE C O N T E N T
If it is assumed that the vapor flux cannot exceed 7.1 Wlm2,kPa (the value for an air space 60 mm wide) then the fact that values here exceed it would be attributed to the inadequacy of the model. For one thing it assumes that the sensible heat transfer is the same as for dry insulation; in fact, it should be higher than that. Thus part of the heat flux attributed to latent heat trans- fer is really due to sensible heat transfer. This leads to a second approach for the estimation of sensible and latent heat components.
O n e would expect that the presence of moisture would increase the sensi- ble heat flux by reducing the thermal resistance of the insulation. At the very least, if it was deposited as a layer of liquid at one of the surfaces, it would effectively nullify the thermal resistance of the insulation there: e.g., 1%) of moisture would cause a loss of about 1% of the thermal resistance. At the other extreme, if one supposes that the moisture formed a bridge from one surface of the insulation to the other, the effect would be much greater. Since water has a thermal conductivity about 16 times as great as that of the in- sulation, the thermal conductance would be increased by about 15'/0 for a
1% increase in moisture content. Probably the effect on sensible heat flow lies somewhere between these two extremes.
Actual contributions of sensible and latent heat flows were estimated us- ing two assumptions:
a) Sensible heat flux increases in proportion to the moisture content. b) Latent heat flux is independent of the moisture content.
The sensible heat component (Q,) used in the equation
was increased, thus reducing the latent heat flux and the resulting value of
C,. This was done for specimens having 1, 3, 6 and 9% nlc. The data were selected to include days on which the values of C, were near to the top for
Heat Tvansfev in a Wet POYOUS Thermal insulation in a Flat Roof 18 1
% INCREASE IN Qs / % MOISTURE CONTENT
FIGURE 6. Plots of latent hcat conductancc C, for no increase in the estimated sensible heat
component Q, and for an increase of 10'k,/'% mc in Q,. The dotted lines represent interpolations between these extremcs.
each specimen. It was assumed that these would correspond to a relatively snlall moisture depletion effect.
C, values were calculated using a sensible heat increase of 10%I0/o mc, i.e., sensible heat flux calculated using Equation (9) was multiplied by 1.1, 1.3, 1.6 and 1.9 for the 1, 3, 6 and 9 % mc specimens, respectively, before subtrac- ting it from the total flux, when calculating latent heat flux. In Figure 6 the two sets of C, arc plotted. Interpolation suggested the resulting lines are most closely grouped for a sensible hcat flow increase of about 7-9%,1'%, nlc. Based on this analysis an effective value C, of about 6 Wlm2,kPa would ap- pear to come closest to satisfying all of the data. Using this result, a vapor flux could be calculated. It would be about 150 x 10-l2 kg/Pa,m,s (corn- pared to 175 x 10-l2 kg/Pa,m,s for still air).
Techniques for measurement of permeance of materials to water vapor are well established. They are regularly employed to find measures of their
probable performance where resistance to vapor movement is important. Standard techniques often employ wet- or dry-cup methods where conden- sation does not occur. In moist insulations, liquid water is present and the process of moisture movement is somewhat hfferent.
PREDICTION OF HEAT FLUX
Instantaneous
The transfer coefficients can be used to predict heat flux. The predictions are based on the assumption that the sensible heat flow is simply that which would occur if the insulation was dry.
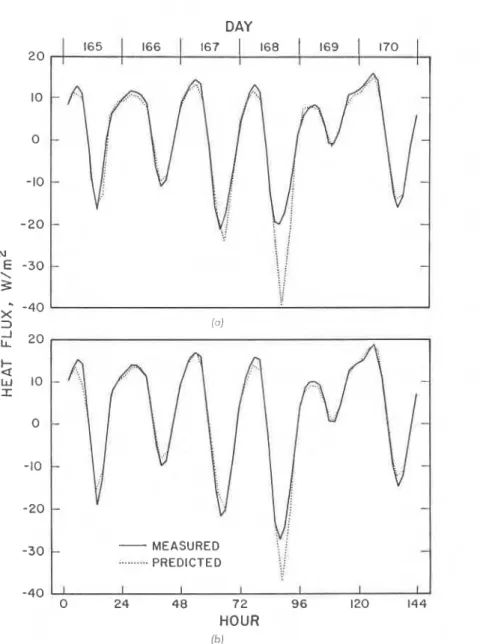
Figure 7(a) and (b) shows calculated and measured heat fluxes for the spec-
imens with 3 and 6 % moisture contents respectively. Both graphs are for the
same 6-day period (days 165-7011980).
A computer program was used with coefficients (set 1) in Table 1 to esti- mate sensible heat flux. Latent heat flux was determined by calculating vapor pressure differences using the same temperature data with coefficient
sets 3 and 6 from Table 2. The sensible and latent heat fluxes are combined
to give total heat flux.
In Figure 7 the maxima and minima measured and predicted values agree
within about 20% except for day 168 when the relationship overpredicted
the negative flux by about 80% for the 3"/1 mc specimen and 30% for the
6 % specimen. It was a hot day and the drying effect may have caused mois- ture depletion at the upper surfaces, as previously discussed. The difference
is greater for the 3 than the 6'/0 specimen, perhaps because of the larger res-
ervoir of moisture in the latter. Alternatively, the prediction method may be in error, perhaps because the temperature conditions on which the coeffi- cients were based were less extreme than those for which the estimates were made. The arithmetic and absolute heat flux differences between measured
and predicted values were 1.0 and 1.8 Wlmz for the 3 % and 0.1 and 1.2 W/m2
for the 6Oh specimen respectively.
Daily Average Heat Fluxes-Warm Weather
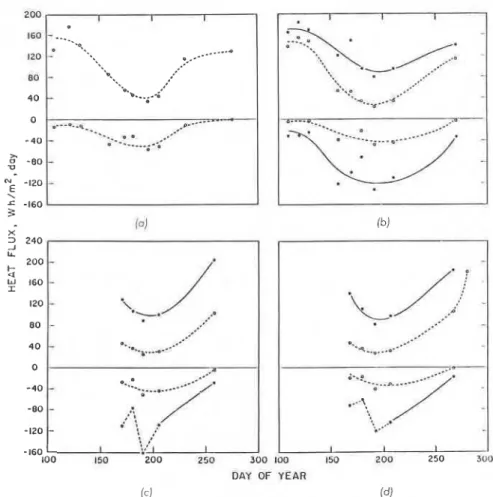
Daily average latent and sensible heat fluxes for 1, 9 and 15% moisture
content specimens were calculated using data for different times of the year. Also, measurements were made on dry specimens. The heat fluxes wcrc divided into positive (outflow) and negative (inflow) components. Average
values were found for periods ranging from about 5 days to 2 weeks. Values
for the dry insulation are plotted in Figure $(a) and for the 1, 9 and 15%)
specimens in Figure 8(b), (c), and (d). These plots cover the period between later April and the end of Septenlber for the dry and 1%) specimens, whilc
DAY
-40
0 24 48 7 2 96 120 144
HOUR (4
FIGURE 7. Measured heat flux (solid linc) and pred~cted hcat flux (dottcd linc). (a) 1)rltrl fro111 165-70180 for the 3°C) nlc glass fiber specimen 60 nlm thick. Prcd~ction based o n transfer cocffi- cicnts calculated from data for days 224-25179 for thc same specirncn. (b) Measured hcat flux
(solid line) and predicted hcat flux (dottcd linc). Data from 165-70180 for the 6 % mc glass fiber specimen 60 nlm thick Transfer coefficients were calculated using data for days 228-20179 for the same specimen.
DAY OF Y E A R
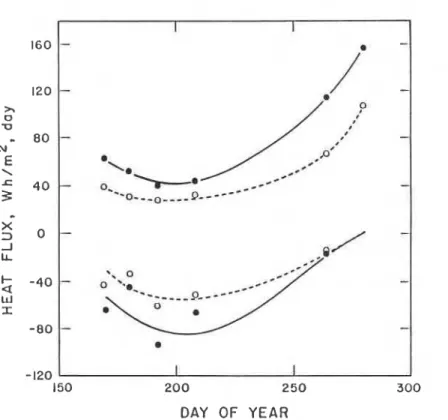
FIGURE 8. Daily average positive (outward) and negative (inward) heat fluxes for dry, l'%, 9% and 15% rnc specimens. Each dot represents an average for a period ranging from 5 days to about 2 weeks. Dashed lines represent sensible hcat flow. Solid lincs represent total hcat flow though a dashed line joins total heat flow points where the scatter is large.
Heat Tvansfev in a Wet Pomns Thevr~zal Insulatior~ it1 a Flat Roof 185 The data show large increases in negative flux in the summer season. The smooth curve indicates that the estimated sensible heat component for the wet specimens reached about 40 Wh/m2, day. The value for the dry speci- men, measured at the same time, was a little larger-about 50 Whlm2, day. In one hot 5-day period, i t . , days 190-94 (early August) the rate of heat inflow reached 160 Wh/mz, day (see the individual point) for the 9% speci- men. The maximum 1-day value for that specimen (day 191-not shown) was 190 Whlm2. In the same 5-day period the maximum negative fluxes for the dry, 1 and 15"/" specimens were 70, 160 and 165 Wh/m2, day respec- tively..
The heat fluxes did not change significantiy with increased moisture con- tent. This is not necessarily inconsistent with the increase in apparent latent heat conductance that accompanies increased moisture content (Figure 5) since the temperature differences decrease somewhat with increased mois- ture content.
DAY OF Y E A R
FIGURE 9. Daily average positive and negative heat fluxes for 9'/0 mc glass fiber located over 25 mm thick extruded polystyrene. Solid lines represent total heat flow; dashed lines represent sensible heat flow.
The total negative fluxes for wet insulation are about 2-3 ti111cs .IS I.lrjiC .IS the sensible heat flux components estimated for the \vet spccimcns and the measured heat fluxes for the dry specimen. Positive heat fluxes exceeded estimated or measured sensible heat fluxes by about 3 times in sumnler. A laboratory study [3] found a ratio between the vapor and sensible heat components to be about 1:2.5. In that case the ratio of the total sensible heat flux would be about 1:3.5. A field study [6] on wet roofs showed a ratio of about 3.
In addition to the above measurements, a 9% specimen was located over dry extruded polystyrene insulation 25 m m thick. The heat fluxes are shown in Figure 9. The total negative heat flux reached about 90 Whlm2, day. The presence of the dry insulation along the path of heat flow reduced the heat flow and the overall effect of moisture o n the thermal performance of the roof panel.
Daily Average Heat Fluxes-Cold Weather
The preceding discussion has been devoted principally to heat flow in summertime. In cold weather the moisture may accumulate as frost in the upper region of the insulation [5]. Movement of heat due to vapor flux is very much reduced; however, the frost provides highly conductive paths and the thermal conductance is substantially higher than for dry insulation. Heat flux can be expressed:
Q, = AAT
+
BATT,AT, T , are temperature difference and mean insulation temperature, re-
spectively. A and B can be found using least squares analysis, with data for which T ,
<
15OC.The thermal conductance can be expressed:
Table 3 contains these values for 60 m m thick insulation having 0, 1, 3, 6, and 9 % moisture contents.
SUMMARY A N D CONCLUSIONS
1. Moisture in thermal insulation has an important effect on heat flow. In summer the transport of heat includes an evaporation-condensation process which transfers latent heat from warn1 to colder regions of the insulation along with the tranfer of sensible heat.
Heat Tvansjr in a Wet Porous Thermal Insulation in a Flat Roof 187 Table 3. Constants for C, = A
+
BT, for 60 mm thick glass fiber with 0 to9% mc for T, 15OC. A and B have units Wlm2, K and Wlm2 respectively.
mc%, Vol. A Units B Units
2. Heat flux measurements were made on glass fiber insulations 60 m m thick having moisture contents ranging from dry to 15% by volume. The specimens were encapsulated in polyethylene and mounted on the roof of an outdoor test facility. Measurements were made at all seasons of the year.
3. The rate of heat transfer was represented as the sum of sensible and la- tent components.
4. Each of these components can be expressed in terms of transfer func- tions. In the present case sensible heat fluxes (Q,) were assumed to be the same as for dry insulation. Q, was subtracted from the total flux Q to find the latent flux (Q,). Using Q, and saturation vapor pressures corresponding to the temperatures at the upper and lower surfaces of the insulation "vapor transfer coefficients" were found. Using these coefficients "apparent vapor conductances" having the units W/m2,kPa were calculated.
5. Latent heat conductances calculated in this way varied somewhat with moisture content of the specimen. Values for 1% moisture content speci- mens reached about 6.5 W/m2,kPa while those for a 9 % moisture content specimen reached about 9.5 W/m2,kPa, for glass fiber 60 m m thick. The lat- ter exceeds the value of 7.1 W/m2,kPa estimated for still air. It seems improb- able that the rate of vapor movement in the glass fiber, which produces this heat flow, would exceed that in still air. Presumably the sensible heat com- ponent exceeds that for dry insulation, hence part of the heat flow attributed to vapor movement in this model is, in fact, due to sensible heat flow.
6. By assuming that the scnsible heat flux increased in proportion to the moisture content and that latent heat flux was independent of it, an estimate of the actual contributions of scnsible and latent heat flux was made. Based on these assumptions, it appeared that sensible heat flux increased by about
7-9'X,I% mc. and that the latent heat flux was about 6 W/m2,kPa for the 60 mm thick glass fiber. The latter translates to a vapor flux of 150 x 10-l2 kg/s,nl,kPa.
7. Net movement of moisture in one direction due to prolonged or large temperature differences appears to cause local depletion of nloisture and a reduction of the rate of heat transfer. This occurs in early winter when mois-
ture accumulates as frost in the upper part of the insulation and can occur in summer when hot upper surface tcnlperatures drivc moisture downward in the insulation.
8. The results showed that glass fiber specimens containing 1, 9 and 15%
moisture by volume produce daily average heat gains and losses about three times as great as dry insulation. The ratio did not appear to vary significantly with increased moisture content.
REFERENCES
1. Hedlin, C . P. "Effect of Moisture on Thermal Resistances of Some Insulations in a Flat Roof System Under Field-Type Conditions," ASTM STP 789, Thermal In- sulation Materials and Systems for Energy Conscrvation in the SO'S, pp. 602-25 (Jan., 1983).
2. Bomberg, M . and C. Shirtliffc. "Influciicc of Moisture and Moisturc Gradients o n Heat Transfer Through Porous Building Materials:' ASTM STP 660, Thcrrnal Transmission Mcasuremcnts of Insulation, pp. 21 1-133 ( N R C C 17138) (1978). 3. Langlais, C. ct al. "Influence o f Moisturc on Hcat Transfcr Through Fibrous In- sulating Matcrials," ASTM STP 789, Thermal Insulation Matcrials and Systcnis for Energy Conscrvation in the 80's. pp. 563-81 (1983).
4. Thomas, W. C . ct al. "Hcat and Moisturc Transfer in Glass Fiber Roof-insulating Material," ihid., pp. 582-601.
5. Hedlin, C. P. "Seasonal Variations in Modes of Hcat Transfcr in a Moist Porous Thermal Insulation in a Flat Roof," Jorrr.rrrl1 '!f Tlr~~r111~11 111~11l1itior1, 11(1):54-66 (1987).
6. Shuman, E. C. "Field Measurement o f Hcat Flux Through A Roof with Saturated Thermal Insulation and Covered with Black and White Granules," ASTM STP 718, pp. 519-39 (Dec., 1980).
7. Kumaran, M . K. "Moisture Transport Through Glass-Fibre Insulation in the Presence of a Thermal Gradient," Jorrrrtd c!f'Tlrc~vrrrol lrrsrrloriorr, 10:243-255 (April, 1987).
8. ASHRAE Horrdhoc~k of' F~~~~diir~~cutiilz. Chap. h (1985).
9. Hedlin, C . P. "Calculation of Tli'r~nal Conductance 13asc.d on Mcasurcmcnts of Hcat Flow Rates in Flat Roofing Using Hcat Flux Tr.uisd~iccrs:' ASTM STP 885, Building Applications of Hcat Flux Transducers, pp. 184-201 (I)cc., 1085).
T h i s p a p e r i s b e i n g d i s t r i b u t e d i n r e p r i n t form by t h e I n s t i t u t e f o r R e s e a r c h i n C o n s t r u c t i o n . A l i s t of b u i l d i n g p r a c t i c e and r e s e a r c h p u b l i c a t i o n s a v a i l a b l e from t h e I n s t i t u t e may be o b t a i n e d by w r i t i n g t o t h e P u b l i c a t i o n s S e c t i o n , I n s t i t u t e f o r R e s e a r c h i n C o n s t r u c t i o n , N a t i o n a l R e s e a r c h C o u n c i l of C a n a d a , O t t a w a , O n t a r i o , K I A OR6. Ce document e s t d i s t r i b u d s o u s forme d e t i r 6 - 3 - p a r t p a r l l l n s t i t u t de r e c h e r c h e e n c o n s t r u c t i o n . O n p e u t o b t e n i r une l i s t e d e s p u b l i c a t i o n s de l l l n s t i t u t p o r t a n t s u r l e s t e c h n i q u e s ou l e s r e c h e r c h e s e n matisre d e b t t i m e n t en d c r i v a n t l a S e c t i o n d e s p u b l i c a t i o n s , I n s t i t u t de r e c h e r c h e e n c o n s t r u c t i o n , C o n s e i l n a t i o n a l d e r e c h e r c h e s du Canada, Ottawa ( O n t a r i o ) , KLA