Coherent control of neutron interferometry
Texte intégral
Figure

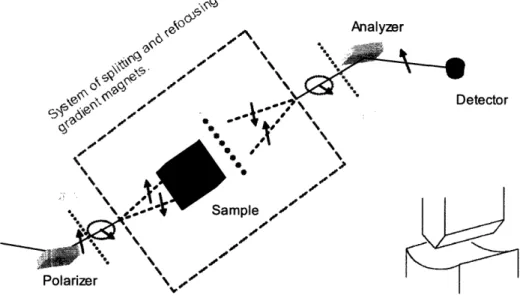
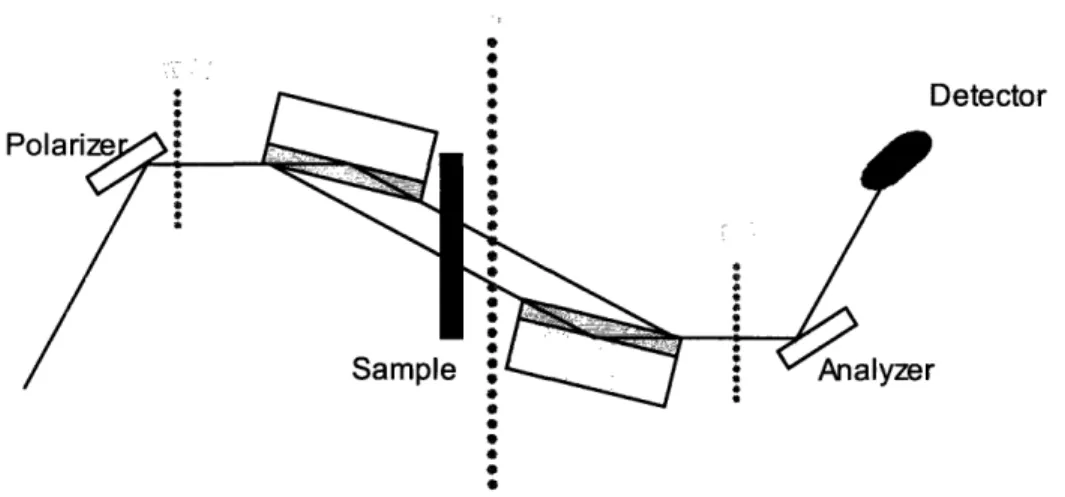
![Figure 1-2: Sketch of the Larmor and Ramsey type of neutron interferometer (spin- (spin-echo interferometer [7]).](https://thumb-eu.123doks.com/thumbv2/123doknet/14359357.502325/25.918.135.786.104.324/figure-sketch-larmor-ramsey-type-neutron-interferometer-interferometer.webp)

Documents relatifs
However, the findings they report do not unambiguously lead us to this solution. An
Computer modelling of the growth of obliquely deposited films sug- gest that they contain voids enclosed in the bulk of the material as well as having a columnar microstructure /2/.
The existence of dynamically correlated regions of intermediate range of ordering was verified for ZnCIZ solutions in D20 by means of small angle neutron scattering.. The data
contribution of the spin misalignment to the total magnetic SANS cross section via the study of the individual magnetization Fourier components; it provides important
In particular, for measurements at zero and high, saturating field strength, which are most commonly performed, it is for simplicity assumed that the magnetic moments of the
In particular, for the most common scattering geometry where the applied magnetic (guide) field is perpendicular to the incident neutron beam, we write down the equations for
2014 An intensity peak in small angle neutron scattering in a polyelectrolyte solution is found above a characteristic concentration c0 of the polyelectrolyte.. This is
There is a popular saying that if there were no mosquitoes, there would be no malaria. This is true. Mosquitoes are blood feeders. If they happen to bite an individual having
