HAL Id: inserm-01144522
https://www.hal.inserm.fr/inserm-01144522
Submitted on 21 Apr 2015
HAL is a multi-disciplinary open access
archive for the deposit and dissemination of
sci-entific research documents, whether they are
pub-lished or not. The documents may come from
teaching and research institutions in France or
abroad, or from public or private research centers.
L’archive ouverte pluridisciplinaire HAL, est
destinée au dépôt et à la diffusion de documents
scientifiques de niveau recherche, publiés ou non,
émanant des établissements d’enseignement et de
recherche français ou étrangers, des laboratoires
publics ou privés.
Distributed under a Creative Commons Attribution| 4.0 International License
Local classification of microvascular function based on
contrast-enhanced ultrasound data: a feasibility study
Maxime Doury, Alexandre Dizeux, Guillaume Barrois, Delphine Le
Guillou-Buffello, Alain Coron, Lori Bridal, Alain de Cesare, Frédérique Frouin
To cite this version:
Maxime Doury, Alexandre Dizeux, Guillaume Barrois, Delphine Le Guillou-Buffello, Alain Coron,
et al.. Local classification of microvascular function based on contrast-enhanced ultrasound data: a
feasibility study. Journées RITS 2015, Mar 2015, Dourdan, France. p162-163. �inserm-01144522�
Actes des Journées Recherche en Imagerie et Technologies pour la Santé - RITS 2015 162
Local classification of microvascular function based on contrast-enhanced
ultrasound data: a feasibility study
M. Doury
1∗, A. Dizeux
1, G. Barrois
1, D. Le Guillou-Buffello
1,
A. Coron
1, L. Bridal
1, A. De Cesare
1, F. Frouin
1,21 Sorbonne Universit´es, UPMC Univ Paris 06, Inserm, CNRS, Laboratoire d’Imagerie Biom´edicale, Paris, France. 2 Inserm, CEA, Universit´e Paris Sud, CNRS, Laboratoire IMIV, CEA-I2BM-SHFJ, Orsay, France.
∗ Corresponding author, [email protected]
Abstract - Dynamic contrast-enhanced ultrasound can detect microvascular flow changes during tumor develop-ment and antiangiogenic therapy. However, the stand-ard method for microvascular flow estimation in tumors is global and can lead to bias in flow estimations in heterogeneous tumors. A new method to segment tu-mors according to their vascularization was investigated. In addition, parameter normalization with respect to a highly vascularized region of reference was proposed to overcome inter-exam variability in parameters. Results demonstrate the potential to locally classify tumoral tis-sue using parameters that describes the arrival of an ul-trasound contrast agent in the tumor.
Index Terms - Image Processing, Ultrasound, Contrast, Microvascularization, Tumor.
I. INTRODUCTION
Ultrasound (US) is a real-time, non-invasive, and cost-effective imaging modality, making it a key tool for cancer diagnosis, and treatment monitoring. In particular, it gives access to structural information, using B-Mode, as well as functional information, using dynamic contrast-enhanced US (DCE-US).
DCE-US techniques have demonstrated their potential for early detection of microvascular flow changes during
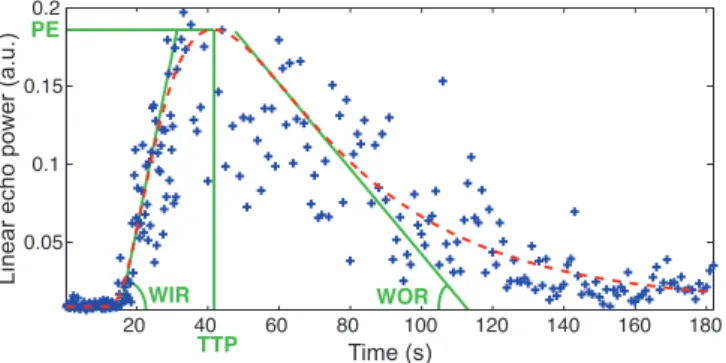
tu-Time (s) L in e a r e ch o p o w e r (a .u .) PE TTP WIR WOR 20 40 60 80 100 120 140 160 180 0.05 0.1 0.15 0.2
Figure 1: Example of median-filtered echo-power data (blue crosses), the fitted lognormal model (dashed red line), and some of the associated perfusion parameters (i.e. TTP, PE, WIR, WOR).
mor development and antiangiogenic therapy. The current standard technique to evaluate microvascular flow in tu-mors consists of delineating the entire tumor to estimate the global flow throughout the cross-sectional area of the tumor in the imaging plane. This method masks important information on the spatial distribution of the microvascular flow throughout the tumor and can lead to underestimation of tumor “viability”, e.g. in the case of a highly vascular-ized corona surrounding a necrotic core.
A new method is investigated to more reliably segment DCE-US data into regions with high concentrations of mi-crovessels and/or strong flow rates from more functional-ized regions. In this work we also demonstrate that inter-exam physiological variability in a mouse can influence measurements, and propose a normalization technique to provide more robust comparisons of the tumor vasculariz-ation during its development.
II. MATERIALS AND METHODS
Data analysis was performed on 17 B-Mode and DCE-US sequences acquired using a 15L8W transducer and a Se-quoia 512 US system (Acuson, Siemens, Mountain View, USA) in an ectopic murine model for Lewis Lung Car-cinoma [1]. Contrast imaging was performed after con-trolled injection of a 50 µL bolus of SonoVue (Bracco Suisse SA, Geneva, Switzerland) contrast agent. Imaging was repeated at regular time points at the level of the largest cross-section of each tumor to follow development from days 3 to 15 after tumor implantation. DCE-US imaging was performed with fixed mechanical index (0.1), dynamic range (80 dB), and TGC settings. Motion was negligible for the selected sequences.
A spatially median-filtered echo-power vs. time curve was obtained for each 3 × 3 analysis block, i.e. 324 × 324 µm, in each 2D + t data sequence. A lognormal parametric flow model was fitted to the resulting curve using a mul-tiplicative noise model [2]. Conventional perfusion para-meters were then derived yielding six perfusion parametric maps: time to peak (TTP), mean transit time (MTT), area under the curve (AUC), peak enhancement (PE), wash-in rate (WIR), and wash-out rate (WOR). Selected perfusion parameters can be visualized in Fig. 1 and 2.
Regions of analysis were manually selected on the B-Mode
163 Actes des Journées Recherche en Imagerie et Technologies pour la Santé - RITS 2015
image: 1) to outline the tumor and 2) to select a highly vas-cularized tissue outside the region of the tumor. Analysis blocks in parameter maps were classified into three classes, using a standard, unsupervised algorithm: K-Means clus-tering [3] using L1distance.
Classification was performed twice for each longitudinal set of parameter maps, with and without N+
normaliza-tion, where N+ is the normalization with respect to the
median value of the parameter in the highly vascularized reference region: P∗ = P/P
0, where P and P∗ are
re-spectively the unnormalized and normalized parameter val-ues, and P0the median value of P in the reference region.
III. RESULTS
Median and quartiles parameter values within the highly vascularized region are shown in Table 1. The quantiles operators were used to limit the effect of aberrant val-ues. Some parameters, e.g. AUC and MTT, globally vary between exams, reflecting physiological changes.
Fig. 2 shows some parametric maps for one mouse at day 11 and 15. The tumor and highly vascularized reference re-gions are also displayed in this figure. The superficial and central zone of the tumor presents lower values of AUC, than the more peripheral zones of the tumor, while present-ing higher values of MTT.
Days AUC (a.u.) MTT (s) D3 111 [82.0− 177] 22.3 [21.3− 23.5] D5 284 [242− 344] 26.1 [22.9− 29.3] D9 279 [191− 383] 22.2 [20.5− 23.6] D11 196 [169− 232] 20.0 [17.2− 26.8] D15 287 [227− 328] 22.3 [21.0− 23.8] Table 1: Median and quartiles parameters values (AUC and MTT) inside a highly vascularized reference region of a mouse. MTT 1.00 3.16 10.0 31.6 100 AUC 20 30 40 50 1.00 3.16 10.0 31.6 100 20 30 40 50 60 70 1 cm 1 cm
Figure 2: Unnormalized parametric maps (AUC, MTT) of an ectopic tumor implanted in a mouse. Images were ac-quired 11 (top row) and 15 days (bottom row) after im-plantation. White curves represent the manually selected tumoral (dashed line) and highly vascularized (plain line) regions. No normalization N+ normalization D3 D5 D9 D11 D15 D3 D5 D9 D11 D15 0.5 cm 0.5 cm
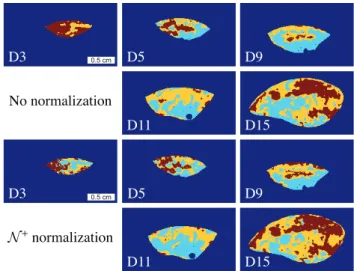
Figure 3: Classification results for one mouse, with and without applying N+ normalization. Blue, yellow and
red classes represent high, intermediate, and low values of AUC, respectively.
Fig. 3 presents classification results of parameter log(AUC) and log(AUC∗). Analysis of these results
veals an increased homogeneity of the classification re-gions when N+normalization is applied. This especially
shows at D3 and D11, days for which AUC is the lowest. IV. DISCUSSION-CONCLUSION
The AUC is directly linked to the amount of contrast agent flowing through the region of analysis. The use of N+ normalization on AUC led to more continuous
clas-sification regions and may potentially reduce inter-exam variability of assessments. MTT is a parameter reflect-ing a kinetic feature of blood flow in the analysis region. Appropriate normalization will be considered in a future work. Visual analysis of parametric maps reveals par-tial correlation between maps within the tumor. A finer selection of parameters used for classification could im-prove system performances. K-Means being an unsuper-vised classification method, a superunsuper-vised algorithm that uses immunohistochemistry-stained slides as ground truth data could make classification more robust and accurate. This feasibility study showed the potential to locally clas-sify zones of the tumor with respect to parameters describ-ing the relative concentrations and arrival times of ultra-sound contrast agent. With appropriate validation based on reference measurements of tumor vascular density and microvascular architecture, such classification may provide more robust evaluation of the functional flow in tumors.
ACKNOWLEDGEMENTS
This work is supported by FRM (DBS20131128436). REFERENCES
[1] A. Dizeux et al., IEEE IUS 2014, 1144-7.
[2] G. Barrois et al., IEEE Trans. UFFC, 2013, 60:2184:94.
[3] S. Lloyd, IEEE Trans. Inf. Theory, 1982, 28:129-37.