HAL Id: hal-02358626
https://hal.archives-ouvertes.fr/hal-02358626
Submitted on 12 Nov 2019HAL is a multi-disciplinary open access archive for the deposit and dissemination of sci-entific research documents, whether they are pub-lished or not. The documents may come from teaching and research institutions in France or abroad, or from public or private research centers.
L’archive ouverte pluridisciplinaire HAL, est destinée au dépôt et à la diffusion de documents scientifiques de niveau recherche, publiés ou non, émanant des établissements d’enseignement et de recherche français ou étrangers, des laboratoires publics ou privés.
AssemblyNet: A Novel Deep Decision-Making Process
for Whole Brain MRI Segmentation
Pierrick Coupé, Boris Mansencal, Michaël Clément, Rémi Giraud, Baudouin
Denis de Senneville, Vinh-Thong Ta, Vincent Lepetit, José Manjón
To cite this version:
Pierrick Coupé, Boris Mansencal, Michaël Clément, Rémi Giraud, Baudouin Denis de Senneville, et al.. AssemblyNet: A Novel Deep Decision-Making Process for Whole Brain MRI Segmentation. Inter-national Conference on Medical Image Computing and Computer-Assisted Intervention (MICCAI), Oct 2019, Shenzhen, China. pp.466-474, �10.1007/978-3-030-32248-9_52�. �hal-02358626�
AssemblyNet: A Novel Deep Decision-Making Process for
Whole Brain MRI Segmentation
Pierrick Coupé1, Boris Mansencal1, Michaël Clément1, Rémi Giraud2, Baudouin Denis de Senneville3, Vinh-Thong Ta1, Vincent Lepetit1 and José V. Manjon4 1 CNRS, Univ. Bordeaux, Bordeaux INP, LABRI, UMR5800, F-33400 Talence, France
2 Bordeaux INP, Univ. Bordeaux, CNRS, IMS, UMR 5218, F-33400 Talence, France 3 CNRS, Univ. Bordeaux, IMB, UMR 5251, F-33400 Talence, France
4 ITACA, Universitat Politècnica de València, 46022 Valencia, Spain
Abstract. Whole brain segmentation using deep learning (DL) is a very
chal-lenging task since the number of anatomical labels is very high compared to the number of available training images. To address this problem, previous DL meth-ods proposed to use a global convolution neural network (CNN) or few independ-ent CNNs. In this paper, we presindepend-ent a novel ensemble method based on a large number of CNNs processing different overlapping brain areas. Inspired by par-liamentary decision-making systems, we propose a framework called Assem-blyNet, made of two “assemblies" of U-Nets. Such a parliamentary system is capable of dealing with complex decisions and reaching a consensus quickly. AssemblyNet introduces sharing of knowledge among neighboring U-Nets, an “amendment” procedure made by the second assembly at higher-resolution to refine the decision taken by the first one, and a final decision obtained by majority voting. When using the same 45 training images, AssemblyNet outperforms global U-Net by 28% in terms of the Dice metric, patch-based joint label fusion by 15% and SLANT-27 by 10%. Finally, AssemblyNet demonstrates high ca-pacity to deal with limited training data to achieve whole brain segmentation in practical training and testing times.
Keywords: Whole brain segmentation, CNN, Ensemble learning, transfer
learning, multiscale framework.
1
Introduction
Quantitative brain analysis is crucial to better understand the human brain and to detect pathologies. However, whole brain segmentation is still a very challenging prob-lem, mostly due to the high number of anatomical labels compared to the limited num-ber of available training data. Indeed, manual segmentation of the whole brain is a very tedious and difficult task, preventing the production of large annotated datasets. To ad-dress this question, several methods have been proposed in the past years. One of the main references in the domain is the patch-based joint label fusion (JLF) which won the MICCAI challenge in 2012 [1]. More recently, deep leaning (DL) methods have also been proposed. Due to limited GPU memory, first attempts were based on
2 patchwise strategies [2][3] or 2D segmentation (slice by slice) [4]. Last year, first 3D fully convolutional network methods were proposed using reduced input data size (i.e., 128×128×128 voxels) [5] or Spatially Localized Atlas Network Tiles (SLANT) strat-egy [6]. This latter framework divides the whole volume into overlapping sub-volumes, each one being processed by a different U-Net [7] (e.g., 27). The SLANT strategy ad-dresses the problem of memory and simplifies the complex problem of whole brain segmentation into simpler problems, better suited to limited training data.
In this paper, we propose to extend this framework by using a much larger number of simpler U-Nets (i.e., 250). The main addressed question is the optimal organization of this large ensemble. To this end, we propose a new framework called AssemblyNet. Inspired by decision-making process developed by human societies to deal with com-plex problems, we decided to model a parliamentary system based on two separate as-semblies. Such bicameral – meaning two chambers – parliament has been adopted by many countries around the world. A bicameral system is usually composed of an upper and a lower chamber, both having their own independency to ensure the balance of power. However, an assembly may communicate its vote to the other for amendment. Such parliamentary system is capable of dealing with complex decisions and reaching a consensus quickly.
2
Methods
2.1 General overview
In AssemblyNet, both assemblies are composed of U-Net considered as “assembly members” (see Fig. 1). Each member represents one territory (i.e., brain area) in the final vote. To this end, we used spatially localized networks where each U-Net only processes a sub-volume of the global volume as done in [6]. Sub-volumes overlap each other, so the final segmentation results from an overcomplete aggregation of local votes. A majority vote is used to obtain the global segmentation. Moreover, each mem-ber can share knowledge with his nearest neighbor in the assembly. In particular, we propose a novel nearest neighbor transfer learning strategy, where weights of the spa-tially nearest U-Net are used to initialize the next U-Net. In addition, we also propose to use prior knowledge on the expected final decision which can be viewed as the bill (i.e., draft law) submitted to an assembly for consideration. As prior knowledge, we decided to use non-linearly registered Atlas priors. Finally, we also propose modeling communication between both assemblies using an innovative strategy. In Assem-blyNet, we used a multiscale cascade of assemblies where the first assembly produces coarse decision at 2×2×2 mm. This coarse decision is transmitted to the second assem-bly for analysis at 1×1×1 mm. This amendment procedure is similar to an error correc-tion or a refinement step. After consideracorrec-tion by both assemblies, the bill under consid-eration becomes a law which represents the final segmentation in our system.
Our contributions are threefold: i) the use of prior knowledge based on fast atlas registration, ii) a knowledge sharing between CNNs using nearest neighbor transfer learning and iii) an iterative refinement process based on a multiscale cascade of as-semblies.
3
Fig. 1. Illustration of the proposed AssemblyNet framework.
2.2 Proposed framework
Preprocessing: To homogenize input orientations and intensities, all the images are first preprocessed with the following steps: i) denoising [8], ii) inhomogeneity correc-tion [9], iii) affine registracorrec-tion into the MNI space (181×217×181 voxels at 1×1×1 mm)
[10], iv) tissue-based intensity normalization [11] and v) brain extraction [12]. After-wards, image intensities are centralized and normalized within the brain mask.
Atlas priors: To obtain priors knowledge on the expected results, we perform a
non-linear registration of the MICCAI 2012 Multi-Atlas Labeling Challenge atlas to the subject under consideration.
Assembly description: Each assembly is composed of 125 U-Nets equally distributed
in the MNI space along each axis (i.e., 5 along x, y and z). Each 3D U-Net processes a sub-volume large enough to ensure at least 50% of overlap between sub-spaces. At the end, a majority vote is used to aggregate the local votes.
Nearest neighbor transfer learning: To enable knowledge sharing between U-Nets
of an assembly, we propose a new transfer learning where the weights of the nearest U-Net are used to initialize the next U-U-Net. In practice, we only copy the weights of the descending path of the U-Net architecture. At the beginning, we train the first U-Net from scratch. Then, each U-Net on the first column is initialized with weights of the previous U-Net. Once the first column is trained, each U-Net of the next column is initialized with the U-Net at the same position on the previous column and so on. Fi-nally, once the first 2D plane of U-Nets is trained, each U-Net of the next 2D planes is initialized with the U-Net at the same position on the previous plane and so on.
Multiscale cascade of assemblies: To make our decision-making system faster and
more robust, we decided to use a multiscale framework. Consequently, the first assem-bly at 2×2×2 mm produces a coarse segmentation. Afterwards, an up-sampling of this segmentation to 1×1×1 mm is performed using nearest neighbor interpolation. The sec-ond assembly estimates the final result at 1×1×1 mm.
Refinement Second assembly at 1mm Coarse decision First assembly at 2mm Atlas prior at 2mm Up-sampled segmentation at 1mm Final segmentation at 1mm 3D U-Net Transfer learning Majority vote Atlas priors at 1mm MRI at 1mm MRI at 2mm
4
3
Experiments
3.1 Datasets
Training dataset: 45 T1w MRI from the OASIS dataset [13] manually labeled
accord-ing to the BrainCOLOR protocol were used for trainaccord-ing. The selected images were the same than the ones used in [6]. All the used images and manual segmentations are from Neuromorphometrics Inc. During our experiments, we used the 132 anatomical labels consistent across subjects (see [6]).
Testing dataset: 19 T1w MRI manually labeled according to the BrainCOLOR
proto-col were used for testing. These MRI come from three different datasets: 5 from the OASIS dataset, one from the colin27 cohort [14] and 13 from the CANDI database [15]. This testing dataset is the same than the one used in [6].
3.2 Implementation details
Data augmentation: First, the training images were flipped along mid sagittal plane in
the MNI space. Then, we used MixUp data augmentation during training to minimize overfitting problems [16]. This method performs a linear interpolation of a random pair of training examples and their corresponding labels.
Training framework: For all the networks, we used the U-Nets architecture proposed
in [6], but with a lower number of filters. Instead of using a basis of 32 filters of 3×3×3 – 32 for the first layer, 64 for the second and so on – we selected a basis of 24 filters of 3×3×3 to reduce by 25% the network size. Moreover, we used the same parameters for all the U-Nets with: batch size = 1, optimizer = Adam, epoch = 100, loss = Dice and dropout = 0.5 after each block of the descending path. For the U-Nets of the first as-sembly at 2×2×2 mm, we used input resolution = 32×48×32 voxels and input channel = 2 (i.e., T1w and Atlas priors). For the U-Nets of the second assembly at 1×1×1 mm, we used input resolution = 64×72×64 voxels and input channel = 3 (i.e., T1w, Atlas priors and up-sampled coarse segmentation). In addition, to compensate for the small batch size, we performed model weights averaging. At the end of the 100 epochs, we performed additional 20 epochs where the model estimated at each epoch is averaged with previous ones. Such average of model weights along the optimization trajectory leads to better generalization than usual training [17]. Finally, we also performed drop-out at test time [18]. For each U-Net, we generate 3 different drop-outputs before averaging them. Such method helps reducing variance of the networks. As in [6], the experiments were done with an NVIDIA Titan Xp with 12 GB memory and thus processing times are comparable.
Computational time: The preprocessing steps take around 90s. The non-linear
regis-tration of the atlas takes less than 5s thanks to a deep leaning framework similar to [19]. The first assembly at 2×2×2 mm requires 3min to segment an image while the second assembly at 1×1×1 mm requires 5min. At the end, the final segmentation is registered back to the native space using inverse affine transform estimated during preprocessing. This interpolation takes around 30s. Therefore, the full AssemblyNet process takes around 10min including preprocessing and inverse registration back to the native space.
5
3.3 Validation framework
First, for each testing subject, we estimated the average Dice coefficient on the 132 considered anatomical labels (without background) in the native space. Afterwards, we estimated the global mean Dice in % over the 19 testing images. In this study, we com-pared AssemblyNet with several state-of-the-art methods. First, the patch-based joint label fusion (JLF) [1] is used as reference. In addition, we included U-Net [7], SLANT-8 and SLANT-27 methods as proposed in [6]. SLANT-SLANT-8 is based on SLANT-8 U-Nets pro-cessing non-overlapping sub-volumes of 86×110×78 voxels while SLANT-27 is based on 27 U-Nets processing overlapping sub-volumes 96×128×88 voxels. All these meth-ods were trained on the 45 training images described in section 3.1. Finally, we included SLANT-27 trained on 5111 auxiliary images segmented using JLF and fined tuned on the 45 training images. This is the best published results for whole brain segmentation to our knowledge. For all these methods we report the results published in [6].
4
Results
First, we evaluated the proposed contributions (see Tab. 1). Compared to baseline results at 2×2×2 mm (Dice=67.4%), the used of Atlas priors provided a gain of 0.5% in term of mean Dice. Moreover, the combination of Atlas priors and transfer learning improved by 0.7% the baseline mean Dice. In addition, multiscale cascade of assem-blies increased by 1.6% the mean Dice obtained with Assembly at 1×1×1 mm without multiscale cascade (Dice=72.2%). Finally, AssemblyNet outperformed by 8.7% the mean Dice obtained with baseline Assembly at 2×2×2 mm.
Table 1. Evaluation of the proposed contributions. The mean Dice is evaluated on the 19 images
of the test dataset in the native space for the 132 considered labels (without background). Testing time includes image preprocessing and registration back to the native space.
Methods Atlas
prior Transfer learning Multi-scale Mean Dice in % Training time Testing time Assembly at 2×2×2 mm No No - 67.4 29h 5min Assembly at 2×2×2 mm Yes No - 67.7 29h 5min Assembly at 2×2×2 mm Yes Yes - 67.9 29h 5min Assembly at 1×1×1 mm Yes Yes No 72.2 6 days 7min AssemblyNet Yes Yes Yes 73.3 7 days 10min
Afterwards, we compared AssemblyNet with state-of-the-art methods (see Tab. 2). When considering only methods trained with 45 images, AssemblyNet improved mean Dice obtained with U-Net and SLANT-8 by 28%, JLF by 15% and SLANT-27 by 10%. AssemblyNet was also efficient in term of training and testing times compared to SLANT-based methods. It has to be noted that Assembly at 2×2×2 mm outperformed all the methods except AssemblyNet while working at lower resolution. Finally, com-pared to SLANT-27 trained over 5111+45 images, our method provided slightly better results (without library extension) while being faster to train and to execute. According to [6], their library extension required 21 CPU years to be completed. Consequently,
6 such an approach is impractical or very costly using a cloud-based solution. Therefore, all these results demonstrate that AssemblyNet is very efficient to deal with limited training data and to accurately achieve segmentation in practical training and testing times.
Table 2. Methods comparison on the 19 images of the testing dataset. The mean Dice
is evaluated on the 132 considered labels (without background) in the native space.
Methods Number of training
images
Mean Dice
in % Training time Testing time extension Library time U-Net [6] 45 57.0 33h 8min 0s SLANT-8 [6] 45 57.0 11 days 10min 0s
JLF [1] 45 63.4 0s 34h 0s
SLANT-27 [6] 45 66.1 42 days 15min 0s Assembly at 2×2×2 mm 45 67.9 29h 5min 0s SLANT-27 [6] 5111 + 45 72.9 27 days 15min 21 years* AssemblyNet 45 73.3 7 days 10min 0s * Library extension time represents the CPU time required to segment 5111 MRI using JLF (i.e., 34h*5111). This number of 21 CPU years is reported in [6].
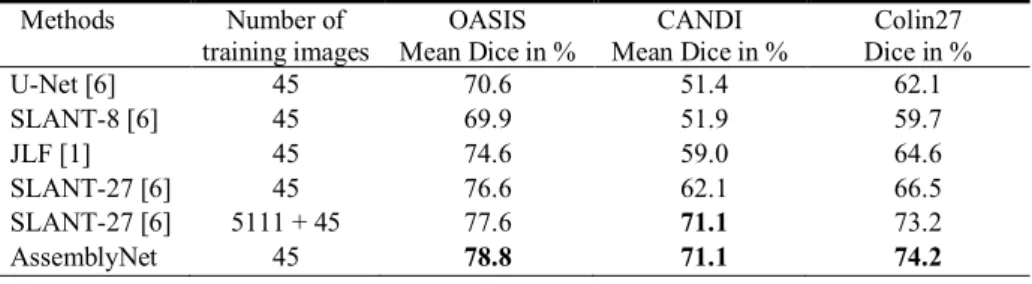
Finally, we analyzed the performance of the methods according to the dataset. Mean Dice coefficients obtained on each testing dataset (i.e., OASIS, CANDI and Colin27) are provided in Tab. 3. As expected, all the methods performed better on adult scans from the OASIS dataset since the training dataset comes from the same cohort. On this dataset AssemblyNet outperformed all the methods. On child scans from the CANDI dataset acquired with different protocols, we can note a dramatic drop in performance for all the methods except for AssemblyNet and SLANT-27 trained on 5111+45 im-ages. The auxiliary library used by SLANT-27 is based on 9 different databases (64 acquisition sites) and includes more than 1000 scans of child making this method able to segment child MRI. By using only 45 adult scans coming from a single acquisition site, AssemblyNet produced similar results on this dataset. This demonstrates the ro-bustness of the proposed framework to unseen acquisition protocol and ages. Finally, on the high-resolution Colin27 image, AssemblyNet obtained the best segmentation accuracy. As for SLANT-27, one could expect segmentation improvements for Assem-blyNet using library extension. We will investigate such framework in future work.
Table 3. Methods comparison on the different testing datasets (5 adult scans from OASIS, 13
child scans from CANDI child and the high-resolution Colin27 image based on scans average). Methods Number of training images OASIS Mean Dice in % CANDI Mean Dice in % Colin27 Dice in % U-Net [6] 45 70.6 51.4 62.1 SLANT-8 [6] 45 69.9 51.9 59.7 JLF [1] 45 74.6 59.0 64.6 SLANT-27 [6] 45 76.6 62.1 66.5 SLANT-27 [6] 5111 + 45 77.6 71.1 73.2 AssemblyNet 45 78.8 71.1 74.2
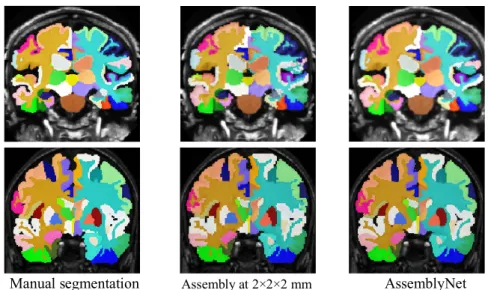
7 Manual segmentation Assembly at 2×2×2 mm AssemblyNet
Fig. 2. Examples of segmentation in the native space obtained for one test subject from OASIS
(at the top) and one test subject from CANDI (at the bottom). Note the accuracy of the segmen-tation compared to the manual segmensegmen-tation.
Fig. 1 shows segmentation in the native space for a subject from the OASIS dataset and one for the CANDI cohort. This figure shows segmentation at 2×2×2 mm and the improvement obtained using refinement at 1×1×1 mm with the second assembly.
5
Conclusion
In this paper, we proposed to use of a large number of CNNs to perform whole brain segmentation. We investigated how to organize this large ensemble of CNNs to quickly and accurately segment the brain. To this end, we designed a novel deep decision-mak-ing process called AssemblyNet based on two assemblies of U-Nets. Our validation showed the very competitive results of AssemblyNet compared to state-of-the-art meth-ods. We also demonstrated that AssemblyNet is very efficient to deal with limited train-ing data and to accurately achieve segmentation in a practical traintrain-ing and testtrain-ing times.
Acknowledgement: This work benefited from the support of the project DeepvolBrain of the
French National Research Agency (ANR-18-CE45-0013). This study was achieved within the context of the Laboratory of Excellence TRAIL ANR-10-LABX-57 for the BigDataBrain pro-ject. Moreover, we thank the Investments for the future Program IdEx Bordeaux (ANR-10-IDEX- 03- 02, HL-MRI Project), Cluster of excellence CPU and the CNRS. This study has been also supported by the DPI2017-87743-R grant from the Spanish Ministerio de Economia, Indus-tria Competitividad. The authors gratefully acknowledge the support of NVIDIA Corporation with their donation of the TITAN Xp GPU used in this research.
8
References
[1] H. Wang and P. Yushkevich, “Multi-atlas segmentation with joint label fusion and correc-tive learning—an open source implementation,” Front. Neuroinform., vol. 7, 2013. [2] A. de Brebisson and G. Montana, “Deep Neural Networks for Anatomical Brain
Segmen-tation,” in IEEE CVPR Workshops, 2015, pp. 20–28.
[3] C. Wachinger et al., “DeepNAT: Deep convolutional neural network for segmenting neu-roanatomy,” NeuroImage, vol. 170, pp. 434–445, Apr. 2018.
[4] A. G. Roy et al., “Error Corrective Boosting for Learning Fully Convolutional Networks with Limited Data,” in MICCAI 2017, 2017, pp. 231–239.
[5] K. C. L. Wong et al., “3D Segmentation with Exponential Logarithmic Loss for Highly Unbalanced Object Sizes,” in MICCAI 2018, 2018, pp. 612–619.
[6] Y. Huo et al., “3D whole brain segmentation using spatially localized atlas network tiles,”
NeuroImage, 2019.
[7] O. Ronneberger et al., “U-Net: Convolutional Networks for Biomedical Image Segmenta-tion,” in MICCAI 2015, 2015, pp. 234–241.
[8] J. V. Manjón et al., “Adaptive non-local means denoising of MR images with spatially varying noise levels,” JMRI, vol. 31, no. 1, pp. 192–203, 2010.
[9] N. J. Tustison et al., “N4ITK: Improved N3 Bias Correction,” IEEE Trans Med Imaging, vol. 29, no. 6, pp. 1310–1320, 2010.
[10] B. B. Avants et al., “A reproducible evaluation of ANTs similarity metric performance in brain image registration,” NeuroImage, vol. 54, no. 3, pp. 2033–2044, Feb. 2011. [11] J. V. Manjón et al., “Robust MRI brain tissue parameter estimation by multistage outlier
rejection,” Magnetic Resonance in Medicine, vol. 59, no. 4, pp. 866–873, 2008.
[12] J. V. Manjón et al., “Nonlocal intracranial cavity extraction,” IJBI, vol. 2014, p. 10, 2014. [13] D. S. Marcus et al., “Open Access Series of Imaging Studies (OASIS): cross-sectional MRI
data in young, middle aged, nondemented, and demented older adults,” Journal of cognitive
neuroscience, vol. 19, no. 9, pp. 1498–1507, 2007.
[14] D. L. Collins et al., “Design and construction of a realistic digital brain phantom,” IEEE
TMI, vol. 17, no. 3, pp. 463–468, 1998.
[15] D. N. Kennedy et al., “CANDIShare: A Resource for Pediatric Neuroimaging Data,”
Neu-roinform, vol. 10, no. 3, pp. 319–322, 2012.
[16] H. Zhang et al., “mixup: Beyond Empirical Risk Minimization,” arXiv:1710.09412, 2017. [17] P. Izmailov et al., “Averaging Weights Leads to Wider Optima and Better Generalization,”
arXiv:1803.05407, 2018.
[18] Y. Gal and Z. Ghahramani, “A Theoretically Grounded Application of Dropout in Recurrent Neural Networks,” Advances in Neural Information Processing Systems, pp. 1019–1027, 2016.
[19] G. Balakrishnan et al., “VoxelMorph: A Learning Framework for Deformable Medical Image Registration,” IEEE TMI, 2019.