HAL Id: hal-02324931
https://hal.archives-ouvertes.fr/hal-02324931
Submitted on 22 Oct 2019
HAL is a multi-disciplinary open access
archive for the deposit and dissemination of
sci-entific research documents, whether they are
pub-lished or not. The documents may come from
teaching and research institutions in France or
abroad, or from public or private research centers.
L’archive ouverte pluridisciplinaire HAL, est
destinée au dépôt et à la diffusion de documents
scientifiques de niveau recherche, publiés ou non,
émanant des établissements d’enseignement et de
recherche français ou étrangers, des laboratoires
publics ou privés.
THEORETICAL PLASMA CHARACTERIZATION
DURING CURRENT PULSE
Malyk Benmouffok, Pierre Freton, Jean Jacques Gonzalez
To cite this version:
Malyk Benmouffok, Pierre Freton, Jean Jacques Gonzalez. THEORETICAL PLASMA
CHARAC-TERIZATION DURING CURRENT PULSE. IJRRAS, 2018, 34. �hal-02324931�
THEORETICAL PLASMA CHARACTERIZATION DURING
CURRENT PULSE
M. Benmouffok, P. Freton, J.J. Gonzalez
LAPLACE, Université de Toulouse, CNRS, INPT, UPS 118 rte de Narbonne, 31062 Toulouse cedex France
ABSTRACT
The economic/ecological contexts and the CO2 regulation lead the automotive industry to improve the spark ignited engines. A way of improvement is the admission of a lean mixture or of a diluted mixture by recirculation of exhaust gases in the combustion chamber. The main difficulty in these conditions is to start the combustion. To overcome this problem, ignition systems are studied and more particularly the spark one. This discharge leads to the apparition of plasma and the understanding of the energy transfer mechanisms between this plasma and the reactive mixture is essential. This work is focus on the modeling of a spark during its electrical arc phase in order to predict the hydrodynamic behavior of the arc and the shock wave propagation. The difficulty on the choice of initial conditions for the model is highlighted. A two dimensional model based on ANSYS Fluent software is developed. This model allows us to show the role of each initial parameter as well as their impacts on the plasma flow. One calculation case presents the shock wave propagation and the plasma kernel. Finally a parametric study is presented. Without a complete model describing all the phases of the spark the choice of initial conditions is essential, nevertheless experimental measurements are difficult to perform. The interdependence of the initial parameters is demonstrated and care is needed in case of incomplete set of initial conditions which should be completed.
Keywords: Spark, shock wave, plasma kernel, 2D model
I. INTRODUCTION
Spark ignition engine is one of the most popular engines in the world. This is certainly due to its wide application range: two-strokes or four-strokes, for transport or lawn and garden equipment [1]. However, Kyoto protocol imposes the regulation of CO2 emissions with a worldwide forecast of around 100g CO2/km in 2020-2025 [2]. So strategies have been developed, notably in the transport domain and on spark ignition, in order to improve the energetic efficiency of the engine and to reduce the air pollution. Ways are investigated by industrials to reach these goals as the downsizing of engines and the Exhaust Gas Recirculation (EGR). The difficulty with these technologies
is to ignite mixtures with high dilution rate of EGR, or a lean mixture. The solution could be an improvement of ignition systems. It exists several ways to ignite a reactive mixture, using laser assisted combustion, plasma assisted combustion which includes corona discharges and spark ignition systems. In this study, we investigated the spark ignition system, also called conventional ignition system. In order to improve the conventional system, it is necessary to have a better understanding of reachable spark characteristics by experimental or theoretical way.
Numerous papers on the simulation approach can be found [3-18]. Nevertheless, in almost all theoretical papers, experimental measurements are needed to determine the initial conditions. The spark ignition systems is very difficult to be studied experimentally due to fast transient phenomena, to high instabilities of the spark generated by conventional ignition systems and due to the difficulty to measure parameters with short electrode gap of the sparkplug. This is probably why only few experimental papers can be found specifically on the early phase of the ignition. In consequence, many authors [3-24] have based their studies (theoretical or experimental) on specifics conditions:
- Simplified setup (cylindrical or pin-to-pin electrodes), - Given ignition system
- laboratory vessel instead of a combustion chamber - Simplified gas mixtures.
Most of experimental works studying the arc phase have been done in air. Indeed, the combustion process occurring in reactive mixture could disturb the measurement or the visualization of the spark.
The most complete experimental study on conventional system has been done in the eighties by H. Albrech et al [19] and R. Maly [20]. Their experimental results are the reference for many simulations achieved in the last fifteen years [3-5] [7-10]. Their works have been achieved on a simplified geometry (pin to pin electrodes) and enable to obtain a lot of information. R. Maly [20] described each phase of the spark event: pre-breakdown, breakdown, arc and glow phases. For each phases, he details the electrical characteristics and physical quantities as electronic density. Concerning the measured parameters which are important for the simulation, he gives the temporal evolution of the gas temperature, the pressure and the diameter of the spark channel generated by the breakdown phase early after it. Schlieren visualization has shown that very short spark duration leads to the creation of a toroidal shape. Excepted R. Maly who has worked on conventional spark ignition system, the majority of the authors have worked on capacitive discharge which has a shorter duration than conventional (or inductive) discharge, leading to higher current peak value [13][24].
In case of spark simulation, the literature review showed that authors assume the existence of a conducting channel and that the rapid increase of the temperature within this channel leads to the propagation of a shock wave. The initial conditions are essential for spark simulation in order to well characterize the medium; however it is possible to find a lot of sets of initial conditions characterizing the first instants depending on the author.
Figure 1: Several sets of initial conditions used by authors from the literature [6-10]
Figure 1 plots different set of initial conditions for several authors of the literature [6-10]. The continuous lines refer to R. Maly measurements [20]. The dashed lines are extrapolated from R. Maly curves in order to place the values used by C. Zaepffel [6]. The initial temperature in the channel is chosen by these authors in the range 10kK to 35kK. The pressure inside the channel can be found from 10 bars to 100 bars. For the radius of the initial channel, there are also some differences between authors; the radius varies from 100 µm to 200 µm. At a given time, the set of initial conditions differs and this fact is difficult to explain as all referred to R. Maly measurements [20]. In reality according to R. Maly measurements from Figure 1, the choice of one parameter value gives the values of the two others. For example, referring to R. Maly works if we consider one initial diameter equals to d=224 m, corresponding to time 80 ns, the initial pressure and temperature should be respectively P=10 bars and T=37 kK. However the initial values used for instance by Ekici [10] are P=100 bars (t=20 ns), T=35 kK (t=80 ns) and d =224
m (t=80 ns).
The energy deposition is also one important parameter in spark ignition simulation. In some cases, the total energy of the discharge is injected as initial condition. On the other hand, some authors use a time dependent energy deposition. For example, Kravchik et al [7] inject 0.3 mJ as initial condition then they apply 2.5 mJ using a transient
electrical source term during the simulation whereas S. Bane [8-9] has injected the total energy (2 mJ) in the initial spark channel. This initial energy contained within the spark channel as initial condition varies with several order of magnitude from an author to another in the range of some µJ [7] to hundreds mJ [12-13]. The literature review shows many differences on the choice of initial conditions for the simulation. In most case, the authors choose their own set of initial conditions without taking care of the corresponding energy.
In this work, a short spark in a two-dimensional hydrodynamic transient simulation is considered to simulate the arc phase of the spark and to show the role of each initial parameter on the discharge. We propose a parametric study, concerning initial conditions and initial energy. Parameters are initial radius of the spark, initial temperature and initial pressure. We will show their impacts on the spark (volume and shape of the spark kernel). The paper is devoted to the model developed, with the presentation of the set of equations, the hypothesis and the calculation domain with the associated boundary conditions. Using cylindrical electrodes the influence of the initial parameters will be demonstrated on the plasma characteristics through the temperature and pressure fields and the resulting deposit of energy. The main objective of the paper was to make sensitive the authors to the necessity to well define the set of initial parameters in case of comparison with experimental results from literature and also to study the flow and pressure wave behaviors depending on these initial parameters.
II. Model description
II. 1: Hypotheses
The fluid assumption is used to describe the plasma flow by solving Navier–Stokes equations.
The cylindrical coordinates system is solved in two-dimensions.
Radiation losses are taken into account by the net emission coefficient method.
The transient flow is assumed to be laminar.
According to R. Maly [25] we consider thermal plasma described by a unique energy equation. Indeed in case of plasma medium with an electronic temperature around 30kK and a pressure equals to 10 bars R. Maly has estimated the time to reach the equilibrium to few Nano seconds.
The electrodes sheaths are not considered.
The self-induced magnetic field is not taken into account due to the short duration of the high current phase (<1µs) according to literature [3-7].
II – 2: Equations
The CFD model (Ansys Fluent) is based on the finite volume method. Based on the generalized Equation 1, it solves the mass (Eq.2), momentum (Eq.3 and 4) and energy (Eq.5) conservation equations coupled with the scalar potential resolution (Eq.6).
a∂ρϕ∂t + ∇⃗⃗ ∙ (ρv⃗ ϕ) = ∇⃗⃗ ∙ (ГФ∇⃗⃗ ϕ) + Sϕ (1)
The equations are given in Table1:
Conservation equation φ a ГФ 𝒔Ф Mass (2) 1 1 0 0 Axial momentum (3) 𝑣𝑧 1 μ −𝜕𝑝 𝜕𝑧+ 1 𝑟 𝜕 𝜕𝑟(𝑟μ 𝜕𝑣𝑟 𝜕𝑧) + 1 3 𝜕 𝜕𝑧(μ 𝜕𝑣𝑧 𝜕𝑧) − 2 3 𝜕 𝜕𝑧( 1 𝑟 𝜕 𝜕𝑟(𝑟𝑣𝑟)) Radial momentum (4) 𝑣𝑟 1 μ −𝜕𝑝 𝜕𝑟+ 1 𝑟 𝜕 𝜕𝑟(𝑟μ 𝜕𝑣𝑟 𝜕𝑧) + 1 3 𝜕 𝜕𝑧(μ 𝜕𝑣𝑧 𝜕𝑧) − 2 3 𝜕 𝜕𝑧( 1 𝑟 𝜕 𝜕𝑟(𝑟𝑣𝑟)) Energy (5) h 1 𝐶𝜅 𝑝 𝑣𝑧𝜕𝑝𝜕𝑧+ 𝑣𝑟𝜕𝑝𝜕𝑟+ μ [2 ((𝜕𝑣𝜕𝑟𝑟) 2 +𝑣𝑟 2 𝑟2+ ( 𝜕𝑣𝑧 𝜕𝑧) 2 ) + (𝜕𝑣𝑟 𝜕𝑧 + 𝜕𝑣𝑧 𝜕𝑟) 2 −2 3𝜇 ( 1 𝑟 𝜕 𝜕𝑟(𝑟𝑣𝑟) + 𝜕𝑣𝑧 𝜕𝑧) 2 ] +𝑆𝑒𝑙𝑒𝑐 − 𝑆𝑟𝑎𝑑+52𝑘𝑒(𝐶𝑗𝑧 𝑝 𝜕ℎ 𝜕𝑧+ 𝑗𝑟 𝐶𝑝 𝜕ℎ 𝜕𝑟) Scalar potential (6) V 0 𝝈 0
Table 1: Equations solved
is the variable solved, the diffusion coefficient, S the source term, the mass density, P the pressure,
the viscosity, the thermal conductivity, the electrical conductivity, vr and vz the radial and axial velocity components, Jr and Jz the radial and axial current density components deduced from the scalar potential V. k and e are the Boltzmann constant and the elementary charge of the electron. Cp is the specific heat.
In the energy conservation equation, Selec is the electrical power dissipated by Joule effect (Eq.7) and Srad (Eq.8) the source term of radiative losses.
𝑆𝑒𝑙𝑒𝑐=
𝑗𝑧2+ 𝑗𝑟2
𝑆𝑟𝑎𝑑= 4𝜋𝜀𝑛 (8)
The term 𝜀𝑛 corresponds to the net emission coefficient which is the power radiated per unit volume and
solid angle [26]. Parameters such as viscosity, density, thermal conductivity and electrical conductivity of the fluid are tabulated and are functions of the temperature and pressure. Thermodynamic and transport properties are given in the software up to 60 000K [26-27].
II – 3: Computation domain and boundary conditions
The geometry studied is taken from C. Zaepffel [6] and is presented in the Figure 2. It consists on a two cylindrical electrodes of radius 0.5 mm and 3 mm long. In order to simplify and to reduce computing cost, an axisymmetric system is assumed (green color). The dimension of the whole computation domain is 8mm x 8mm. The cell size is 10 µm (Uniform). The gap size is 2mm. The electrodes surfaces are adiabatic. At the edges of the domain (red color) a “pressure-outlet” condition is used (1 bar and 300K). The inlet or outlet flows depend of the pressure gradients at the edges. At the anode a reference potential V=0 is imposed.
Figure 2: Calculation domain and dimensions
In order to model the electrical current, we impose the axial current density as boundary condition on the cathode tip. We assume the current density constant on the area of arc attachment chosen equal to Rc=0.2mm [6].
0 < 𝑟 < 𝑅𝑐 𝐽𝑧=
𝐼
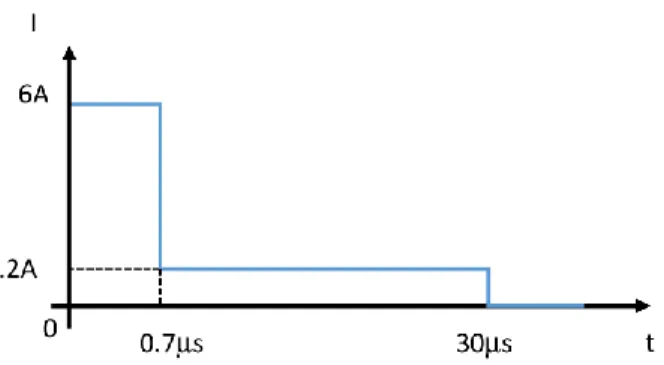
Figure 3: Current intensity I(A) applied in the discharge
II – 4: Initial conditions and difficulty
Only few papers are available in the literature on the short spark, and very often all the quantities necessaries to characterize the discharge are not given due mainly to the difficulty of measurements. The studies can be related to an inductive or a capacitive system nevertheless this detail is not given. However the capacitive or inductive ignition systems have their own particularities. The capacitive system produces high current level and allows parametric studies: temperature, pressure or current and voltage measurements [19][24]. The inductive system are very used for spark ignition engine for transport nevertheless the experimental measurement and observations are difficult to realized due to the low current generated and the small inter electrodes gap. Each of these systems has its specificities: dwell time, energy stored at the primary coil, energy transferred to the gas, current level and breakdown voltage. All these parameters impact and change the initial conditions for the simulation. For example the capacitive system transfers more energy during the first instants and should have a bigger conducting channel with a higher pressure. On the contrary the life time of the inductive system will be longer but the deposit of energy at the start will be smaller. Consequently the channel radius and its pressure are smaller.
Experimental measurements in case of small and rapid discharge are difficult to perform nevertheless the theoretical results are very sensitive to the choice of the initial conditions. The bibliographic study has allowed to highlight several papers mentioned in this work, however mainly of these papers refer to R. Maly works as very few experimental studies and results are available. The study presented by H. Albrecht et al [19] where R. Maly is one of the authors is the only detailed experimental study that we have found which gives one complete set of the parameters necessary for the simulation and its validation.
This initial energy deposited in the channel is an important parameter which must be calculated as it allows a comparison with the experimental energy deduced from electrical measurements. In case of confrontation between theoretical and experimental results this energy must be the same; indeed difference on the energy could specify that either we are studying two different ignition systems either we are looking at two different times after the breakdown. The internal energy Uint is defined by the following equation:
Uint= ∑ Ni[kT2 ∂lnQint,i ∂T +3 2kT + Ei ref] N
Qint,i is the internal partition function of species i and Eiref its energy of reference. Ni is the density of the
specie i.
For each case, the initial energy is defined knowing the electrode gap and the channel radius.
𝐸𝑖𝑛𝑖𝑡= 𝑈𝑖𝑛𝑡∗ 𝜌 ∗ 𝑉𝑖𝑛𝑖𝑡= (𝜌h − P) ∗ 𝑉𝑖𝑛𝑖𝑡 (11)
Vinit is the initial channel volume which is obtained knowing the electrode gap and the channel radius. For one temperature channel, the enthalpy and the mass density are given by the data banks depending on the pressure value.
III – Results
III – 1: Cases considered
Our simulation starts just after the breakdown phase. So, we assume the existence of a conducting channel crossed by a current. In order to establish the channel several parameters need to be fixed: the radius of the channel and its temperature and pressure. Based on the literature works (Figure 1) we have considered for the parametric study a temperature range from 7 500K to 35 000K, a radius from 200m to 500m. The ranges of these parameters cover the majority of initial conditions encountered in the literature. Due to the very fast heating of the gas into the conducting channel the associated pressure could also reach several tens of bar. We will try to demonstrate the importance of each parameter and the impact on the initial energy. In reality these parameters are linked. Indeed for a given channel radius and a given deposit of energy corresponds one pressure.
We assume the existence of the channel just after the breakdown phase. In the table 2 we define ten cases for the channel description. In the outer part of the channel we consider, as initial condition, a calculation domain with P=1 bar and T=300K.
Case Temperature Pressure Radius 𝑬𝒊𝒏𝒊𝒕 Ref.
1 20 000K 10bar 500µm 11mJ [6] 2 10 000K 10bar 500µm 11mJ [6] 3 10 000K 5bar 500µm 5.7mJ [6] 4 10 000K 10bar 200µm 1.7mJ [6] 5 10 000K 5bar 200µm 0.9mJ [6] 6 10 000K 30bar 200µm 5mJ - 7 10 000K 60bar 200µm 9.6mJ - 8 10 000K 60bar 500µm 60mJ - 9 7 500K 10bar 500µm 9.6mJ [11] 10 35 000K 100bar 200µm 15.9mJ [10]
The first column corresponds to the case number; the second one to the initial temperature of the channel; the third one to the initial pressure; the fourth one gives the channel radius. Finally the initial energy is deduced from equation 11 and in the last column the reference from the literature is given.
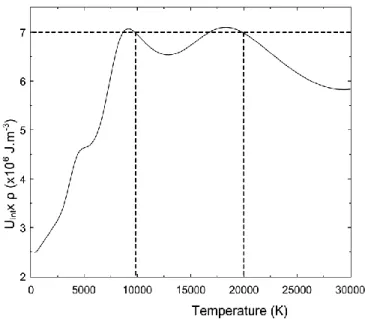
One particularity can be observed in Table 2 between the cases 1 and 2. The channel temperature is two times higher however the calculated initial energy is the same. This is due to the product of the internal energy by the mass density (Equation 11). This product is plotted versus the temperature in the Figure 4. We can observe that at a given pressure (chosen here to 10 bars) for the same initial volume, the same initial energy can be obtained from different temperature values. This fact explains the values encountered in Table 2 between case 1 & case 2 which present the same initial Energy Einit as the temperatures channel are different.
Figure 4: Internal energy by mass density versus temperature for air plasma at 10bar.
III – 2: Flow behavior (Case 1)
In this section, we present general results obtained from case 1. This case will be used as a reference case for the parametric study. At the beginning of the calculation t=0 s, we assume an initial spark channel (radius=500
m) with high temperature T=20 kK and a pressure inside P=10 bar. The breakdown is a very fast phenomenon (<20 ns), the rapid increase of temperature doesn’t let enough time to the pressure to be equilibrated. A shock wave is generated and the plasma channel starts to expand in the radial direction.
Figure 5 - Velocity field at t=200ns in air (Case 1)
The phenomenon is illustrated in the Figure 5. This case 1 corresponds to an initial energy Einit=11 mJ. Figure 5 presents the velocity field at t=200 ns in an air plasma between the two electrodes. The two letters refer to the cathode (C) and anode (A) electrodes. The mean velocity expands with a value of 400 m/s. Two maxima can be observed close to the two electrodes with a value of 1000 m/s. In order to determine the position of the shock wave, we define the quantity. This quantity is based on the axial and radial gradients of the mass density and could be assimilated to a numerical representation of the Schlieren method [27]:
𝜉 = √(𝜕𝜌𝜕𝑧)2+ (𝜕𝜌
𝜕𝑟)2 (12)
An illustration of the quantity compared to a Schlieren acquisition [28] is presented in the Figure 6 30s after the breakdown. A good agreement is found between the theoretical measurement and the quantity defined by the equation 12.
Figure 6: Illustration of quantity (right side) compared to a Schlieren acquisition (left side) [28].
corresponds to the second one. These two positions are represented versus time in the Figure 7. We have also represented in this figure the position of the temperature T=1000K. The can note that the position of the temperature T=1000K corresponds to the position of the first maximum given by the quantity (Eq. 12).
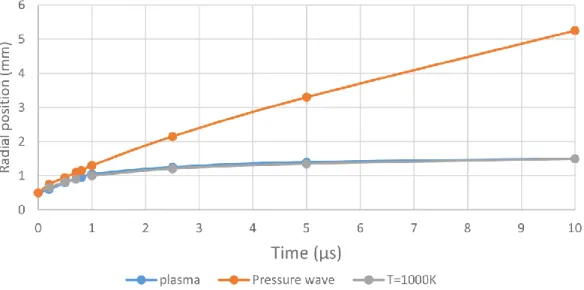
Figure 7: Positions of the pressure wave, of the plasma threshold versus time and of the temperature T=1000K (Case 1)
During the first micro second of the expansion, the plasma threshold and the pressure wave positions are merged. Then the plasma is shaped by the rarefaction wave which follows the shock front. Fresh gas comes along the electrode wall toward the axis changing the shape of the hot plasma kernel. Figures 8 and 9 illustrate this phenomenon respectively at t=10 µs and t=30 s for the case 1. Due to the gas recirculation the plasma takes a toroidal shape.
Figure 8: Streamlines at t=10 µs and vectors velocity (Case 1)
Figure 9: Temperature field at t=30µs (Case 1)
The volume of the toroid is not easy to define , nevertheless according to T. Kravchik et al. [7] we will consider in the following sections that the plasma threshold corresponds to T=1000K.
III – 2: Role of the initial temperature
In order to study the role of the initial temperature, we will focus our study on the cases 1, 2, and 9. For these three cases, the initial radius of the discharge is fixed to 0.5 mm and the initial pressure to 10 bars inside the conducting channel. For cases 1 and 2 the energy contained into the spark channel is 11 mJ and for the case 9 which has the lowest temperature the corresponding energy is 9.6 mJ. We have plotted in the Figure 10 the evolution of the energy contained inside the hot kernel delimited by a temperature value T=1000K. This energy is potentially the energy which could be available to start the flame propagation and to ignite the reactive mixture.
Figure 10: Energy contained in the plasma delimited by the isotherm 1000K versus time for different cases
At t=0 s the initial energy inside the isotherm 1000 K is approximatively the same, then due to the propagation of the shock wave and the expansion of the hot kernel, the energy contained inside the hot kernel decreases due to the diffusion and the convection. Even if the initial energy is the same between cases 1 and 2 the energy transported into the hot kernel is different. This is due to the fact that the thermal conductivity of plasma at 10 kK and 20 kK is different [29]. The energy value is not enough to characterize the channel and must so be associated to one temperature value. The maximum temperature versus time is given Figure 11 for the three cases.
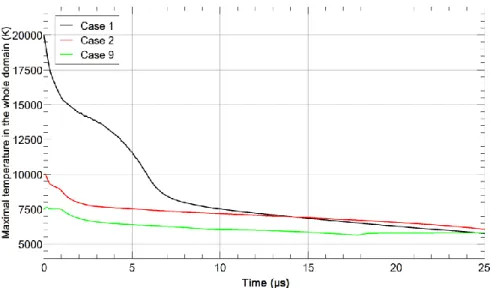
Figure 11 Transient evolution of the maximal temperature in the whole domain
For the three cases the maximum of the temperature converge to the same value after 25s. The energy source term is maximal during 0.7s with a current value equals to 6A. In case of an initial temperature T=20 kK (Case 1) the radiation losses are important leading to an abrupt decrease of the temperature. After 0.7 s the radiation losses still exist but due to the convection effect the plasma channel is constricted between the two electrodes leading to a slowly decrease of the temperature. Nevertheless two effects exist: the losses by radiation and convection. Progressively the high temperature channel is driven to the toroid. The influence of the initial temperature between case 1 and case 2 can be observed up to 10s. For the three cases the maximal temperature reaches T=6 kK after 30s. However the kinetic reactions in a motor chamber act during the first instants and the plasma composition depends directly of the temperatures which are different between the cases.
The initial temperature is an important parameter for the plasma characteristic, it changes the initial energy contained in the channel but also the energy available into the area delimited by the isotherm 1000 K after 30 µs.
III – 3: Role of the initial pressure
The second parameter studied is the initial pressure. We considered the cases 4 to 7 where the only parameter which is changed is the initial pressure. The initial energy contained into the channel for cases 4 to 7 is respectively 1.7mJ (10bar), 0.9mJ (5bar), 5mJ (30bar) and 9.6mJ (60bar). For the four cases the radius of the channel is 200 m and the initial temperature T=10 kK. The case 7 considers an initial pressure six times higher than the case 4 leading to an initial energy 5-6 times higher. The initial pressure is also a crucial parameter, however we have found in the literature different choices of value for the initial pressure by authors referring to the same work (seen Figure 1). The table 2 shows that the deposit of initial energy depends directly of the value of the pressure. The deposit of energy can be deduced experimentally by electrical measurements. Nevertheless in case of comparison with a simulation care is needed as this experimental deposit of energy must be associated with other parameters:
radius, pressure, temperature. This point is confirmed by the transient evolution of the volume corresponding to the part of the hot kernel where the temperature is higher than 1000K (see figure 12).
Figure 12: Transient evolution of the hot kernel volume (T>1000K)
The transient evolution of the gas volume where the temperature is higher than 1000 K is plotted in the Figure 12 for case 4 to case 7. After the first micro seconds where the gas volume is driven by the shock wave, the volume increases slowly mainly due to diffusion. The role of the initial pressure influences directly the first phase of high convection. More the initial pressure is high; more the plasma volume is larger. We can also observe that more the initial pressure is high longer the volume is governed by the convection, retarding the beginning of the diffusive phase. Applying an initial pressure of 60 bars in one channel of 200 m with a temperature T=10 kK leads to one gas volume six to seven times higher than for an initial pressure of 5 bars. This effect of the initial pressure is shown in the Figure 13 on the temperature fields for the four cases at time t=30 s.
Case 5: 5 bars Case 4: 10 bars Figure 13: Temperature fields for several initial channel conditions at t=30µs Initial channel radius and temperature respectively equal to 200m and T=10kK.
We can see in the Figure 13 through the temperature fields that at t=30 s, the volume and the shape of the plasma are different. The value of the initial pressure plays a role on the propagation of the hot gas. For the cases 6 and 7 one part of the hot gas is detached from the central area due to high convection and to the entry of cooler gas.
For the simulation of a transient spark evolution, changing only the initial pressure value in the channel leads to very different results. However the initial pressure and temperature are not always experimentally given and differ from one author to the other.
III – 4: Role of the initial radius
One other parameter necessary for the simulation is the radius of the spark channel. Looking equation 11, we can note that the energy injected is directly linked to the value of the channel radius. Changing the radius from 200 m (Case 4) to 500 m (Case 2) leads to an initial energy from 1.7 mJ to 11mJ. The parametric study on the channel radius can so be linked to the study on the mean temperature of the channel presented section III-2.
IV – Conclusion
In this paper a simulation of the spark discharge after the breakdown phase is realized in an air medium. Using hypothesis on the flow (laminar, thermodynamic equilibrium, sheaths not taken into account) a model based on the fluent software is developed. The aim was to be able to understand the flow behavior, the shock wave propagation and to determine the initial conditions and parameters necessaries for the simulation.
The bibliographic has shown all the difficulty to define the set of initial conditions for the model. Due to a lack in the set of experimental conditions several authors using the same reference complete the set without always taking care to the corresponding initial energy.
Based on one case the flow behavior is presented. At the firsts instants (10s) due to the energy stoked and to the high pressure channel a high convection is observed with the presence of a shock wave. During 10 s, the plasma and the shock wave follow the same expansion. One formulation based on the mass density gradient is proposed to visualize the shock wave position and a good agreement is found with the comparison with the experimental Schlieren method. The determination of the position of the plasma kernel defined by an arbitrary temperature T=1000K is essential. Indeed in case of a coupling with a kinetic model this boundary can be used to locate the position of the reactive species which ignite the combustion.
Without a complete simulation which should be able to describe each phase of the spark-event: pre-breakdown, pre-breakdown, arc and glow phases, the simulation is dependent on the set of experimental conditions which are however difficult to obtain due to small dimensions and the rapid variations of the quantities. For the simulation several quantity are essential: the temperature of the channel, its radius, the pressure in this channel and the corresponding initial energy. Nevertheless care is necessary on the choice of these initial conditions.
Acknowledgement
References
[1] J. B. Heywood, “Internal combustion engine fundamentals”. Mc Graw-Hill Series in Mechanical Engineering, ISBN 0-07-028637-X. Editor A. Duffy and J.M. Morriss. 1988.
[2] http://www.theicct.org/sites/default/files/publications/ICCT_Euro6-VI_briefing_jun2016.pdf Report of Int. Council on Clean Transportation, Prepared by M. Williams and R. Minjares. IVVT 2016
[3] M. Thiele, S. Selle, U. Riedel, J. Warnatz, et U. Maas, « Numerical simulation of spark ignition including ionization », Proc. Combust. Inst., vol. 28, no 1, p. 1177-1185, 2000.
[4] M. Thiele, J. Warnatz, A. Dreizler, S. Lindenmaier, R. Schießl, U. Maas, A. Grant, et P. Ewart, « Spark ignited hydrogen/air mixtures: two dimensional detailed modeling and laser based diagnostics », Combust. Flame, vol. 128, no 1-2, p. 74-87, janv. 2002.
[5] M. Thiele, J. Warnatz, et U. Maas, « Geometrical study of spark ignition in two dimensions », Combust. Theory Model., vol. 4, no 4, p. 413-434, 2000.
[6] C. Zaepffel, « Etude expérimentale et numérique d’une décharge électrique appliquée à l’allumage d’un milieu réactif », Thesis Université d’Orléans, Orléans, 2008.
[7] T. Kravchik, E. Sher, et J. B. Heywood, « From spark ignition to flame initiation », Combust. Sci. Technol., vol. 108, no 1-3, p. 1-30, 1995.
[8] S. P. M. Bane, « Spark ignition : experimental and numerical investigation with application to aviation safety », phd, California Institute of Technology, 2010.
[9] S. P. M. Bane, J. L. Ziegler, et J. E. Shepherd, « Investigation of the effect of electrode geometry on spark ignition », Combust. Flame, vol. 162, no 2, p. 462-469, févr. 2015.
[10] O. Ekici, “Computational study of arc discharges: spark plug and railplug ignitors”. Université du Texas, Austin, 2007.
[11] M. Akram, « Two-dimensional model for spark discharge simulation in air », AIAA J., vol. 34, no 9, p. 1835-1842, sept. 1996.
[12] B. Sforzo, « Post discharge evolution of a spark igniter kernel », Combust. Flame, vol. 162, no 1, 2014.
[13] J. Kim, B. Sforzo, J. Seitzman, et J. Jagoda, « High Energy Spark Discharges for Ignition », in 48th AIAA/ASME/SAE/ASEE Joint Propulsion Conference & Exhibit, American Institute of Aeronautics and Astronautics. [14] S. K. Takao Yuasa, « Effects of energy deposition schedule on minimum ignition energy in spark ignition of methane/air mixtures », Proc. Combust. Inst. - PROC COMBUST INST, vol. 29, no 1, p. 743-750, 2002.
[15] M. K. K. Ishii, « Analysis of ignition mechanism of combustile mixtures by composite sparks », Combust. Flame, vol. 91, no 2, 1992.
[16] H. Y. Jilin Han, « Numerical study on the spark ignition characteristics of a methane-air mixture using detailed chemical kinetics. Effect of equivalence ratio, electrode gap distance, and electrode radius on MIE, quenching distance, and ignition delay », Combust. Flame - COMBUST FLAME, vol. 157, no 7, p. 1414-1421, 2010.
[18] S. Nakaya, K. Hatori, M. Tsue, M. Kono, D. Segawa, et T. Kadota, « A Numerical Study on Early Stage of Flame Kernel Development in Spark Ignition Process for Methane/Air Combustible Mixtures », Trans. Jpn. Soc. Mech. Eng. Ser. B, vol. 73, no 732, p. 1745-1752, 2007.
[19] H. Albrecht, W. H. Bloss, W. Herden, R. Maly, B. Saggau, et E. Wagner, « New Aspects on Spark Ignition », SAE Technical Paper, Warrendale, PA, SAE Technical Paper 770853, févr. 1977.
[20] Maly, R. « Spark Ignition: Its Physics and Effect on the Internal Combustion Process » Chapter 3. Fuel Economy in Road Vehicles Powered By Spark Ignition Engines. s.l. : Plenum Press, 1984.
[21] R. Maly et M. Vogel, « Initiation and propagation of flame fronts in lean CH4-air mixtures by the three modes of the ignition spark », Symp. Int. Combust., vol. 17, no 1, p. 821-831, 1979.
[22] R. Maly, « Ignition model for spark discharges and the early phase of flame front growth », Symp. Int. Combust., vol. 18, no 1, p. 1747-1754, 1981.
[23] G. F. W. Ziegler, E. P. Wagner, et R. R. Maly, « Ignition of lean methane-air mixtures by high pressure glow and ARC discharges », Symp. Int. Combust., vol. 20, no 1, p. 1817-1824, 1985.
[24] A. Borghese, A. D’Alessio, M. Diana, et C. Venitozzi, « Development of hot nitrogen kernel, produced by a very fast spark discharge », Symp. Int. Combust., vol. 22, no 1, p. 1651-1659, 1989.
[25] J.C. Hilliard and G.S. Springer, « Fuel Economy: In road vehicles powered by Spark ignition engines», Chap3, Springer, ISBN 978-1-4899-2277-9, OSTI identifier 6990080, 1984.
[26] Y. Naghizadeh-Kashani, Y. Cressault, et A. Gleizes, « Net emission coefficient of air thermal plasmas», J. Phys. Appl. Phys., vol. 35, no 22, p. 2925, 2002.
[27] M. Benmouffok. « Caractérisation théorique du plasma lors de l’application d’un courant impulsionnel : application à l’allumage des moteurs ». Université Paul Sabatier - Toulouse III, 2016. Français. HAL Id: tel-01581365. https://tel.archives-ouvertes.fr/tel-01581365
[28] Da Xu. «Thermal and hydrodynamic effects of nanosecond discharges in air and application to plasma-assisted combustion». Ecole Centrale Paris, 2013. English.
HAL Id: tel-00978527. https://tel.archives-ouvertes.fr/tel-00978527
[29] A. Gleizes, J. J. Gonzalez, et P. Freton, « Thermal plasma modelling », J. Phys. Appl. Phys., vol. 38, no 9, p. R153, mai 2005.
![Figure 1: Several sets of initial conditions used by authors from the literature [6-10]](https://thumb-eu.123doks.com/thumbv2/123doknet/14372478.504586/4.918.262.711.110.635/figure-sets-initial-conditions-used-authors-literature.webp)