HAL Id: halshs-00586765
https://halshs.archives-ouvertes.fr/halshs-00586765
Preprint submitted on 18 Apr 2011HAL is a multi-disciplinary open access
archive for the deposit and dissemination of sci-entific research documents, whether they are pub-lished or not. The documents may come from teaching and research institutions in France or abroad, or from public or private research centers.
L’archive ouverte pluridisciplinaire HAL, est destinée au dépôt et à la diffusion de documents scientifiques de niveau recherche, publiés ou non, émanant des établissements d’enseignement et de recherche français ou étrangers, des laboratoires publics ou privés.
index for the Paris Stock-Exchange (1854-2007)
David Le Bris, Pierre-Cyrille Hautcoeur
To cite this version:
David Le Bris, Pierre-Cyrille Hautcoeur. A challenge to triumphant optimists? A blue chips index for the Paris Stock-Exchange (1854-2007). 2009. �halshs-00586765�
WORKING PAPER N° 2008 - 21
A challenge to triumphant optimists?
A blue chips index for the Paris Stock-Exchange (1854-2007)
David Le Bris
Pierre-Cyrille Hautcœur
JEL Codes: G1, G12, N23, N24
Keywords: Paris Stock-Exchange, stock index, survivor
bias, sample bias, weighting problems, stock return, long
term performances, equity premium, gold, 19
thcentury,
20
thcentury
P
ARIS-JOURDANS
CIENCESE
CONOMIQUESL
ABORATOIRE D’E
CONOMIEA
PPLIQUÉE-
INRA48,BD JOURDAN –E.N.S.–75014PARIS TÉL. :33(0)143136300 – FAX :33(0)143136310
www.pse.ens.fr
CENTRE NATIONAL DE LA RECHERCHE SCIENTIFIQUE –ÉCOLE DES HAUTES ÉTUDES EN SCIENCES SOCIALES
1
A Challenge to Triumphant Optimists ?
A Blue Chips Index for the Paris Stock-Exchange (1854-2007)
David Le Bris Pierre-Cyrille Hautcœur
Université Paris Sorbonne Paris School of Economics – EHESS1
This version: November 2009
Abstract
We analyze a new blue chips (large caps) stock index for France from 1854 to 1998. We detail its methodology and show that it differs profoundly from earlier indices, and that it is more consistent with the French financial and economic history. We suggest this result casts some doubt on many historical stock indices such as those gathered in Dimson, Marsh and Staunton’ Triumph of the
Optimists. We also provide some major results: investment in French stocks provided a positive real
return during the 19th century, but a negative one – because of inflation and wars – in the 20th. Despite this century of negative real performance, stocks are still the best financial asset for the very long run but, with an equity premium lower than in the US.
Most empirical knowledge on the long term performance of financial investments is derived from the behaviour of the most successful markets. Those of the United States – and more broadly Anglo-Saxon countries – have been termed survivor markets2. The United States, in particular, suffered no war on their national territory in more than a century, limited inflation and no true socialism. They
1
We thank Elroy Dimson for the index published in his book, E. Dimson, Georges Gallais-Hamonno, François Gourio, Bruce Lehmann, Kim Oosterlink, Christian Rietsch, Eugene White and two anonymous referees for detailed and useful comments, as well as participants at seminars in Orléans and Paris, at the World Cliometrics conference (Edinburgh), the European Business History Conference (Bergen) and the 25th European Symposium on Money and Banking (Luxembourg).
2
S.J. Brown, W. N. Goetzmann and S. A. Ross. “Survival”, The Journal of Finance, 50, no. 3 (1995): 853-73.
2
developed modern financial theory and empirical studies earlier, so that their performance influences heavily what we think today about financial markets. Much of the rest of the world was not so fortunate. The Russian stock-exchanges and securities, which were thriving before World War One3, disappeared for 70 years. Clearly, the fate of investors in Russian securities from 1917 to 1992 can be understood without portfolio indices. But Russian stocks and bonds were part of many foreign portfolios (not least French ones) up until the Soviet Revolution, so that global performance must take them into account for a global measure. The same is true for other markets such as those of Austria-Hungary or even China. In between happy Americans and poor Russians, most of Western Europe’s stock exchanges suffered a chaotic 20th century, but without complete disruption (Germany being the limit because of the 1923 hyperinflation and the post-1945 dismantlement). Recent research has tried to broaden the sample of markets studied to include them, with much reason since many of them were among the worlds’ most developed up until World War One or even during the interwar period (Brussels, Amsterdam, Paris, Berlin, Milan, etc), and they again weigh substantially in today’s global portfolio. The 2002 synthesis by Dimson, Marsh and Staunton proposes data on the 20th century for 16 countries, and ends up with an optimistic tone, although less enthusiastic than most of the literature on the US case4. They show that with the exception of Sweden, Western European exchanges perform worse on average than those of overseas Anglo-Saxon countries (Canada, the U.S., Australia and South-Africa) and the U.K.5. They attribute the poorer Italian, French, German or Belgian performances to the wars, inflation and nationalizations. But their data suggests that even in the worst
3
On Russia, see P.V. Lizunov, “Russian Securities in the Russian and European Stock Exchanges (end of the 19th - beginning of the 20th century)”, in: Ekonomicheskaja istorija. Ezhegodnik (Economic History.
Yearbook). 2001, Moscow: Rosspen, 2002: 206-241; and, L. Borodkin and A. Konovalova, “Chaotic
Dynamics of Share Prices at St. Petersburg Stock Market in the First Decade of the 20th century: Metal and Oil”, Working Paper presented at the XVth Conference of the international association for history and computing, 2003.
4
E. Dimson, P. Marsh and M. Staunton, Triumph of the Optimists: 101 Years of Global Investment
Returns (Princeton, 2002).
5
Dimson & al. Triumph of the Optimists, p. 50. On Sweden, P. Frennberg and B. Hansson. “Computation of a Monthly Index for Swedish Stocks Returns, 1919-1989” Scandinavian Economic History, 40, no. 1 (1992): 3-27.
3
case – Belgium – the long-term stock market performance remains positive (2.5 per cent yearly real return over the 20th century), and superior to that of other investments.
In this paper, we claim that a more detailed look at the methodology used in constructing stock market indices is required before any valid international comparison. Concentrating on the French case, we show that formerly accepted indices built on particular sets of assumptions can seriously mislead empirical finance research. If the theory and practice of indices has long been mastered by economists and statistical institutions (a 1922 book by Irving Fisher being still a major reference6), stock market indices have been built in many countries up until recently with different objectives than the measure of the return for the investor7. The Cowles commission in the 1930s was a pioneer in using indices in order to measure stock market performance from the point of view of an investor8. In spite of this, even the Standard & Poor’s index suffers serious flaws9. In France, the only early attempt to build indices in that same perspective, that of the newspaper Agefi in the 1930s, was short lived.
In this paper, we propose a new stock index for the French stock market from 1854 to 1998, the first one built in order to measure variations in French stock prices from the point of view of the investor. We first describe the index’s methodology, which is based on Euronext’s CAC-40, adapting it slightly to take into account some constraints from historical research. Basically, the index is a monthly index of the 40 most prominent shares among French firms, ranked by market capitalization. Since the selection is adapted every year, we avoid survivor bias. Our index is weighted by these capitalizations and its composition and weights are adjusted yearly. These characteristics, which are standard for
6
I. Fisher, The Making of Index Numbers. A Study of their Varieties, Tests, and Reliability (New York, 1922).
7
W. Goetzmann “Will History Rhyme? The Past as financial Future”, WP Yale ICF no. 04-19, 2004; P.-C. Hautcoeur “Why and How to Measure Stock Market Fluctuations? The Early History of Stock Market Indices, with Special Reference to the French Case ”, Working paper 2006 no. 10, Paris School of Economics.
8
A. A. Cowles and co-authors. Common-Stock Indexes (Bloomington, 1938).
9
J. Wilson and C. Jones, “An Analysis of the S&P 500 Index and Cowles’s Extensions: Price Indexes and Stock Returns, 1870–1999”, Journal of Business, (2002), 75 n°3, pp. 505-33. For a better index than the Cowles one, see W. Goetzmann, R. Ibbotson and C. Peng. “A New Historical Database for the NYSE 1815 to 1925: Performance and Predictability”, The Journal of Financial Markets, 4, no. 1 (2000), pp. 1-32.
4
today’s indices, were frequently not present in older indices, which may explain a significant difference in their outcomes.
The first major result of this article is to provide new estimates of the long term returns that holders of such a portfolio of French stocks obtained. We show that the price index (without dividends) didn’t protect its owners against inflation. Its real performance was positive up until 1914 (in a period of stable prices) but it was substantially negative for the 20th century in spite of the rapid growth of stock prices since the 1980s.
When one turns to total return (including the dividend yield, supposedly tax-exempted), the performance is substantial from 1854 to1914 (more than 5 per cent yearly total return net of inflation), but very low for the 20th century as a whole. Since 1914, gold has proved to be a better investment than stocks.
These results contrast strongly with those of Arbulu and Gallais-Hamonno, who link the official 20th century indices to similarly constructed new indices for the 19th century and form the basis for French investment performance in the Dimson-Marsh-Staunton synthesis10. We show that the reason for the divergence rests on the methodology adopted by Arbulu and the official indices, which suffer both survivor bias and weighting problems. In particular, they don’t weigh the stocks by capitalization, consequently giving much higher implicit weights to small caps, leading to a seriously overvalued index in the long run.
Contrasting with the well-known results for the US, the low equity premium that we observe in France is in line with most models of risk aversion11. We then suggest that if our revisionist approach of French indices can be extended to other European markets, the equity premium puzzle may disappear
10
P. Arbulu, Le marché parisien des actions au XIXème siècle : performance et efficience d’un marché
émergent, unpublished Ph.D. thesis, (University of Orléans, 1998) ; G. Gallais-Hamonno and P. Arbulu.
“La rentabilité réelle des actifs boursiers de 1950 à 1992”, Economie et Statistique, no. 281 (1995) pp. 3-30.
11
For the US, see for example R.R. Ibbotson and R. A. Sinquefield. “Stocks, Bonds, Bills and Inflation: Simulations of the Future 1976-2000”, Journal of Business, 49, no. 3 (1976), pp. 11-47; or J. Siegel, “The Equity Premium: Stock and Bond Returns since 1802”, Financial Analysts Journal, 48; no.1 (1992), pp. 28-38.
5
in many of the cases discussed for example by Barro, and end up (as some earlier studies already argued) as a mostly US phenomenon12.
Finally, we argue that the evolution of the CAC-40 in the twentieth century can be understood as the result of the wars and the inflationary periods, suggesting that the impact of major wars on private wealth has been underestimated up until now. The first section presents in detail the methodology of our index. Differences between earlier indices and ours are discussed and some robustness checks made in the next one. We then present the main results and the main changes in policy regimes that may explain the index performance in the long run, and conclude.
12
R.J. Barro, "Rare Disasters and Assets Markets in the Twentieth Century”, The Quarterly Journal of
6
I METHODOLOGY: A WEIGHTED BLUE CHIPS INDEX ALONG THE LINES OF THE CAC40
The aim of this section is to detail the methodology we used to build the new index. In the very long run, even details matter, since any error is magnified by the effect of compounded interest. The index concentrates on stocks of French firms; not because French investors held only French stocks (they actually held many foreign ones, especially up until World War One13), but because focusing on national securities is the first step generally used before considering the effects of international diversification, which could be measured using various foreign indices.
The procedure we use can be summarized as follows. The prices, dividends and number of shares are collected for all French stocks listed on the Paris official stock exchange for the first Friday of each year. Capitalizations are calculated for that date. We then take the 40 highest capitalizations for inclusion in the index for the following year, with two exceptions: when various securities of the same firm are listed, we only consider the one with the highest capitalization; we also exclude firms with less than 10.000 shares. For the 40 firms in the index, we gather monthly prices and calculate the market index by weighting these prices with market capitalizations, in order to make it reflect the actual market)14.
We chose to build a blue chips index because the most important shares it includes are precisely those held by most investors15. Small firms were usually heavily dominated by family owners as in most continental Europe16; their shares were sometimes listed in spite of being closely held because no constraint on minimum free float existed. This led these stocks to be illiquid, which was a major
13
Ch.-A. Michalet, Les placements des épargnants français de 1815 à nos jours (Paris, 1968).
14
Free float would in theory be a superior alternative, but the amount of the free float cannot be reconstituted until that information started to be published in 2003 for Euronext’s CAC40.
15
A. Daumard (ed.) Les fortunes privées au XIXe siècle, Paris, Mouton, 1973, provides information on
portfolios held at death.
16
See e.g. F. Barça and M. Becht (eds), The Control of Corporate Europe (Oxford, 2001); or A. D. Chandler, Scale and Scope, the Dynamics of Industrial Capitalism (Cambridge, Ma., 1990). British corporations may have had a more diversified ownership, see J. Franks, C. Mayer and St. Rossi, “Ownership: Evolution and Regulation”, Review of Financial Studies, 22 (October 2009), pp. 4009-4056.
7
concern for ordinary investors (and led financial advisors to recommend avoiding them17). Family control could also lead to agency problems and price manipulation, also threatening ordinary investors. Furthermore, both low liquidity and price deviations are also a problem for the building of an index and its interpretation18. So the restriction to blue chips should help our index to represent the behaviour of investors better19 and to avoid including significant liquidity or risk premia, so that the long term decline in returns could not be misinterpreted20. These reasons explain the dominance of blue chips indices in financial analysis today.
Our index concentrates on French firms, which are defined by their legal status, not by the place they have their activity: the Suez and the first Panama canals are French firms. So are French subsidiaries of foreign firms such as Thomson-Houston. We consider for inclusion firms listed on all French exchanges. In practice, almost all blue chips listed on the official Paris Bourse, but there were a few exceptions, such as some Northern France coal mines that listed in Lille up to the early 1920s.
Diversification is usually considered as sufficient to eliminate specific risk when the number of stocks in a portfolio reaches thirty21. For an index weighted by stock market capitalizations, a somewhat higher number is better. We chose forty stocks in order to satisfy these requirements and to facilitate the linkage with today’s CAC 40, the major Euronext-Paris index. It might be argued that the number of stocks included should increase with time and the development of the stock market. Actually, the Paris stock exchange was well developed (in terms for example of market capitalization to GDP) quite
17
P. Leroy-Beaulieu, L'art de placer et gérer sa fortune (Paris, 1906).
18
E. Dimson and P. Marsh. “The Stability of UK Risk Measures and the Problem of Thin Trading”
Journal of Finance, 38, no. 3 (1983), pp. 753-83.
19
A recent study of the individual accounts at a US stock broker in the 1990s finds an average portfolio of only four stocks, see B. Barber and T. Odean, “Trading Is Hazardous to Your Wealth: The Common Stock Investment Performance of Individual Investors”, Journal of Finance, vol.55, n°2 (2000), pp. 773-806.
20
A. Ben-Rephael, O. Kadan, and A. Wohl. “The Diminishing Liquidity Premium”, Working paper presented to the NBER workshop on financial microstructures, 2008.
21
M. Statman, “How many stocks make a diversified portfolio”, Journal of Financial and Quantitative
8
early, and suffered a decline during the 20th century from which it recovered only in the last 30 years22: as shown in Table 1, the proportion of our 40 firms in total market capitalization varied a lot, and with only a weak declining trend. It has also always been very high. These reasons – and the search for simplicity – led us to hold constant the number of firms in our index.
TABLE 1 AROUND HERE
The list of the stocks included in the index is fixed following a stable, simple and transparent formula in order to avoid ex-post insight. This requires us to avoid today’s practice of choosing the stocks composing the CAC-40 among the 100 biggest capitalizations listed in Euronext-Paris, with the help of a scientific committee that we cannot reinvent for previous periods. We therefore include more simply the 40 stocks with the biggest capitalizations, and we rebalance the portfolio each year at the beginning of the year. The yearly rebalancing of the portfolio allows us to eliminate the survivor bias that affects many retrospective studies of stock prices. This is all the more important since a number of major firms failed during the period under study, and should not be excluded23.
We added two minor criteria to the capitalization for the selection of stocks included in the index. The first one is a liquidity criterion: we decided to exclude from the index all firms with less than 10,000 shares. The reasons for this choice can be traced to the functioning of the 19th Paris Bourse, which sometimes listed stocks without wondering about the potential for an active market24. This was the case for some firms with a very small number of shares, especially insurance companies whose statutes frequently even required the agreement of their Board for any stock transaction to be valid. We chose a low number, as 10,000 corresponds to one fourth of the average number of shares of all the firms listed on the market in 1853, the last year for which the number of firms satisfying the requirements for inclusion in the index is below 40 (the reason we start the index in 1854). In any
22
R. Rajan and L. Zingales. “The Great Reversal: the Politics of Financial Development in the 20th Century”, Journal of Financial Economics, 69, no.1 (2003), pp. 5-50.
23
Early cases are Crédit mobilier (1867), Union Générale (1882), Comptoir d’Escompte de Paris, Société Industrielle des Métaux and the Panama canal (1889). More recent “quasi-bankruptcies” are Eurotunnel, Eurodisneyland, or Crédit Foncier de France.
24
P.-C. Hautcoeur, (ed.), Le marché financier français au 19e siècle, Récit, (Paris, 2007); see A. Courtois, Des opérations de bourse, (Paris, 1855), for an early and frequently reprinted publication on listed firms.
9
case, that liquidity constraint only excludes a small number of firms and only during a short period, so that it cannot significantly affect the long term performance of the index25.
Our last criterion is the limitation to one category of stock per firm for inclusion in the index. Firms frequently had various categories of shares, especially in the 19th century: preference shares were less widespread than in the U.S., but the relationship between ordinary and other shares was sometime similar to that between ordinary and preference shares in the US. For example, actions de jouissance (enjoyment shares) were shares whose nominal value had been reimbursed (something frequent in the period, and even statutory in many firms whose activity depended on terminable concessions from the government, typically in railroads, electricity distribution and other utilities); this gave them no right to the “interest” part of the dividend on ordinary shares (usually 5 per cent of the nominal value), but a right to the “superdividend” above that “interest”. Parts de fondateurs (founders’ shares) were special shares, which were usually given to the firms’ founders and gave them a right to a fixed portion of the total payments of “superdividend” to all other shareholders. Shares with multiple votes became frequent in the 1920s and were prohibited by law at the end of that decade26. Since the rights to dividends of these various shares differ, their prices don’t move identically (the prices of founders’ shares and enjoyment shares are more volatile). Usually, founders’ shares are quite closely held and would not qualify for the previous criteria; enjoyment shares increase in numbers and can become dominant in the long run for some firms.
W
e measure the capitalization of each category and include in the index only the one with the highest capitalization (which proves to be almost always the ordinary shares). Another solution would be to add-up the various categories into a single one or to include all categories satisfying the previous criteria. We decided on our rule for three reasons. Firstly, it is used today by Euronext for the25
The only well-known firm that is excluded during a period because of that requirement is Saint Gobain, which is number 34 by capitalization in 1858 (a rank that increases later) but with only 4,364 shares (each priced at 33,000 francs, or some 100,000 euros in today’s money). One insurance company excluded up until the 1860s is Assurances Nationales Incendie (only 2,000 shares,).
26
For more details, see P.-C. Hautcoeur, “Asymétries d'information, coûts de mandat et financement des entreprises françaises (1890-1936)”, Revue Economique, 50, no. 5 (1999), pp. 1053-87.
10
calculation of the CAC-4027. Secondly, the addition of all categories into a single capitalization would create biases, since the rights on the profits of the various shares were usually different, as were their risks, justifying differences in prices and in price variations among them. Lastly, our rule is likely to reflect the behaviour of investors, who probably, and with good reason, did not consider the holding of different securities in the same firm as useful diversification. In any case, this rule mostly affects a few railroads’ actions de jouissance in the 19th century, and the Suez Canal in the interwar period. The year most affected is 1936, in which the activity and share price of the Canal were recovering while the French market suffered overall decline. During that year, not only were the ordinary shares of the Canal the first (by far) capitalization of the Paris Bourse, but its other shares represented more than the second and the third capitalizations put together (Table 2). Nevertheless, giving the Suez canal a weight in the index similar to that of all its shares in the capitalization would probably make the index too dependent on a single firm (at the peak, its ordinary shares represented 22.93 per cent of the CAC, and the total of its shares as much as 32.02 per cent).28
TABLE 2 AROUND HERE
The prices used for the index are all transaction prices. On the Paris stock exchange, prices were set up until 1986 thanks to Walras-style auctioneers who gathered demands and offers for every stock and determined an equilibrium price (the fixing price) in a centralized manner at a fixed moment in the morning. Other prices could be quoted later in the day if transactions were sufficiently important. We chose to use the last price of the day for our index because some of the periodicals we used only mentioned that price.
The index is calculated using various periodicals, among which the most important is the official list price of the Paris Bourse, the Cote Officielle. We use a few other journals in order to complete for missing issues, incomplete data and for the shares that were not traded on the official market but on
27
The very existence of this rule probably modifies the behaviour of today’s firms, making them eliminate special shares to improve the likelihood of access to the CAC-40 and the visibility that would give them. This was not the case in the past, but we still prefer to maintain that rule for the sake of continuity.
28
Furthermore, this exclusion balances the fact than 40 per cent of the capital of Suez was owned by the British government and thus, not free float.
11
the unofficial Coulisse29 or on provincial exchanges instead. The first step was to collect for the first
Friday of every January the name, last price, nominal value, paid value, number of shares and dividends for every share mentioned in our sources (a number which varied from 100 to more than 600 during our period30). This first collection allowed us to calculate the capitalization of all important listed shares, and then to select the 40 most important ones. The second step consisted in collecting monthly prices for these 40 stocks for the first Friday of each month31.
Within each year, our index is calculated using individual stock prices weighted by their capitalization, from January to January. Monthly returns are calculated as :
Where the numbers of shares are constant within each year.
Components are modified every January, using the new capitalization data and each year’s index is chained to the next one using January’s value as a basis. This index is based on the value of the official CAC-40 index when it was created on December 31st, 1987, which was taken as 1000.
Some technical choices were made, which we believe have no lasting impact on the level of the index. First, when a price was missing, the previous listed price was used. This happens rather frequently in the 19th century when repeated prices represent almost 16 per cent of the total, compared to only 4.5 per cent after 1914. Nevertheless, the impact should be limited because missing prices concerned mostly the smallest stocks in the sample (they represent only 2.6 per cent of the prices of the biggest
29
The Coulisse, or “marché en banque” was developed outside the regulated Bourse during the 19th
century. It was partly legalized from 1893 on. See P.-C. Hautcoeur and A. Riva, “The Paris Financial Market in the 19th Century : An Efficient Multi-Polar Organization ?”,Working Paper, 2007 no.31, Paris School of Economics and E. Pollin,“La Coulisse”, in Gallais-Hamonno, Georges (ed.), Le marché
financier français au 19e siècle, Aspects quantitatifs des acteurs et des instruments à la Bourse de Paris,
(Paris, 2007).
30
These counts may not be exhaustive since some more shares could be traded on the Coulisse, provincial Bourses or OTC markets without being mentioned in journals, but they were marginal and could not modify our results, in particular the list of the forty major stocks.
31
Friday was chosen because it does not correspond to settlement periods (forward operations were settled every 15 days or every month depending on the moment during our period), and because weekly periodicals, usually published on Saturday, gave Friday prices.
12
capitalization in the index, compared to 16.4 per cent for the smallest). The ten biggest capitalizations, which weigh 61 per cent of the index on average, have only 3.88 per cent missing prices. Although one may consider these proportions as high, they are standard in historical finance (e.g. Goetzman & al. 2000), and they actually are a major reason for calculating blue chip indices rather than comprehensive ones. Most importantly, we don’t think that our choice has any impact on our index’s long term performance.
Second choice: although the precise date at which dividends are paid have a short term impact on equity prices payments, we don’t adjust prices for that effect. First, because precise payments’ dates are frequently not mentioned in our sources. Second, most importantly, because our aim is to measure long term changes in prices, which are certainly not affected. For the same reason, we make no adjustment for capital changes (except for stock splits, for which prices were adjusted) or for firms appearing or disappearing during the year (IPOs, mergers, nationalisations, bankruptcies). Firms appearing during the year and big enough to be admitted in the CAC-40 are included the next January. Firms disappearing are maintained up to the next January with the last price being used all months to that date (these repeated prices are included in those mentioned above). All these assumptions artificially weakly decrease the within-year volatility, but don’t affect year to year changes in the index (at least as suggested by a check on the 1987-1997 period discussed in more detail below). Furthermore, these choices affect a limited number of prices, making it unlikely that the index is significantly modified.
That methodology is the one followed in order to build the pure price index. From the same sources we compute the return from dividends at the beginning of each year, which is added to the price index in order to build an index for total return. Below, whenever an index is mentioned without mention of dividends or total return, we mean the pure price index.
II COMPARISON TO PREVIOUS INDICES AND ROBUSTNESS CHECKS
13
Figure 1 compares our index to the main existing indices which are usually linked to cover the whole period32, and which we jointly call the Arbulu-SGF-INSEE index, with a common basis in 1854=108. Table 3 provides evidence that these differences were statistically significant for the periods covered by the three different authors. The discrepancies are enormous, but also surprisingly easy to explain.
FIGURE 1 AND TABLE 3 AROUND HERE
The Arbulu-SGF-INSEE index links an index built by Arbulu for the 1802-1913 period to those built at the time by Statistique Générale de la France (SGF), the official statistical office, and later by its successor INSEE. This index – or part of it – has been used by all recent studies on the long run performance of the Paris stock exchange, mostly due to lack of alternatives and because of the inclusion of its most official parts in official publications33.
The index built by SGF in the interwar period – as well as those of many other statistical institutions at the time – did not aim to measure the performance of a portfolio of stocks but rather to observe or anticipate fluctuations in macroeconomic activity34. For that reason, it did not focus on long term level change. In order not to miss any impending crisis or recovery, industry indices included as many firms as possible, all of them on an equal basis since they all could equally signal down- or upturns. The aggregate index was weighted by industry capitalization but was based on these un-weighted industry
32
P-C Hautcoeur and M. Petit. “The Development of the Paris Bourse in the Interwar Period What Old and New Stock Indices tell us”, Working paper Delta 2004 no.18; M. Petit, “Inventaire des séries de données historiques du projet Old Paris Stock Exchange 1919-1939”, Economies et Sociétés, 40, no. 8 (2006): 1089-119, provide an original index for the interwar period, with a methodology similar to ours. It includes 30 blue chips, with a slightly more conservative selection procedure since shares are chosen only if they remain at least 4 years among the biggest capitalizations of the Bourse. This may explain why it features somewhat more fluctuations.
33
Gallais-Hamonno and Arbulu, “Rentabilité réelle”; P. Jorion and W. Goetzmann. “Global Stock Market in the 20th Century”, The Journal of Finance 54; no. 3 (1999), pp. 953-80; Dimson & alii, Triumph of
the Optimists; Société des Nations. Annuaire statistique de la société des nations (Geneva, 1939).
34
14
indices. This method was maintained with little change by INSEE after 194535. It was also the method used retrospectively by Arbulu36.
The upward bias stemming from broad un-weighted indices can be enormous, as one example will show. In 1963, Rhône-Poulenc was the most important French listed firm, with a market capitalization of 5.21 billion francs, or 4.6 per cent of a total market capitalization of 112 billion37. Within our CAC-40 index, Rhône-Poulenc’s weight is 10.35 per cent, since the total capitalization of the CAC-40 first shares is 50 billion. In the SGF-INSEE methodology, Rhône-Poulenc is one among 22 firms in the Produits chimiques, électro-métallurgie et verreries group (mostly chemicals), whose weight is 15.6 per cent in the official index. The impact of Rhône-Poulenc shares is then 15.6/22 or 0.71 per cent, compared to its 10.35 per cent in our index. At the other end of the spectrum, Cotelle et Foucher – Javel La Croix, a chemicals firm with a capitalization of 74 million francs (or 0.066 per cent of the market, 70 times less than Rhône-Poulenc) also weighed 0.71 per cent in the index. Table 4 provides a measure for the chemicals industry in 1963 of the discrepancies between the weights in the index and those in the capitalization, showing that the overrepresentation of small firms was a general phenomenon, and one that could affect the index enormously. If, as we now know, the performance of smaller firms is on average superior to that of bigger ones, this overrepresentation of small firms creates an upward bias in the index38. For example, if the average difference in performance between firms included in our CAC-40 and the others is 1 per cent a year, and the CAC-40 includes only a tenth of the firms included in the SGF-INSEE index, that index should outperform the CAC-40 by almost 1 per cent a year.
TABLE 4 AROUND HERE
35
INSEE (Institut national de la statistique et des études économiques). Etudes Statistiques, Supplément
trimestriel du Bulletin Mensuel de Statistique, (Paris, PUF), January-March 1963.
36
Arbulu, Marché parisien des actions, 1998, p. 132; P. Arbulu, P. « le marché parisien des actions au
XIXe siècle », in Georges Gallais-Hamonno (ed.), Le marché financier français au XIXe siècle, aspects
quantitatifs (Paris, 2007), pp. 365-457, p. 424.
37
INSEE, Etudes Statistiques, p. 79.
38
E. Fama, and K. R. French. “The Cross-Section of Expected Stock Returns”, The Journal of Finance, 47, no. 2 (1992), pp. 427-65; J. Hamon and B. Jacquillat. Le marché français des actions, (Paris, 1992).
15
Other choices also cause substantial biases in the existing index. Arbulu’s calculations suffer substantial survivor bias, since he chooses the shares to be included partly on the basis of their stability, more precisely he eliminates all shares which didn’t remain listed at least five years, which makes him omit the Union générale (6th capitalization by size in 1882, 5.51 per cent of our CAC-40, failed in 1882) or the Panama canal (9th capitalization in 1884, also soon failed), and the substantial downward impact of their failure on contemporary portfolios and attitudes towards stock investment39. A major flaw of the official indices built by INSEE after SGF is their treatment of nationalizations. Nationalized firms are excluded ex-post. They represented an enormous proportion of listed firms and even more of our CAC-40, since they included all the railroads in 1937, and all the electricity, gas, coal, bank and insurance industries in 1945. We could not find details on how the SGF calculated the impact of 1936-37 nationalizations. Concerning the 1944-45 nationalizations, which represented 28 per cent of early 1939 CAC-40 capitalization, the official index excludes the firms concerned from 1939 on40, which leads to a important divergence between that index and one that would include them, as reported by INSEE insiders somewhat later41 (table 5).
TABLE 5 AROUND HERE
In our own index, we treat nationalizations using the same rules as for other firms exiting the index. When a firm is nationalized and stops being listed, we retain the last quoted prices for the rest of the year and don’t try to introduce non-market prices (such as the compensations paid by the government). The main banks are nationalized by the law of December 2, 1945, with application on January 1st, 1946; as a result there are no missing prices. In the gas and electricity industries, only one firm still belonged to our index in January 1946, in spite of the fact that the nationalization project was only presented in March 1946. This suggests that the market clearly anticipated these nationalizations, which were mentioned in the program of the Conseil National de la Résistance of March, 1944. The nationalization of coal mines was announced on December 14th, 1944 (with no details on
39
On the psychological traits and consequences of the 1882 crash, see E. Zola, L’Argent (Paris, 1891).
40
INSEE, Le mouvement économique en France de 1938 à 1948 (Paris, 1950), p. 162.
41
P. Laforest and P. Sallee. “Le pouvoir d’achat des actions, des obligations et de l’or”, Economie et
16
compensations); their stocks remained listed in 1945 but their prices decreased quickly, so that none belonged to the CAC-40 in January, 1945. Finally, no insurance firm was large enough to enter the CAC-40. Nationalized firms then disappeared progressively from the CAC-40 as they disappeared from the portfolios of investors, who turned to other stocks. Our methodology mimics that behaviour just by maintaining consistently its own rules. It is likely that it underestimates the negative impact of nationalizations on the portfolios of their holders since in some cases, the government blocked the shareholders’ investments during a long (highly inflationary) period before they obtained compensation that could be sold and reinvested in other shares, when we assume this was done at the end of the year when the last price was quoted.
Unsurprisingly, that period is the one with most divergences between our CAC-40 and the official index.
We conclude that the methodology of the existing Arbulu-SGF-INSEE index makes it greatly inadequate in order to measure the actual performance that could be obtained by investors, and that using it in that purpose would lead to a severe overestimation of that performance42. We synthesize them in table 6.
TABLE 6 AROUND HERE
Robustness checks
Given the enormous difference between the traditional index and ours, one might reasonably ask for more robustness checks than just identifying the biases in the older index. A direct way to validate our own methodology is to compare it to the true CAC-40. We did so for the first decade of its existence (1987-97). Both indices are highly correlated, as can be seen in Figure 2.
FIGURE 2 AROUND HERE
Nevertheless, our own index performs slightly worse than Euronext’s (7.5 percent less growth over 10 years, compared to a global rise of 185 per cent, or a 4 per cent difference). This difference is statistically not significant: tests do not reject the hypothesis of identical means, variances, skewness,
42
A comparison of the performances of our CAC-40 and the SGF-INSEE-Arbulu index shows that the latter significantly over-performed the former in all decades but one since 1854.
17
kurtosis or distribution43. If it were, it would probably result from the choices in Euronext’s selection method, that allowed smaller or more dynamic firms to be included, compared to our automatic selection method. In any case, that divergence is small compared to the one we observed between the Arbulu-SGF-INSEE index and our own.
We also use this period to distinguish the consequences of our selection method (strictly 40 first capitalizations) and our simplifying assumptions (rebalancing of the selection only once a year, no treatment within the year of mergers, nationalization or failure, little correction for some capital modifications). For that purpose, we calculate another index, CAC3, which is composed as the authentic one at the start of each year, but not recomposed during the year, and to which we apply our simplifying assumptions.
TABLE 7 AROUND HERE
Table 7 shows that – contrary to our index – this index performs better than the authentic CAC-40, suggesting that sample selection is the major cause of the negative difference between our index and the official one, and that our simplifying technical assumptions per se would more probably bias the index upward – if there is a bias. This would then mainly reinforce our conclusions.
The official CAC-40 also presents an assumption that we did not apply to our historical reconstruction: it imposes a 15 per cent maximum on the weight of any stock. Our historical data (Figure 3) show that the share of the biggest firm (even when restricted to its most important share, as described above) varies heavily, and that this 15 per cent ceiling was bypassed in 21 years of our sample. But recalculating our index with a 15 per cent ceiling showed no significant impact. Since such an assumption has little theoretical support, we preferred to retain our unlimited index.
FIGURE 3 AROUND HERE
Another robustness check considers the impact of the number of stocks included in the index. As we explained above, we chose a blue chips index in order to correspond to the behaviour of most investors
43
Formal tests of the official CAC-40 and ours being identical between 1988 and 1997 gives the following results: for equal kurtosis 124.46 (< 144.35 as X2 critical value at 5 per cent); for equal skewness 20.88 (< 144.35 as X2 critical value at 5 per cent); for equal distributions 20.45 (<36.41 as X2 critical value 5 per cent).
18
and to maximize the data quality. We chose 40 stocks for continuity with today’s CAC-40 and because we considered 40 as a sufficient number for diversification purposes. Somewhat higher numbers would also be consistent with this rationale, but not necessary; broadening the index to 50 stocks would not change much, in any case, because the marginal stocks have very small capitalizations compared to the first 40. Figure 4 shows that the weight of the last 10 stocks included in the CAC-40 is 8 per cent on average between 1854 and 2006, the weight of the 40th one being 0.69 per cent on average. Adding a few more stocks would probably have little effect on the index. Admittedly, a constant number of stocks in the index implies a varying weight of the CAC-40 firms within total market capitalization of Paris-listed stocks, but as we mentioned earlier, this variation has no trend. We consider this is not as important an issue as the standard diversification behaviour of investors.
FIGURE 4 AROUND HERE
A last robustness check is provided by the calculation of an equally-weighted index based on the same sample as ours. Unsurprisingly, the performance of the equally-weighted index, which over-weights the (relatively) small firms in the index, is better than that of our capitalization-weighted index (table 8). This confirms the importance of a strict selection method and of the frequent adjustments in sample and weights.
TABLE 8 AROUND HERE
III RESULTS
Nominal performance
Table 9 summarizes the price variations, dividend yields and total nominal return of the CAC-40 from 1854 to 2006 and for various sub-periods (the choice of which we explain below). Over the whole period, total nominal return was 8.02 per cent (arithmetic mean), from which the dividend yield represented 3.84 per cent per year, almost as much as capital gains –price variations in the index – which attained 4.18 per cent per year on average. If we exclude the 1914-1950 “wars” period for the moment, total nominal return increased from 5.55 per cent before 1914 to 7.28 per cent from 1951 to 1982 and a record 15.98 per cent from 1983 to 2006.
19
TABLE 9 AROUND HERE
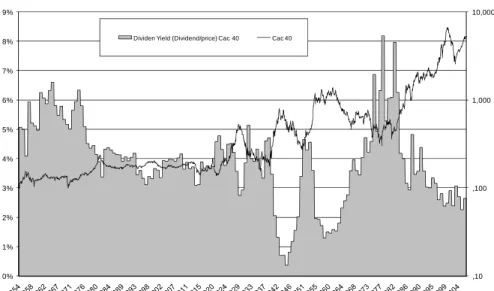
Over the period, the relative contributions of dividends and capital gains varied substantially. Their relative volatilities were also very different. Capital gains almost permanently increased, from a very low level of 1.11 per cent per year before 1914 to 2.8 per cent in the interwar period, 3.63 per cent from 1951 to 1982 and 12.83 per cent in the recent 1983-2006 period. It is not surprising, then, that dividends represented a decreasing proportion of total return. While dividend yields averaged 4.52 per cent before World War 1 (more than 80 per cent of total return), they decreased to 3.87 per cent in the interwar period, 3.64 per cent from 1951 to 1982 and 3.15 per cent from 1983 to 2006.
Unsurprisingly, prices were much more volatile than dividends with respective standard deviations of 19.12 per cent and 1.39 per cent for the whole period. The volatility of the pure-price index increased from a low 7.32 per cent before 1914 to 20.88 per cent in the interwar period and around 24 per cent after 1950.
World War 1 appears as a rupture in volatility series (Figure 5). After a long period of decreasing volatility from 1854 to 1914, it increased sharply and remained high throughout the 20th century. On average, standard deviation almost tripled from the 19th century to the 20th. A chi-squared test comparing the distribution of monthly variations for 1854-1913 and the same number of months after 1914 clearly rejects the hypothesis of identical distributions44. This much higher volatility could be interpreted as the sign of a high inflation risk, although its persistence in the most recent period suggests another explanation may be necessary.
FIGURE 5 AROUND HERE
The volatility of dividends was much lower and stable, with a standard deviation below 2 per cent during all sub-periods. Actually, dividend smoothing was probably a standard practice in the short run, as can be seen in Figure 6, where most of the short run changes in dividend yield can be accounted for by variations in stock prices rather than by autonomous changes in dividends.
FIGURE 6 AROUND HERE
44
This test does not suppose a Gaussian distribution (see below): we distribute the variations in classes by quarter of standard deviation, which allows us to compare the distributions directly.
20
Overall, the decreasing importance of dividends is consistent with the change of dividend behaviour that has been documented in various countries for the period around the First World War. It can be interpreted as a tax optimization choice, since in many countries (including France) the taxation of dividends increased substantially during that period compared to that of capital gains. It can also result from changes in corporate governance and investment strategies, especially the emergence of modern corporations in which shareholders were marginalized by managers and profits were increasingly reinvested45.
Up to now, our results are more or less in line with the standard history of stock prices, in which the most significant changes are the acceleration of capital gains and the relative decrease of dividends in the 20th century, in relation to the emergence of general inflation in that period. What is most specific to France is the real performance, once that inflation is taken into account.
Real performance: wars or policy regime changes?
The real long term performance of the CAC-40 index (without dividends) was significantly negative from 1854 to 2006: with on average a 4.18 per cent increase, the CAC-40 was far from the average inflation of 5.64 per cent (see figure 7 and table 10, section A). Real returns actually reflect mostly the impact of inflation: they were slightly positive (0.7 per cent per year) before 1914, negative from 1914 to 1982 (-7.4 per cent per year) and again positive since 1983 (10.42 per cent on average).
FIGURE 7 AND TABLE 10 AROUND HERE
To our knowledge, a negative return for such a long period is unique to the French market. One may wonder whether the problems lie in the consumer price indices we used. We don’t think so, for a number of reasons. Firstly, French price indices were developed since the late 19th century by
45
A.A. Berle, and G. Means. The Modern Corporation and Private Property (New York, 1932); A. D. Chandler, The Visible Hand, The Managerial Revolution in American Business (Cambridge, 1977). J. Rutterford, “From Dividend Yield to Discounted Cash Flows: a History of U.K. and U.S. Equity Valuation Techniques”, Accounting, Business and Financial History, 14, no. 2 (2004), pp. 115-49 suggests the dividend was long the major information on stock value, hence high dividend yields as a proportion of total returns. W. Goetzmann, “Patterns in three centuries of stock market data”, Journal of
21
quality and up-to-date statisticians involved in international methodological discussions, so there is no reason for French indices to be more upward-biased than those of other countries46. Secondly, contrary to stock market indices, they have been checked for consistency with other macroeconomic variables for decades47. Thirdly, biases could also be downward, since underestimates during periods of price controls (wars in particular, but for some products in France up to the 1980s) may not have been corrected in the later periods. Fourthly, the underestimation of quality changes, which is the most-argued reason for upward biases in consumer price indices, is likely to be more important in low inflation and service-dominated economies such as the French one in the recent period, precisely the only one during which the real performances of the stock market are high.
One may argue that a correct measure must include the reinvestment of dividends to appreciate the total return. On that account, the average total real return from 1854 to 2006 was only 3.05 per cent, far from the 8.3 per cent observed for US stocks48. Furthermore, this performance was not constant over time. A clear regime change appeared with World War One. From 1854 to 1913, the CAC-40 holder who reinvested all his dividends earned a 5.39 per cent yearly real total return, slightly below the 5.58 per cent nominal one, when from 1914 to 2006, the nominal total return increased to 9.61 per cent, but real total return decreased to 1.53 per cent (and a negative –1,26 per cent in geometric mean). These period to period changes are all statistically highly significant, and the radical departure from 19th century metallic standards and price stability with the start of World War One makes it unnecessary to use technical tools to identify the watershed date. One must conclude that investment in French equities just protected wealth against inflation during that period, even when reinvesting all dividends, something which has been observed in other countries, but never for such a long period49.
46
A. Desrosières, The Politics of Large Numbers. A History of Statistical Reasoning (Cambridge, Ma., 1998) (first publication in French, Paris, 1993).
47
M. Lévy-Leboyer and F. Bourguignon, L'économie française au XIXe siècle, (Paris, 1985) (Engl. trans. Cambridge, 1990) ; P. Villa, Une analyse macroéconomique de la France au XXe siècle, Paris, CNRS, 1993.
48
J. Siegel, Stocks for the Long Run: a Guide to Selecting Markets for Long-Term Growth (New York,
1994).
49
The literature on the relationships between stock real returns and inflation is huge. It frequently finds some negative correlation for the short run, but not in the long run. See J. Boudoukh and M. Richardson.
22
The literature has already highlighted the negative impact of the wars on the returns on equity investments50, but has never found it as important and long-lasting as we do. In order to distinguish the immediate impact of the wars from more lasting impact on returns, sections F and H of table 10 measure the impact of both wars when including in the “war period” the years until GDP returned to its pre-war level (1922 after World War One, 1950 after World War Two). The total yearly returns of the CAC-40 during these two war periods are particularly bad, below –10 per cent in both cases in real terms, in particular because of high average inflation rates (during World War Two, dividends were legally capped, which may have contributed to low returns). A broader view, in line with the characterization (by no less than Winston Churchill) of the whole 1914-1945 period as the “Second Thirty Years War”51, suggests that we consider the entire 1914-1950 period as one of war and reconstruction, in which low returns were the price paid by wealth owners for the destruction and costs of the wars. That perspective fits well with our data, which show that the yearly real total return of the CAC-40 was hardly positive during the 1923-1939 period (a consequence of some remaining inflation in the mid-1920s, of the Great Depression, and of renewed inflation in the run-up to the war from 1936 onward).
We could then consider that the “normal period” only resumed in 1951. Does this period represent a comeback to the sort of performances the French financial market provided before World War One? The answer to that question is not straightforward, as can be inferred from Figure 8. On the one hand,
“Stock Returns and Inflation: A Long-Horizon Perspective”, American Economic Review, 83 no. 1 (1993), pp. 1346-55; R. Geske and R. Roll. “The Fiscal and Monetary Linkage Between Stock Returns and Inflation”, Journal of Finance, 38, n°1 (1983), pp. 1-33, E. Fama “Stocks returns, Real Activity, Inflation and Money”, The American Economic Review, 71, no. 4 (1981), pp. 545-65; D. P. Ely and K. J. Robinson. “The Stock Market and Inflation: A Synthesis of the Theory and Evidence”, Economic Review, Federal Reserve Bank of Dallas, March (1989), pp. 17-29; Siegel, Stocks for the Long Run, p. 158; W. Sharpe, A. Gordon, and J. Bailey. Investments, (Englewood Cliffs, 1999), p. 137; Ibbotson Associates. “Annual Stock Return and Rates of Inflation, 1926-1996”, Stocks, Bonds, Bills and Inflation 1997
Yearbook, Chicago: Ibbotson Associates, 1997.
50
E. Dimson, P. Marsh and M. Staunton, “Irrational Optimism”, Financial Analysts Journal, 60, no. 1 (2004), pp. 15-25.
51
P. Temin, “The Transmission of the Great Depression”, Journal of Economic Perspectives, 7, no. 2 (1993), pp. 87-102, p. 88.
23
the 1951-2006 period considered as a whole presents very similar returns to those of the pre-1914 period (6.38 per cent yearly real total return between 1951 and 2006, compared to 5.39 per cent, see table 10), even if volatility remains much higher (24.64 per cent compared to 8.86 per cent before 1914 for standard deviation of real returns). On the other hand, this period is quite heterogeneous according to many criteria.
FIGURE 8 AROUND HERE
A first one – a major one for our subject – is inflation. If one wonders when the long inflationary experience that started in 1914 ended, two dates stand out as worth investigating. The first is 1958, when France established a new Republic, adopted a convertible currency under the Bretton-Woods system and implemented the stabilization policy that was considered necessary in order to do that (the Pinay-Rueff plan). The decade from 1959 was actually one of stable prices and a stable French currency anchored on the gold standard. But it may be considered a parenthesis, since inflation again rose above 5 per cent a year as soon as 1969. The second possible regime change is the “tournant de la rigueur” (move to a policy of “austerity”) under President Mitterrand, when Keynesian macroeconomic policies were abandoned and monetary stabilization made a priority (a move dated either from the second devaluation of June 1982 or, more frequently, from March 1983). From 1983 on, the inflation rate remained below 10 per cent by year. And the average inflation rate, which was as high as 15 per cent during the “Thirty Years War”, and still 6.5 per cent from 1950 to 1982, fell to only 2.5 per cent after 1983. This suggests that 1983 was the actual end of the long inflation episode. Another reason for considering the 1983 change as important can be seen in Figures 1 and 8: the 1958 stabilization actually does not correspond to any marked change in the CAC-40, which was increasing up until 1955 and started decreasing from 1962 until it reached three minimum values in August 1967 (468 points), February 1978 (307 points) and July 1981 (370 points). However, a clear switch to a period of sharply-rising stock prices can be observed in 1983. We then give in Table 10 (sections J, K, B and L) the values for long term performances for the 1951-1982 period as well as for the 1951-2006 period, and for 1854-1913 and 1983-2006 for comparison. The real performance of the CAC-40 changed from approximately 5 per cent per year before 1914 to null or slightly negative from 1951 to 1982, and to a positive 10.6 per cent from 1983 to 2006. That glorious final period brings the average
24
yearly real returns during the second half of the 20th century to levels above those of the late 19th century.
Then, we may consider that the major reason for the low performance of the CAC-40 index in the 20th century is the succession of two World Wars in the first half of the century. If we exclude these periods (as in section B of Table 10) the CAC-40 performs reasonably well over the very long run, although not as well as the US stock market. This is also true if we consider only the second half of the 20th century. Nevertheless, it remains intriguing that this period includes two such different sub-periods. This suggests that not only the World Wars, but maybe also policy regime changes may have a role in explaining the long term performances of the Paris stock market.
In summary, when the 19th century appears as a normal and comprehensible period from the point of view of contemporary stock markets, the 20th century proves more difficult to assess. Two different accounts of the 20th century are possible. The first considers the long war period as the only reason for low stock returns, and insists on the normal level of equity returns over the very long term after 1950. The other, consistent with the “short 20th century” (1914-1982) view, considers that the period of exceptionally low real returns stopped only in 1983, a moment at which those who owned (or bought) stocks benefited from an exceptional increase in prices and returns, lasting up until recently. That view also claims that the recent period (since 1983) does not appear as a return to the 19th century: not only are overall real returns higher (which may result mostly from a shorter period, which incorporates little bear market yet), but volatility remains very high (actually slightly higher than in the “20th century”) and dividends remain low.
Comparison with other investments
A well-known result of US long term investment is the equity premium puzzle: in the long run, equities perform not only better than other investments, but the return they provide is higher than what their higher volatility requires as a compensation for risk. Although no explanation for this fact has found widespread acceptance, it has provoked much discussion; its validity outside the U.S. still requires detailed scrutiny using high quality data. In the French case, an equity premium also exists for the whole of our long period, but it remains low. Stocks are the best investment despite long periods of
25
negative real returns since bonds and the money market perform even worse. As shown in Table 11, the equity premium compared to bonds was 1.75 per cent on average from 1854 to 2006, and was below 2.5 per cent during all sub-periods except World War Two and the most recent period.
TABLE 11 AROUNDHERE
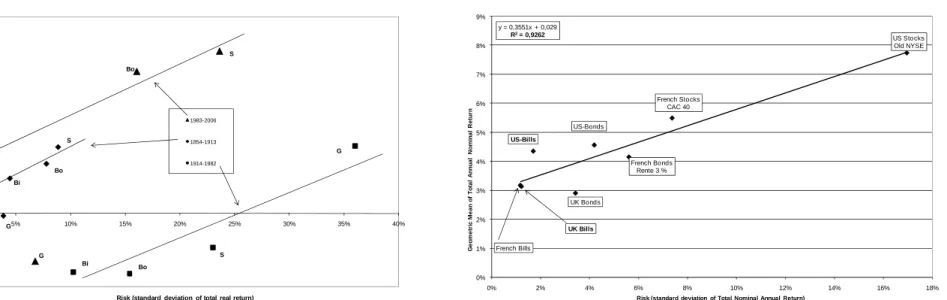
This level of equity premium seems more consistent with standard financial theory than the levels found in the US. Figure 9 draws a risk line for the French financial market for various sub-periods and table 10 gives detailed data for all periods. Although the evidence is indicative rather than conclusive, given the limited number of separate points included, Figure 9 suggests that returns were to some extent related to risks, with no excessive risk premium for equities.
FIGURE 9 AROUND HERE
Two points are striking. One is that the risk line moved a lot during the 1914-1982 period, compared to its position for the previous and subsequent periods. The second is the high risk and high return for investments in gold precisely from 1914 to 1982. In a period of unstable monetary regime, during which France was on the verge of hyperinflation at least once (at the end of World War Two), gold became a valeur refuge that was highly priced by French investors52. Holding gold allowed one to escape both taxation and monetary confiscation, and provided sufficient liquidity despite the legal risks. In particular, gold was internationally valued and then provided for international diversification when it was forbidden by exchange controls. This was not an absurd behaviour, as has frequently been argued, since gold obtained the highest average return on that period despite paying no income. From the position of gold on the risk line, we can argue that an optimal French portfolio in keeping with the Markowitz definition should have included a significant proportion of gold from 1914 to 1982. This suggests French investors were rational in investing so much in gold, even if it may have been costly in terms of lost economic growth. On the other hand, gold was an underperforming asset during periods of stable prices, even if recent events suggest it can still protect against some risks.
52
Some of the prices for gold used here are measured on the black market, since at some periods there was no free market for gold in France. This may affect their reliability on the short run, and the volatility observed.
26
In summary, when stocks dominate gold (in stable periods) they also dominate bonds, while when gold beats stock (in inflationary periods) it also beats bonds. Then, the issue for French investors was not one of choosing over financial instruments but whether to invest in the (French) financial market or not.
Investments in real estate may have been even better than gold. Existing data suggest not only that the return on a flat bought and rented out in Paris was approximately as high as the return on gold, but also that the risk was much lower53. This may explain why real estate investment was so much favoured by the French as a protection against inflation. Nevertheless, these high performances may also result from a simple liquidity premium and a survivor bias, since the success of Paris as a major international city cannot be compared to that of many other French towns, not to mention rural areas whose population fell during the period. It may well be that although the owners of Parisian flats did well by renting and reselling them (with a negative period of rent constraint mostly limited to 1914-50), the result cannot be extended to other real-estate investments.
Our data also look consistent with the performances of other markets: the risk line for 1854-1913 drawn on Figure 10 suggests that returns in France were consistent with those for various financial assets on other markets. Jorion and Goetzmann suggested that the equity premium in the U.S. may be the result of a survivor bias at the level of the American market as a whole, compared to the global stock market, and that the U.S. actually diverged from most European countries after 1914, since they were much less affected by the two World Wars54. Our data suggest that the U.S. market performance was already very high before 1914, but also that this was the normal price to be paid to those willing
53
J. Friggit “Long Term (1800-2005) Investment in Gold, Bonds, Stocks and Housing in France – with Insights into the USA and the UK: a Few Regularities”, Working Paper, 2007, available at :
http://www.adef.org/statistiques/engstathome.htm, builds an index for Parisian real estate using a repeated sales methodology; F. Simonnet, G. Gallais-Hamonno, and P. Arbulu "Un siècle de placement immobilier, l'exemple de La Fourmi Immobilière", Journal de la Société de Statistique de Paris, 2ème trimestre 139, no2, (1998), pp. 95-135, collect stock prices of La Fourmi Immobilière, a firm who managed the same Parisian buildings on a pure-equity basis from 1905 to 1995.
54
27
to participate in such a risky market compared to the French one55, making its holding consistent with an optimal international allocation of capital56.
FIGURE 10 AROUND HERE
A long marginalized financial market
The poor performance of the French stock index for the “short 20th century” might result from inefficient pricing or from exogenous shocks on the French economy. We will argue in another article that the functioning of the French market was not qualitatively different from that of other markets. We will show below that the behaviour of the index cannot be separated from the long decline in financial markets in 20th century France, itself a by-product of its economic and political history.
We consider that the singular trajectory of the CAC-40 must be related to the structural changes in the French financial market during the 20th century. The first one is the impact of the wars. This is visible in the evolution of dividend payments (Figure 11), which fell after the First and even more after the Second World War (beyond the cap imposed during the war). It resulted partly from the negative impact of the wars on profits, and partly from inflation, which made nominal profits and dividends appear higher than their true level, and exposed them to high taxes. In the case of public utilities subject to government price regulation, inflation frequently led to price caps and to a reduction in profits57. As we already mentioned, the decrease in dividend yields may have resulted from an adaptation of firms to the rise in corporate and personal income taxes, a rise which was very sharp during and after World War One and was followed by a gradual decrease that only really started in
55
The US index used here is broader than ours, which may partly explain a higher return and volatility, but the difference is too big to be explained entirely by that fact.
56
D. Le Bris, “Why Did French Investors Buy Foreign Assets Before World War One?”, Working Paper, 2008.
57
P.-C. Hautcoeur and S. Grottard, “Taxation of Corporate Profits, Inflation and Income Distribution in France, 1914-1926”, Working paper, Delta, 2001.
28
196058. The 1914 level of overall dividend payments by the CAC-40 firms was not surpassed until 1968.
FIGURE 11 AROUND HERE
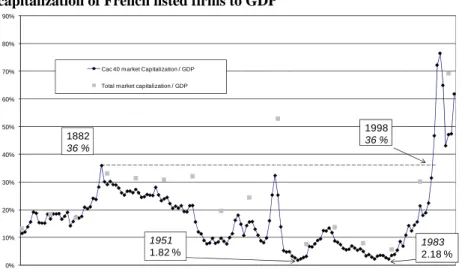
The main explanation for this is not an overall stagnation of the economy or even of profits. It is the government interference in many firms, and especially the nationalization of many of the biggest corporations. The nationalized firms were certainly not always as profitable as they had been previously, as in the case of the railways, whose profits had been stagnating for years (partly because of regulation). Nevertheless, the nationalization of the arms industry and the railways (1937), and after World War Two that of the electricity, coal, gas, insurance and banking industries (including Bank of France), deprived the stock markets of many of their biggest listed securities. The last (short-lived) case was the 1982 nationalization of major industrial firms (Thomson, Saint-Gobain, Rhône-Poulenc, Pechiney-Ugine-Kuhlman, Usinor) and the remaining big banks (Indosuez, Paribas, CIC, Crédit du Nord, CCF, Rothschild). This explains the evolution of the ratio of CAC-40 firms (and of total capitalization) to GDP (Figure 12).
FIGURE 12 AROUND HERE
In 1983, the ratio of CAC-40 capitalization to GDP was minimal59. It rose sharply in the next two decades thanks to two radical moves: the privatization of almost all the government-owned manufacturing, financial and utilities firms, and the rise in the stock index. This rise was also largely the result of the regime change of 1983, by which the French government allowed the financial market to play a major role in the economy again. A substantial rise in profits, which was a condition for French firms to attract investors, followed, and French stock prices became well integrated with international markets (especially after the suppression of the last exchange controls in 1986). From 1983 onwards, then, the stock index again provides a measure that is relevant for the study of the French economy. This is confirmed by a simple measure: the most important sudden (month to month)
58
On the creation of profit taxation in France and the problems in measuring its impact in an inflationary period, see Hautcoeur & Grottard, “Taxation of Corporate Profit”; on the taxation level in France in the 20th century, see Th. Piketty, Les hauts revenus en France au XXe siècle (Paris, 2001).
59
Minima were reached in 1951 (1.82 per cent) and 1983 (2.18 per cent). The 1882 maximum of 36 per cent for the CAC-40 was reached again in 1998.